
ABSTRACT
Using nanoparticles to impart extrinsic rippling in graphene is a relatively new method to induce strain and to tailor the properties of graphene. Here, we study the structure and elastic properties of graphene grown by chemical vapour deposition and transferred onto a continuous layer of SiO2 nanoparticles with diameters of around 25 nm, prepared by Langmuir–Blodgett technique on Si substrate. We show that the transferred graphene follows only roughly the morphology induced by nanoparticles. The graphene membrane parts bridging the nanoparticles are suspended and their adhesion to the atomic force microscope tip is larger compared to that of supported graphene parts. These suspended graphene regions can be deformed with forces of the order of 10 nN. The elastic modulus of graphene was determined from indentation measurements performed on suspended membrane regions with diameters in the 100 nm range.
1. Introduction
Graphene has exceptional mechanical properties like the extremely high in-plane stiffness and superior strength.[Citation1,Citation2] These properties are very important for applications in nanoelectromechanical systems, or to fabricate nanocomposites with graphene inclusions as structural material. The elastic constants of graphene obtained by various calculation methods are summarised in a recent review.[Citation3] The Young's modulus of monolayer [Citation4] and few-layer graphene [Citation5] was measured by atomic force microscopy (AFM) indentation on micrometre-scale suspended graphene, bridging trenches or wells etched in silicon dioxide. It was experimentally found that the graphene shows both non-linear elastic behaviour and brittle fracture.[Citation4] Here, we were able to study the elastic properties of graphene suspended between SiO2 nanoparticles (NPs), by deforming nanomembranes with diameters in the range of 100 nm, i.e. one order of magnitude less than in previous experiments.[Citation4,Citation6] We mapped by PeakForce® AFM the nanoscale mechanical properties of graphene transferred onto a continuous layer of SiO2 NPs. We showed the differences in adhesion and deformation characteristics between supported and suspended graphene regions by comparing the nanomechanical data with topography. Based on the acquired adhesion maps, we identify extended graphene regions suspended between NPs and show that these suspended regions can be deformed by forces of the order of 10 nN. Additionally, by transferring graphene onto SiO2 NPs we introduced significant extrinsic rippling in graphene.[Citation7,Citation8] Such rippling can affect the electronic properties of graphene by contributing to the scattering of charge carriers.[Citation9,Citation10] Nevertheless, rippled graphene can be good candidate for sensing, as simulations [Citation11,Citation12] predict enhanced chemical activity in corrugated graphene.
2. Materials and methods
Amorphous silica NPs with diameter of ∼25 nm were synthesised according to the Stöber-method.[Citation13,Citation14] First, a solution containing 50 ml ethanol, 1.594 ml of NH3 (32%) and 0.44625 ml of ultrapure H2O was stirred for 30 min. Then, 2 ml tetraethyl orthosilicate (98%) was added to this solution and stirred overnight. Finally, the ammonia was removed by distillation at 60 °C. Langmuir–Blodgett (LB) films of the NPs were prepared in a KSV 2000 film balance. The ethanolic solution of NPs was sonicated for 5 min, then mixed with chloroform (Scharlau, reagent grade, stabilised with ethanol) and spread at the air/water interface. The particles were compressed at a barrier speed of 0.4 cm2/s. When the surface pressure reached ∼1 mN/m, the speed was lowered to 0.2 cm2/s. The LB films were prepared by vertical deposition (6 mm/min) at ca. 80% of the collapse pressure, which was measured before. We used silicon wafers as substrates, cleaned with acetone, water, 2% hydrofluoric acid solution, and finally rinsed in water.
Graphene was grown by chemical vapour deposition (CVD) on a 25 µm thick copper foil (99.8% purity). The CVD furnace was evacuated to ∼10−4 torr and the temperature was raised to 1010 °C with H2 gas flow (∼10−2 torr). When the temperature became stable, both CH4 (20 sccm) and H2 (5 sccm) were injected into the furnace for 8 min to synthesise the graphene. After the growth, we cooled down the furnace with a cooling rate of 50 °C/min.
The transfer of graphene onto the SiO2 NPs was done using thermal release tape (TRT, Graphene Supermarket) and copper etchant (20% of CuCl2 mixed with 37% HCl in 4:1 volume ratio). After etching the copper, the TRT holding the graphene was rinsed in distilled water, dried and pressed onto the nanoparticle-decorated Si surface. The sample was placed on a hot plate heated above the release temperature of the tape (90 °C). After 1 min the TRT was removed, leaving behind the graphene on top of SiO2 NPs. The sample was annealed at 400 °C in N2 atmosphere for 2 hours in order to improve the contact of graphene with the NPs.
The sample was investigated both before and after annealing by a MultiMode 8 AFM from Bruker operating under ambient conditions. PeakForce® tapping mode was used to perform scans at well-defined forces. Peakforce tapping is a relatively new scanning mode, where the probe and sample are intermittently brought together (similar to tapping mode) to contact the surface for a short period, which eliminates lateral forces. While in tapping mode the feedback loop keeps the cantilever vibration amplitude constant, peakforce tapping controls the maximum force (peakforce) on the tip.[Citation15] A complete force-distance curve is performed in every measuring point, while the z-piezo data of the cantilever are recorded at the maximum force between the sample and the cantilever. Analysis of force curve data is done on the fly, providing maps of multiple mechanical properties (e.g. adhesion, deformation, etc.) that have the same resolution as the height image. The maximum force can be changed in order to acquire images at different sample-cantilever forces. For the indentation experiments on suspended graphene, we used an AFM cantilever with tip radius R ≃ 8 nm and spring constant k = 10.4 N/m, as determined in situ by the thermal tune method.[Citation16]
3. Results and discussion
During the dry transfer procedure using TRT, the CVD graphene breaks into sheets with different sizes, typically of several micrometres. The AFM topographic image in (a) shows the film of closely spaced SiO2 NPs, and a graphene sheet on top of NPs. Since the graphene follows the corrugation induced by the NPs, it is hardly observable in the topographic image. The measurements were performed in PeakForce® mode, where the adhesion properties of the surface can be recorded in parallel with topographic data. (b) shows the adhesion map of the area presented in (a). The light-coloured regions show increased adhesion between the sample and the AFM tip and these regions correspond to graphene-covered areas, whereas dark-coloured regions correspond to bare SiO2 NPs. A line section taken along the white line in (a) is shown in (c), which shows the corrugated nature of graphene. This line section was drawn intentionally to include pit, i.e. a dark-coloured spot on the topographic image. This pit corresponds to a small area on the Si substrate where no NPs are present, which allows measuring the diameters of the NPs.
Figure 1. Peakforce AFM images of graphene-covered SiO2 nanoparticle film. (a) AFM topographic data. (b) Adhesion map corresponding to the area in (a). (c) Line section along the white line in (a).
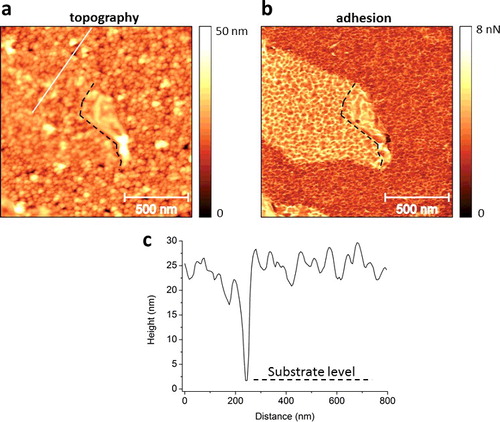
According to (c), the average height of the NPs relative to the Si substrate is around 25 nm, which approximately corresponds to an average nanoparticle diameter. The line section also shows that graphene is completely separated from the Si substrate. It is either supported by NPs, either suspended between them, but it never reaches the substrate level. Note that the end part of the graphene sheet is back-folded, and this folded region is easier to observe in the topographic image (centre of (a)). We marked with dashed line in (a) and (b) the border of this back-folded graphene.
We acquired AFM images at different tip-sample interaction forces. For example, (a) and (b) shows the topographic images of the same graphene-covered area measured with tapping forces of 1 and 40 nN, respectively. One can observe that the measured topography is slightly different in these two cases. To illustrate this, let us consider the two height profiles in (c), taken along the same line section (black line in (a) and (b)), corresponding to the two different tapping forces.
Figure 2. Peakforce AFM images of SiO2 nanoparticle-supported graphene measured at a tip-sample force of (a) 1 nN and (b) 40 nN. (c) Height profiles along the line sections in (a) and (b) (black lines).
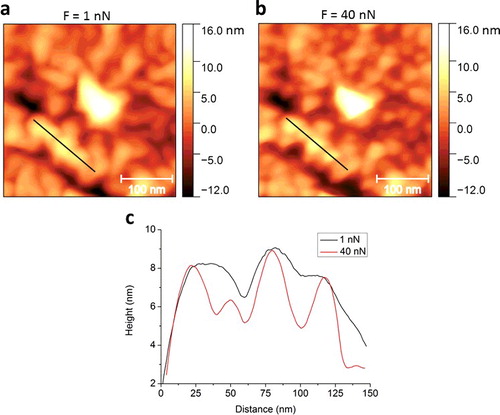
The height profile measured at 40 nN displays four peaks, while the profile at 1 nN displays only three. Additionally, at 1 nN the height values are considerably larger between the peaks. This shows that graphene is actually loosely bound to the NPs, not following exactly their morphology. There are significant suspended parts between the NPs, and the low force used for the measurement does not deform the structure. In contrast, when imaged at 40 nN, these suspended parts are deformed and pushed against the underlying NPs. Hence, a fourth (smaller) peak is evidenced in the height profile in (c), which corresponds to a nanoparticle with smaller diameter. Comparing (a) and (b), we can assert that in general, the NPs under graphene are better resolved when imaging at higher tip-sample forces. The light-coloured area in the centre of (a) and (b) is attributed to a small cluster of NPs which protrudes from the otherwise monolayer NP film.
Next, we annealed the sample at 400 °C in N2 atmosphere, in order to promote the adhesion [Citation17] of graphene to the nanoparticle film. We showed previously that the nanoscale rippling of graphene on NPs can be modified by annealing, and a small compressive strain can be induced.[Citation18] Indeed, after annealing graphene follows more closely the morphology of the NPs, as shown by the AFM image in (a), where graphene covers the entire area.
Figure 3. (Colour online) Simultaneously acquired peakforce AFM images of graphene-covered nanoparticles after annealing. (a) Topography measured at a peakforce of 8 nN. (b) Adhesion. (c) Deformation. (d) Typical force-distance curve (after Ref. [Citation15]) indicating how adhesion and deformation data are extracted. Both the ‘approach’ (blue line) and the ‘withdraw’ (red dotted line) curves are displayed. Graphene is either directly supported by NPs (e.g. the areas denoted with blue circles in (a)–(c)) or it is suspended between them (e.g. the areas denoted with black (a) and white circles in (a) and (c)).
![Figure 3. (Colour online) Simultaneously acquired peakforce AFM images of graphene-covered nanoparticles after annealing. (a) Topography measured at a peakforce of 8 nN. (b) Adhesion. (c) Deformation. (d) Typical force-distance curve (after Ref. [Citation15]) indicating how adhesion and deformation data are extracted. Both the ‘approach’ (blue line) and the ‘withdraw’ (red dotted line) curves are displayed. Graphene is either directly supported by NPs (e.g. the areas denoted with blue circles in (a)–(c)) or it is suspended between them (e.g. the areas denoted with black (a) and white circles in (a) and (c)).](/cms/asset/f64cf728-a3eb-448b-8020-c75fa6bc6825/tjen_a_1159741_f0003_oc.jpg)
Individual NPs can be very well distinguished. The corresponding adhesion map ((b)) displays a variation of the adhesive force measured between the AFM tip and graphene. Comparing the adhesion map with the topography, it turned out that this variation is due to the condition in which graphene is present. Nanoparticle-supported graphene parts (e.g. blue circles in (a)) display lower adhesion to the tip (blue circles in (b)). These graphene parts are not deformed significantly during the AFM measurements (blue circles in (c)). In contrast, the graphene parts suspended between NPs display 2–3 times larger adhesion to the tip (light-coloured regions in (b)). In some cases we observe suspended graphene areas which can be considered as circular membranes with diameters around 100 nm. Such suspended graphene membranes can be deformed by the AFM tip, as it can be observed in (c). Here, the larger deformation data inside the white circle correspond to the suspended membrane marked also by white circle in (a). The deformation data in (c) are calculated using the approach force-distance curve, and it is the difference in tip-sample separation from the point where the force is zero to the peak force point ((d)). We performed nanoindentation experiments on the suspended graphene membrane in (a) (black circle). The same area was scanned repeatedly by increasing gradually the peakforce from 2 to 128 nN. A complete image was recorded for every force set-point (F). Selected height profiles are shown in (a), which were taken along the same line section shown in (a) (white line), extracted from the AFM images measured with the corresponding tip-sample force values. The force-induced deflection (δ) of the suspended graphene was measured as the difference between crests and troughs of the height profiles. Force-deflection data were obtained, as shown in (b).
Figure 4. (Colour online) Nanoindentation performed on the suspended graphene nanomembrane marked with black circle in (a). (a) Height profiles taken along the same line section (white line in (a)), measured at different load forces (F). (b) Force-deflection data.
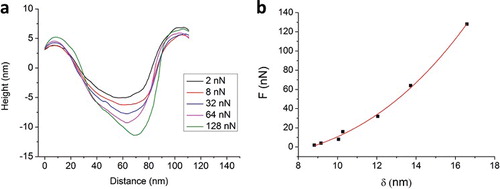
We note that the deflection induced by larger forces is reversible, and the indentation does not lead to plastic deformation of the suspended membrane. We interpret the experiments in the framework of the indentation model of a circular monolayer graphene using a spherical indenter.[Citation19] The graphene area considered has a radius of approximately a = 45 nm ((a), black circle), while the nominal radius of the AFM tip is R ≃ 8 nm. We fitted the force-deflection data with , where the coefficients c and d are related to the Young's modulus E and pre-tension
of a membrane of thickness h (0.34 nm for graphene).[Citation4,Citation19,Citation20,Citation21] Since
, we use the sphere load model (
), with
![]() .[Citation22,Citation23] Here
.[Citation22,Citation23] Here , with
the Poisson's ratio for monolayer graphene.[Citation4,Citation24] From the fit, we obtain the tensile modulus
TPa. We carried out similar nanoindentation experiments on other suspended graphene nanomembranes as well, using stiffer AFM cantilevers,[Citation18] and we calculated the tensile moduli as above. We obtained an average Young's modulus of Eavg = 0.88 TPa, which is close to the value of 1 TPa, found in previous experiments on both CVD-grown [Citation6] and exfoliated samples.[Citation4,Citation25,Citation26] The lower Young's modulus obtained in this work is probably related to the deviation of the actual geometry of the suspended graphene and the indenter from the circular and spherical shapes, respectively, used to fit the results. Another difference compared to previous works is that we used the sphere load model due to the higher
ratio.[Citation19] In this case, the deviations from the ideal geometries can affect the result more significantly than in the case of point load model, where the radius of the graphene membrane is much larger than the radius of the indenter (
![]() ).[Citation4,Citation19] Based on the AFM images performed at different forces, we do not observe any movement of the silica NPs during the indentation. However, we cannot exclude that graphene can slightly slide on some NPs when measured at larger forces, which can increase the measured deflection data and thus lower the derived Young's modulus.
).[Citation4,Citation19] Based on the AFM images performed at different forces, we do not observe any movement of the silica NPs during the indentation. However, we cannot exclude that graphene can slightly slide on some NPs when measured at larger forces, which can increase the measured deflection data and thus lower the derived Young's modulus.
4. Conclusions
In summary, we have investigated by peakforce AFM the properties of CVD-grown graphene transferred onto a LM film of SiO2NPs. We showed by imaging at different interaction forces that the as-transferred graphene is only loosely bound to the NPs, not following exactly their morphology. The binding of graphene to NPs was improved by annealing.
We revealed extended graphene regions suspended between silica NPs by comparing the simultaneously measured topography, adhesion and deformation maps. The observed spatial variation in the adhesion is due to the fact that suspended graphene displays up to three times larger adhesion to the AFM tip. These graphene parts are also deformed more significantly during the AFM measurements. We investigated the elastic properties of suspended graphene by performing local indentation experiments on nanomembranes of 100 nm in diameter. We fitted the experimental force-deflection data using the sphere load model and obtained an average Young's modulus of Eavg = 0.88 TPa. Finally, we showed that the extrinsic morphology of transferred graphene is regulated by the underlying NPs, which can open new pathways to fine tune the properties of graphene.
Acknowledgments
The research leading to these results has received funding from the People Programme (Marie Curie Actions) of the European Union's Seventh Framework Programme under REA grant agreement n° 334377, and from the Korea-Hungary Joint Laboratory for Nanosciences. The OTKA grants K-101599, PD-105173 in Hungary, as well as the János Bolyai Research Fellowships from the Hungarian Academy of Sciences are acknowledged. C. H. acknowledges funding from the Nano-Material Technology Development Program (2012M3A7B4049888) through the National Research Foundation of Korea (NRF) funded by the Ministry of Science, ICT and Future Planning.
Disclosure statement
No potential conflict of interest was reported by the authors.
Additional information
Funding
References
- Geim AK. Graphene: status and prospects. Science. 2009;324:1530–1534.
- Ovid'ko IA. Mechanical properties of graphene. Rev Adv Mater Sci. 2013;34:1–11.
- Lambin P. Elastic properties and stability of physisorbed graphene. Appl Sci. 2014;4:282–304.
- Lee C, Wei X, Kysar JW, et al. Measurement of the elastic properties and intrinsic strength of monolayer graphene. Science. 2008;321:385–388.
- Frank IW, Tanenbaum DM, van der Zande AM, et al. J Vac Sci Technol B. 2007;25:2558–2561.
- Lee G-H, Cooper RC, An SJ, et al. High-strength chemical-vapor–deposited graphene and grain boundaries. Science. 2013;340:1073–1076.
- Yamamoto M, Pierre-Louis O, Huang J, et al “The princess and the pea” at the nanoscale: wrinkling and delamination of graphene on nanoparticles. Phys Rev X. 2012;2:041018-1–041018-11.
- Li T. Extrinsic morphology of graphene. Model Simul Mater Sci Eng. 2011;19:054005-1–054005-15.
- Katsnelson MI, Geim AK. Electron scattering on microscopic corrugations in graphene. Phil Trans R Soc A. 2008;366:195–204.
- Ni G-X, Zheng Y, Bae S, et al. Quasi-periodic nanoripples in graphene grown by chemical vapor deposition and its impact on charge transport. ACS Nano. 2012;6:1158–1164.
- Boukhvalov DW, Katsnelson MI. Enhancement of chemical activity in corrugated graphene. J Phys Chem C. 2009;113:14176–14178.
- Boukhvalov DW. Tuneable molecular doping of corrugated graphene. Surf Sci. 2010;604:2190–2193.
- Deák A, Hild E, Kovács AL, et al. Contact angle determination of nanoparticles: film balance and scanning angle reflectometry studies. Phys Chem Chem Phys. 2007;9:6359–6370.
- Deák A, Bancsi B, Tóth AL, et al. Complex Langmuir–Blodgett films from silica nanoparticles: an optical spectroscopy study. Colloids Surf A. 2006;278:10–16.
- Pittenger B, Erina N, Su C. Quantitative mechanical property mapping at the nanoscale with PeakForce QNM. Bruker Nano Surfaces Division. 2012;AN128:1–12.
- Hutter JL, Bechhoefer J. Calibration of atomic-force microscope tips. Rev Sci Instrum. 1993;64:1868–1873.
- Pang S, Englert JM, Tsao HN, et al. Extrinsic corrugation-assisted mechanical exfoliation of monolayer graphene. Adv Mater. 2010;22:5374–5377.
- Osváth Z, Gergely-Fülöp E, Nagy N, et al. Controlling the nanoscale rippling of graphene with SiO2 nanoparticles. Nanoscale. 2014;6:6030–6036.
- Tan X, Wu J, Zhang K, et al. Nanoindentation models and Young's modulus of monolayer graphene: a molecular dynamics study. Appl Phys Lett. 2013;102:071908-1–071908-4.
- Wan KT, Guo S, Dillard DA. A theoretical and numerical study of a thin clamped circular film under an external load in the presence of a tensile residual stress. Thin Solid Films. 2003;425:150–162.
- Komaragiri U, Begley MR, Simmonds JG. The mechanical response of freestanding circular elastic films under point and pressure loads. J Appl Mech. 2005;72:203–212.
- Begley MR, Mackin TJ. Spherical indentation of freestanding circular thin films in the membrane regime. J Mech Phys Solids. 2004;52:2005–2023.
- Scott ON, Begley MR, Komaragiri U, et al. Indentation of freestanding circular elastomer films using spherical indenters. Acta Materialia. 2004;52:4877–4885.
- Blakeslee OL, Proctor DG, Seldin EJ, et al. Elastic constants of compression-annealed pyrolytic graphite. J Appl Phys. 1970;41:3373–3382.
- Koenig SP, Bodetti NG, Dunn ML, et al. Ultrastrong adhesion of graphene membranes. Nat Nanotechnol. 2011;6:543–546.
- Bunch JS, Verbridge SS, Alden JS, et al. Impermeable atomic membranes from graphene sheets. Nano Lett. 2008;8:2458–2462.