
Abstract
Mutated COX-2 has become the new molecular marker of aspirin resistance. However, there is still a technical ‘bottleneck’ for direct and sensitive detection of circulating COX-2 mutant gene. In this work, we reported a simple and ultrasensitive electrochemical method for COX-2–765G/C (rs20417) detection for the first time. Polyallylamine (PAA) functionalised Pt nanostructures with long-spined sea urchin-like morphology (Pt-LSSUs@PAA) was synthesised by a simple chemical method for the construction of nano-sensing interface. Ru(NH3)63+ is used as a primary electron acceptor that is electrostatically attracted to peptide nucleic acid modified electrodes and Fe(CN)63− is introduced into the redox system as secondary electron acceptor to regenerate Ru3+ after electrochemical reduction for multiple redox cycles. Different pulse voltammetry was applied to record the electrochemical signals. Under optimal conditions, the DNA sensors showed a wide linear relationship, from 10 fM to 1 nM, with detection limits of 3.3 fM (S/N = 3). This study will provide the basis for the precise use of aspirin, and it has important guiding value for individual drug testing of cardiovascular disease.
1. Introduction
After more than a century, aspirin is one of the most commonly used drugs in western medicine for the prevention of cardiovascular diseases [Citation1]. Despite adequate aspirin therapy, 6.2–57% patients still experience cardiovascular events, the phenomenon named as aspirin resistance (AR) [Citation2]. Researchers have reported that genetic variability in cyclooxygenase-2 (COX-2)–765G/C (rs20417) affect aspirin response with cardiovascular disease and could be used as specific genetic marker of AR [Citation3,Citation4]. Therefore, it is crucial to prescreen patients for their genotypes before prescribing aspirin to facilitate target therapy and decreasing the side effects associated with prolonged administration.
Various methods have been developed for the detection of the COX-2 mutation at the DNA level. Among them is the polymerase chain reaction (PCR) or DNA sequencing [Citation5–7]. DNA sequencing is an excellent approach for research studies that seek to profile large regions of DNA, but its implementation is prohibitively expensive for routine clinical use and the slow turnaround time (2–3 weeks) is not an ideal for optimal treatment outcomes. Also, PCR is prone to interference from the components of biological samples and requires purification of the nucleic acids from samples. Therefore, a method that is simpler, and able to detect rare mutations directly in serum, is required urgently.
In recent years, a versatile platform for markers detection has been developed based on DNA sensors, owing to their low cost and potential for high levels of multiplexing and sensitivity [Citation8]. This type of testing approach has been applied successfully to the analysis of a subset of antibiotic resistance [Citation9], but the feasibility of analysing resistance gene for anticoagulant drug in clinical samples has not been established. Here we explored the feasibility of applying this technology to analysis of the AR gene COX-2.
In this work, we develop a simple route to synthesise the long-spined sea urchin-like Pt (Pt-LSSUs) nanostructures in the presence of PAA hydrochloride with low average molecular weight (Mw = 15 000) at 80 °C. During the synthesis, the Pt-LSSUs nanostructures are functionalised simultaneously by PAA because of the strong Pt-N interaction. The as-prepared Pt nanostructures with long-spined sea urchin-like morphology (Pt-LSSUs) provide evidently the higher Pt utilisation than general Pt nanoflowers due to much higher branching degree [Citation10,Citation11]. PAA with low molecular weight firmly bound on the Pt surface and formed loose-packed PAA layers, which allowed the free permeation of electrolyte. As a result, the as-prepared Pt-LSSUs@PAA nanostructures show high branching and large surface. Pt-LSSUs@PAA, due to its high branching increased the surface roughness of electrode and exposed active sites, is a desirable material to anchor capture probe. 3D interconnected architecture of Pt-LSSUs@PAA nanostructures significantly enhances the electrochemical stability and excellent durability. In addition, the as-prepared Pt-LSSUs@PAA nanostructures possess the superior conductivity, generally resulting in the enhanced electrocatalytic activity. For the first time, the as-prepared 3D interconnected architecture of Pt-LSSUs@PAA nanostructures were used for the construction of nano-sensing interface.
An electrocatalytic DNA detection assay that reports DNA hybridisation and resolves single-base changes in the target sequence was developed. Electrocatalytic processes can be used to amplify signals produced at DNA modified electrode surfaces to increase the sensitivity and accuracy of a detection assay [Citation12–14]. To minimise the background current and increase the signal-to-noise ratio, a neutral charge aminated peptide nucleic acid (PNA) probe complementary to the target sequence was selected to modify the electrode surface [Citation15,Citation16]. In the procedure of assay, Ru(NH3)63+ acts as a redox label and binds to DNA nonspecifically through electrostatic interactions with the phosphate backbone, and therefore, the electrochemical reduction of this species yields a signal that reports on the increase of negatively charged groups at the electrode surface upon hybridisation of a target sequence [Citation17]. Fe(CN)63− is introduced to the assay as a secondary electron acceptor and chemically turns Ru2+ over to make the redox cycle electrocatalytic [Citation18,Citation19]. In recent years, although promising research has produced DNA sensors using electrocatalytic redox cycle reporter system to detect mutated nucleotides in samples [Citation20,Citation21], to the best of our knowledge, this is the first reported use of DNA sensors for the detection COX-2 rs20417, a biomarker implicated AR.
2. Experimental
2.1. Chemicals and materials
Potassium tetrachloroplatinate (II) (K2PtCl4), hydrazine hydrate (N2H4·H2O, 85%), sulfuric acid (H2SO4) were bought from Sinopharm Chemical Reagent Co., Ltd (Shanghai, China). Polyallylamine (PAA) hydrochloride (Scheme S1, Mw = 15,000), Tris-(2-carboxyethyl)-phosphine hydrochloride (TCEP), 6-mercaptohexanol (MCH), Ru(NH3)6Cl3, were obtained from Sigma-Aldrich (St. Louis, USA, www.Sigma-Aldrich.com). Potassium ferricyanide (K3Fe(CN)6) and potassium ferrocyanide (K4Fe(CN)6) were purchased from Beijing Chemical Reagents Company (Beijing, China). Clinical serum samples were obtained from a local hospital and stored at 4 °C. Aminated PNA probes (5′-NH2-Cys-O-GCA-TAT-AGA-GCA-GAT-ATA-CAG-CC-3′, where amino represents amino group, O represents an ethylene glycol linker and Cys represents the amino acid cysteine) and other oligonucleotides were synthesised and purified by Shanghai RuiDi Biological Technology Co., Ltd. with their sequences illustrated in .
Scheme 1. (A): The stepwise synthesise procedure of Pt-LSSUs@PAA. (B) Schematic illustration of the electrochemical DNA bioassay protocol.
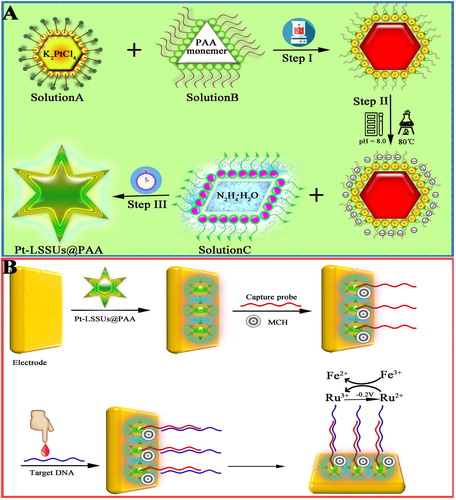
Table 1. Synthetic oligonucleotide sequences in this study.
The buffer solutions involved in this study were as follow: 1 × TE buffer (10 mM Trishydroxymethylaminomethane hydrochloride (Tris-HCl), and 1.0 mM ethylenediaminetetraacetic acid (EDTA), pH 8.0), which was used to dissolve all oligonucleotides. Phosphate buffered solution (PBS) (pH 7.4, 0.1 M) was prepared with NaH2PO4 and Na2HPO4. Tris buffer solution (10 mM, pH 7.5) was obtained from Sigma-Aldrich (St. Louis, USA, www.Sigma-Aldrich.com). All other reagents were of analytical reagent grade and used without further purification. Ultrapure water (> 18.2 MΩ) obtained from a Millipore Mill-Q purification system was used throughout the experiment.
2.2. Instruments
All electrochemical experiments were carried out on a CHI660E electrochemical workstation (Chenhua Instruments Co., Shanghai, China). Field emission scanning electron microscopy (FE-SEM) image was conducted using a Hitachi S4800 (Hitachi Limited, Japan). Transmission electron microscopy (TEM) investigations were performed on a Hitachi Limited, Japan). Energy dispersive X-ray (EDX) image was conducted using JEM-2100F. The morphologies of the materials were characterised using X-ray diffraction (XRD, Y-2000, Dandong Oron Ray Instrument co., Ltd, China). Fourier transform infrared (FT-IR) spectroscopy was performed with a Nicolet 6700 FT-IR spectrometer (Thermo Nicolet, USA, www.labx.com/product/thermo-nicolet-6700). A conventional three-electrode system was used for all electrochemical measurements: a Ag/AgCl reference electrode and a Pt counter electrode, and the modified glassy carbon electrode (GCE, 4-mm in diameter) as the working electrode. A one-compartment cell fitted with a Luggin capillary was used to separate the working compartment from the reference compartment.
2.3. Preparation of Pt-LSSUs@PAA nanostructures
PAA functionalised Pt nanostructures with long-spined sea urchin-like morphology (Pt-LSSUs@PAA) were synthesised according to the literature [Citation11]. Briefly, 2 mL of 0.025 M K2PtCl4 solution and 20 mg of PAA were added in 10 mL of water with 20 min of vigorous stirring (molar ration of K2PtCl4 to PAA monomer is 1:10). After adjusting solution pH to 8.0, the solution was heated to 80 °C. Then, 5 mL of N2H4・H2O was rapidly added into the mixture solution, and the resulting mixture solution was allowed to stand for 2 h at 80 °C. After reaction, the products were collected by centrifugation at 10,000 rpm for 10 min and further purified by water three times. After drying, the as-prepared Pt-LSSUs@PAA nanostructures were stored for further use.
2.4. Fabrication of the DNA sensor
The schematic diagram of the stepwise synthesise procedure of Pt-LSSUs@PAA and the fabrication procedure of the electrochemical DNA sensor is illustrated in Scheme 1. Prior to use, GCE was polished repeatedly using 0.3- and 0.05-μm alumina slurries followed by thorough rinsing with Milli-Q water. After successive sonication in baths of Milli-Q water, absolute alcohol and Milli-Q water again, the electrode was dried at room temperature. After that, 10 μL of Pt-LSSUs@PAA (1.1 ng mL−1) was cast onto the electrode surface and dried in the air. Then, an aqueous solution containing 1 μM of probe was mixed with 10 μM of aqueous Tris(2-carboxyethyl) phosphine hydrochloride solution and the mixture was left for overnight to cleave disulphide bonds. After that, 10 μL of probe solution was pipetted onto the sensors and incubated for 8 h in a dark humidity chamber at room temperature. The aminated PNA probe was immobilised on the electrode surface by the chemical bonding between Pt-LSSUs@PAA and available amine groups of PNA for hybridisation with target DNA. The sensors were then washed thrice for 3 min with 0.1 × PBS at room temperature. The sensors were then treated with 1 mM of 6-mercaptohexanol (MCH) for an hour at room temperature for back filling. After washing, the sensors were challenged with different concentration of targets for 60 min at room temperature. After hybridisation, the sensors were washed thrice for 3 min with 0.1 × PBS at room temperature and the electrochemical scans were acquired.
2.5. Electrochemical detection of COX-2 DNA
All electrochemical experiments were carried out using CHI660E electrochemical workstation with a three-electrode system featuring a Ag/AgCl reference electrode and a platinum wire auxiliary electrode in 10 mM Tris-HCl pH 7.5 and either 0 or 2 mM [Fe(CN)6]3−. Modified electrodes were incubated in 100 μM [Ru(NH3)6]3+ for 60 s and then rinsed in 10 mM Tris-HCl pH 7.5. Differential pulse voltammetry (DPV) signals were obtained with the potential range was from −0.6 to 0.3 V, pulse amplitude of 50 mV, pulse width of 50 ms, and a pulse period of 100 ms. Signal changes that correspond to specific targets were calculated with background-subtracted currents: change in current (△I) = Iafter − Ibefore, where Iafter = current after target binding and Ibefore = current before target binding.
3. Results and discussion
3.1. Principle of this method
We use a multi-pronged strategy to minimise the current in the absence of target nucleic acid. The sensors are functionalised with aminated PNA probes complementary to the target sequence. PNA is a synthetic nucleic acid analogue that has a neutral charge. This neutral charge minimises the background current and increases the signal-to-noise ratio. Our assay employs Ru(NH3)63+ and [Fe(CN)6]3−/4−. The Ru(NH3)63+ electron acceptor complex is positively charged and binds to the sensors at levels that corresponding to the amount of negatively charged nucleic acid. In a potential sweep, adsorbed Ru(NH3)63+ is reduced at −200 mV, producing a measurable current that reports on the presence of the target DNA. However, the limited concentration of Ru(NH3)63+ localised at the bound target nucleic acids yields a small current. [Fe(CN)6]3− is introduced into the system to chemically oxidise the reduced Ru2+, which creates multiple redox cycles for a single Ru(NH3)63+ molecule and thus amplifies the observed current.
3.2. Characteristics of the modified electrodes
The structural features of the products are examined by FE-SEM and TEM. As observed in , the highly branched and uniform Pt nanostructures with obvious radial symmetry and uniform Pt nanostructures, and each nanostructure is consisted of many long nanospines with a length of about 50 nm. The as-prepared Pt nanostructures with long-spined sea urchin-like morphology (Pt-LSSUs) provide evidently the higher Pt utilisation than general Pt nanodendrites due to much higher branching degree. The adsorption of PAA on Pt surface was further visualised by EDX mapping technique. To further monitor the formation of Pt-LSSUs@PAA, EDS characterisation was employed to analyse the detailed composition of Pt-LSSUs@PAA nanohybrid. As shown in , several intense peals of Pt and N were observed, suggesting that Pt-LSSUs@PAA has been synthesised. As shown in , the N element pattern is identical with Pt element pattern, indicating the uniform distribution of PAA on the surface of Pt-LSSUs nanostructures. The crystal structure of Pt-LSSUs@PAA nanostructures was investigated by XRD. The four characteristic diffraction peaks of (111), (200), (220) and (311) of Pt crystal are observed (Supplementary Figure S1A), demonstrating their face-centered cubic structure [Citation11,Citation22]. Compared to the standard value of Pt crystal, Pt-LSSUs@PAA nanostructures reveal a stronger (111) diffraction peak, demonstrating Pt-LSSUs@PAA nanostructures have abundant Pt (111) facets. Adsorptions of PAA on the Pt-LSSUs surface were verified by FT-IR. The FT-IR spectrum of the Pt-LSSUs@PAA is similar to that of pure PAA (Supplementary Figure S1B), confirming that the Pt-LSSUs@PAA are covered with PAA molecules [Citation23,Citation24].These results indicate the formation of crystalline Pt-LSSUs@PAA.
Figure 1. (A) Typical FE-SEM and (B) TEM images of Pt-LSSUs@PAA nanostructures. (C) EDS of Pt-LSSUs@PAA nanosturctures. (D) EDX elemental mapping of Pt-LSSUs@PAA nanosturctures.
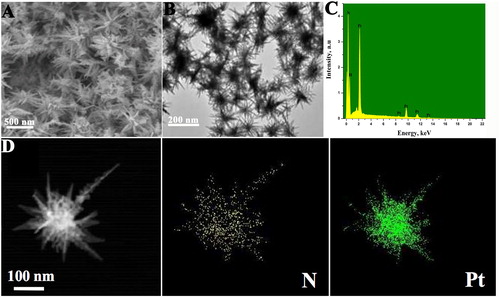
Figure 2. (A) CVs of (a) bare GCE, (b) GCE/Pt, and (c) GCE/Pt-LSSUs@PAA in 5 mM [Fe(CN)6]3−/4− containing a 0.1 M KCl solution. (B) Cyclic voltammograms of the modified electrode before (curve b) and after (curve c) hybridisation with target DNA in 5 mM [Fe(CN)6]3−/4− containing a 0.1 M KCl solution. (C) EIS for each immobilisation step in 5 mM [Fe(CN)6] 3−/4− containing a 0.1 M KCl solution: (a) bare GCE, (b) GCE/Pt-LSSUs@PAA, (c) GCE/Pt-LSSUs@PAA/PNA probe, (d) GCE/Pt-LSSUs@PAA/PNA probe/MCH (e) GCE/Pt-LSSUs@PAA/PNA probe/MCH/target DNA in 5 mM [Fe(CN)6]3−/4− containing a 0.1 M KCl solution.
![Figure 2. (A) CVs of (a) bare GCE, (b) GCE/Pt, and (c) GCE/Pt-LSSUs@PAA in 5 mM [Fe(CN)6]3−/4− containing a 0.1 M KCl solution. (B) Cyclic voltammograms of the modified electrode before (curve b) and after (curve c) hybridisation with target DNA in 5 mM [Fe(CN)6]3−/4− containing a 0.1 M KCl solution. (C) EIS for each immobilisation step in 5 mM [Fe(CN)6] 3−/4− containing a 0.1 M KCl solution: (a) bare GCE, (b) GCE/Pt-LSSUs@PAA, (c) GCE/Pt-LSSUs@PAA/PNA probe, (d) GCE/Pt-LSSUs@PAA/PNA probe/MCH (e) GCE/Pt-LSSUs@PAA/PNA probe/MCH/target DNA in 5 mM [Fe(CN)6]3−/4− containing a 0.1 M KCl solution.](/cms/asset/2f58c2f3-5c09-43d3-9ccb-612b012fa768/tjen_a_1559368_f0002_c.jpg)
3.3. Electrochemical behaviour of DNA sensors
It is clearly seen in that when the electrode was modified by Pt-LSSUs@PAA and compared with the glassy-carbon electrode (curve a) and the Pt modified electrode (curve b), there is a sharp increase in the peak currents (curve c), which could be attributed to the excellent electron transfer ability of Pt-LSSUs@PAA.
To verify the electrocatalytic current of the DNA sensor is dependent on the presence of target COX-2 DNA, we tested the modified sensors with and without target DNA. As shown in , the signal monitored at Pt-LSSUs@PAA/GCE modified with a probe sequence complementary to a portion of the target COX-2 gene significantly increases after exposure of the electrode to a synthetic target oligonucleotide (curve c). While, for the experiment in which target DNA was not introduced to the electrode (curve b), the voltammetric peak currents dropped to the background level (curve a), indicating that the current change is dependent on target COX-2 DNA.
EIS is one of the most powerful tools for probing the features of surface-modified electrodes. Therefore, to further illustrate that all of the fabrication steps were effective, the electrochemical behaviours were characterised by electrochemical impedance spectroscopy using a 5 mM [Fe(CN)6]3−/4− solution. It is well-known that the semicircle diameter in EIS is equal to the electron transfer resistance (Ret) and that the linear part of the curve at low frequency represents the diffusion process. As shown in , when Pt-LSSUs@PAA was modified onto the electrode, the resistance decreased (curve b) compared with the bare GCE (curve a), indicating that Pt-LSSUs@PAA accelerated the electron transfer of the electrode. Afterwards, a large semicircle diameter was observed when biotinylated PNA probe was dropped onto the electrode (curve c), implying that biotinylated PNA probe was successively immobilised onto the electrode. This larger diameter might be attributed to nonconductive DNA hindering the diffusion of electrons between the electrolyte and the electrode surface. After the electrode was blocked with MCH (curve d), the Ret increased dramatically due to the nonconductive property of MCH. Subsequently, with target DNA incubated onto the electrode, the resistance increased (curve e), indicating that the sensors had indeed been successfully fabricated.
3.4. Optimisation of experimental conditions
To ensure the high performance of the DNA sensor, several parameters involved in the experiments, such as the concentration of Pt-LSSUs@PAA, immobilisation time of PNA probe and incubation time were investigated. As shown in , the current response increased rapidly with increasing Pt-LSSUs@PAA concentrations from 0.2 mg mL−1 to 1.1 ng mL−1. A further increase in the concentration of Pt-LSSUs@PAA decreased the current change, possibly because the excessive amount of Pt-LSSUs@PAA decreased the surface area of the electrode and deterred electron transfer. Thus, 1.1 ng mL−1 of Pt-LSSUs@PAA was used for electrode modification.
Figure 3. Effects of (A) the concentration of Pt-LSSUs@PAA, (B) immobilisation time of PNA probe on the modified electrode and (C) incubation time.
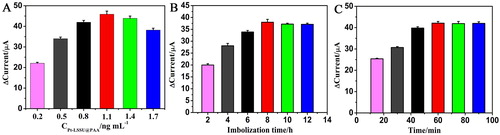
To evaluate the immobilisation time of PNA probe, we investigated the current responses by varying the immobilisation time of 100 pg mL−1 target DNA. As shown in , with the increase of immobilisation time, the current responses for the DNA sensor first increased quickly and then remained steady at approximately 8 h, indicating that the maximum immobilisation of DNA sensor was obtained. To completely hybridise the target DNA in the following step, 8 h was chosen as the optimal immobilisation time.
Moreover, to obtain an optimal electrochemical signal, the incubation time was investigated, as shown in . For the reason that it would take time to reach the maximum formation of the PNA/DNA complexes, the current responses increased with the increasing of incubation time. As the formation of PNA/DNA complexes getting saturated, the current responses start to level off after 60 min. Therefore, 60 min was chosen as the optimal incubation time.
3.5. Analytical performance of the DNA sensor
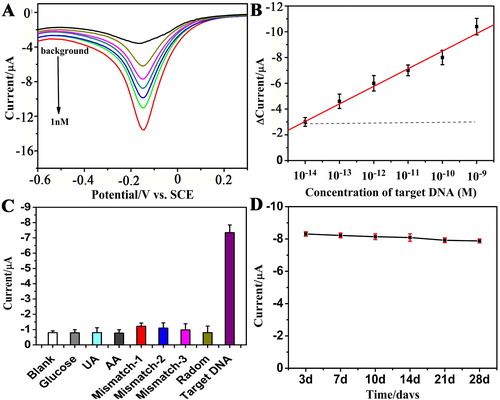
To evaluate the sensitivity and quantitative range of the DNA sensor under the optimal assay conditions, the performance of the DNA sensor was evaluated with different concentrations of target DNA. As indicated in Figure 4A, the DPV peak currents increased along with increasing concentrations of target DNA in the sample solution. The sample solution containing 3 mL of the 10-fold-diluted human serum sample was used for these experiments. For quantification, we measured the DPV peak currents variation △I(△I = Iafter − Ibefore, where Iafter = current after target binding and Ibefore = current before target COX-2 binding). The calibration plots showed a good linear relationship between the peak currents (ΔI) and logarithmic values of the analyte concentrations over the range of 10 fM to 1 nM, as shown in . The linear regression equation was ΔI (μA) =0.558 Lg C + 0.792 [COX-2] (M) (R2 = 0.99). The detection limit of the method was estimated to be 3.3 fM at a signal-to-noise ratio of 3σ (where σ is the standard deviation of the blank, n = 8), the lower detection limit is attributed to the highly branched Pt-LSSUs@PAA and the electrocatalytic redox cycling of Ru(NH3)63+/[Fe(CN)6]3−.
3.6. Specificity, reproducibility and stability of the DNA sensors
To investigate whether the DNA sensors could accurately interrogate a point-mutation, we challenged the DNA sensors with other oligonucleotides, such as single-base mismatch (mismatch-1, wild type), two-base mismatch (mismatch-2), three-base mismatch (mismatch-3), non-complementary target (random) and blank sample (a 10-fold-diluted healthy human serum sample). The responses of the DNA sensors were measured and are shown in . Athough hybridisation and washing were performed at elevated procedure, compared with the current response obtained from 100 pM COX-2, the responses caused by the mismatch sequences (1 nM for each one) were weak and negligible and were as low as the blank current. This indicated the high affinity of the DNA sensors to its complementary DNA target and that the developed DNA sensors could discriminate different DNA sequences effectively. The developed DNA sensor was used for the samples challenged with other related matrices, such as 50 nM glucose, 50 nM urea acid (UA) and 50 mM ascorbic acid (AA) (The concentrations of the above three interfering substances are far beyond those in normal serum.). A nearly negligible current change was obtained, which indicated that the developed biosensor could potentially be used in clinical application.
Figure 4. (A) DPV signals of the DNA sensors in the presence of different concentrations of COX-2 and (B) the calibration curve of the DNA sensors for 10 fM, 100 fM, 1 pM, 10 pM, 100 pM, 1 nM of COX-2 (n = 3). (C) Specific response of the DNA biosensor spiked with 50 nM glucose, 50 nM urea acid (UA), 50 nM ascorbic acid (AA), and after the biosensor was hybridised with complementary COX-2 (target DNA), single-base mismatch (Mismatch-1, wild type), two-base mismatch (mismatch-2), three-base mismatch (mismatch-3), non-complementary target (random) and blank sample (100 pM for each analyse). (D) The stability of the COX-2 DNA sensors (100 pM) after 3, 7, 10, 14, 21 and 28 days.
To assess the reproducibility of the DNA sensors, the fabricated electrodes were assessed by intra- and inter-assay relative standard derivations (RSDs), as shown in . The intra-assay precision of the developed DNA sensors was calculated by detecting three samples containing 0.01, 1 and 100 pM of COX-2. Each sample was measured five times using five DNA sensors prepared in parallel. For different concentrations of COX-2, the intra-assay RSD values were less than 3.45%. The inter-assay precision was estimated by measuring one sample with three DNA sensors that were independently formed at the same GCE, the RSD values were less than 4.01% for different concentrations of COX-2. These results indicate that the proposed DNA sensors possess acceptable precision and reproducibility.
Table 2. Reproducibility of the electrochemical detection of COX-2.
Table 3. Recovery of COX-2 in human serum samples.
To evaluate the stability of the DNA sensors, we investigated long-term storage. The DNA sensors were stored at 4 °C when it was not in use and measured periodically. As shown in , no obvious changes were observed during the first 3 days of storage, and the current changed by less than 1.4%. In addition, we found that the electrode remains 98.1% of its initial response to 100 pM targets for 7 days of storage and only loses 17.2% of its sensing ability after one month of storage. Thus, the proposed DNA sensors have satisfactory stability.
3.7. Analytical application of DNA sensors
To test the potential application of the DNA sensors for practical analysis, the DNA sensors were used to test the recovery of three concentrations of COX-2 in human serum samples, referencing the reported methods. Three concentrations (0.1, 1 and 100 pM) of COX-2-spiked human serum samples were prepared by the standard addition method. The plasma samples were diluted to suitable concentrations with pH 7.4 PBS (1:10). It can be observed from that the relative standard deviations were in the range of 2.202–3.678% and that the recoveries were in the range of 88.00–103.09%. These results show that the developed DNA sensors might be preliminarily applied to determine the presence of COX-2 in real samples.
3.8. COX-2 detection in serum samples
To further demonstrate the feasibility of the present DNA sensors for clinical application, the developed DNA sensors were incubated with 18 clinical serum samples at room temperature for 60 min. These above results were compared with those determined by sequencing. As shown in , ten serum specimens exhibited the negligible current responses (similar with or lower than that of blank and mismatch), implying no COX-2 mutant gene existed in these serum (negative results). Another eight groups of different serum specimens, the obviously increase in current responses were observed, indicating the existence of COX-2 mutant gene in these serum (positive results). In summary, the proposed DNA sensor method for COX-2 mutated gene detection was consistent with the standard method. The result indicated that the DNA sensor could effectively identify COX-2 mutated gene with high sensitivity and specificity.
Table 4. Assay results of COX-2 gene in real serum sample that using the DNA sensor and the standard method.
4. Conclusion
In this article, a novel and ultrasensitive electrochemical DNA sensor for the detection of COX-2 was prepared using electrocatalytic redox cycling. The proposed method has the following advantages: (1) This is the first report use of DNA sensors for the detection of COX-2 gene, a biomarker implicated AR; (2) The as-prepared 3D interconnected architecture of Pt-LSSUs@PAA nanostructures were used for the construction of nano-sensing interface for the first time; (3) This study will provide the basis for the precise use of aspirin, and it has important guiding value for individual drug testing of cardiovascular disease. Accordingly, this methodology could simplify and speed up the identification of drug-susceptible people, saving medical resources and reducing time to treatment. Although we have focused on the detection of COX-2 mutations for aspirin, the DNA sensor can be extended to other relevant mutations recurring in other types of medicine-related gene. So, the presence of multiple mutations may be interrogated simultaneously, allowing a more detailed and precision clinical administration.
Disclosure statement
No potential conflict of interest was reported by the author(s).
Additional information
Funding
References
- Ornelas A, Zacharias-Millward N, Menter DG, et al. Beyond COX-1: the effects of aspirin on platelet biology and potential mechanisms of chemoprevention. Cancer Metastasis Rev. 2017;36:289–303.
- Patrono C. Aspirin resistance: definition, mechanisms and clinical read-outs. J Thromb Haemost. 2003;1:1710–1713.
- Wang H, Sun X, Dong W, et al. Association of GPIa and COX‐2 gene polymorphism with aspirin resistance. J Clin Lab Anal. 2017;32:e22331.
- Yi X, Cheng W, Lin J, et al. Interaction between COX-1 and COX-2 variants associated with aspirin resistance in chinese stroke patients. J Stroke Cerebrovasc Dis. 2016;25:2136–2145.
- Song J, Jing Z, Hu W, et al. α-Linolenic acid inhibits receptor activator of NF-κB ligand induced (RANKL-Induced) Osteoclastogenesis and prevents inflammatory bone loss via downregulation of nuclear factor-KappaB-inducible nitric oxide synthases (NF-κB-iNOS) signaling pathways. Med Sci Monit. 2017;23:5056–5069.
- Xu B, Shanmugalingam R, Chau K, et al. The effect of acetyl salicylic acid (Aspirin) on trophoblast-endothelial interaction in vitro. J Reprod Immunol. 2017;124:54–61.
- Liu F, Melton JT, Bi Y. Mitochondrial genomes of the green macroalga Ulva pertusa (Ulvophyceae, Chlorophyta): novel insights into the evolution of mitogenomes in the Ulvophyceae. J Phycol. 2017;53:1010–1019.
- Hong N, Cheng L, Wei B, et al. An electrochemical DNA sensor without electrode pre-modification. Biosens Bioelectron.. 2017;91:110–114.
- Hu C, Kalsi S, Zeimpekis I, et al. Ultra-fast electronic detection of antimicrobial resistance genes using isothermal amplification and thin film transistor sensors. Biosens Bioelectron. 2017;96:281–287.
- Xia BY, Wu HB, Li N, et al. One-pot synthesis of Pt-Co alloy nanowire assemblies with tunable composition and enhanced electrocatalytic properties. Angew Chem Int Ed Engl. 2015;54:3797–3801.
- Xu GY, Wang B, Zhu JY, et al. Morphological and Interfacial Control of Platinum Nanostructures for Electrocatalytic Oxygen Reduction. ACS Catal. 2016;6:1–10.
- Liu L, Gao Y, Liu H, et al. Electrochemical-chemical-chemical redox cycling triggered by thiocholine and hydroquinone with ferrocenecarboxylic acid as the redox mediator. Electrochim Acta. 2014;139:323–330.
- Xia N, Zhang Y, Wei X, et al. An electrochemical microRNAs biosensor with the signal amplification of alkaline phosphatase and electrochemical-chemical-chemical redox cycling. Anal Chim Acta. 2015;878:95–101.
- Han GC. Electrochemical determination of protease with improving sensitivity by electrochemical-chemical-chemical redox cycling. Int J Electrochem Sci. 2016;11:8646–8653.
- Tee-Ngam P, Siangproh W, Tuantranont A, et al. Multiplex paper-based colorimetric DNA sensor using pyrrolidinyl peptide nucleic acid-induced AgNPs aggregation for detecting MERS-CoV, MTB, and HPV oligonucleotides. Anal Chem. 2017;89:5428–5434.
- Zhou YG, Wan Y, Sage AT, et al. Effect of microelectrode structure on electrocatalysis at nucleic acid-modified sensors. Langmuir 2014;30:14322–14328.
- Das J, Ivanov I, Montermini L, et al. An electrochemical clamp assay for direct, rapid analysis of circulating nucleic acids in serum. Nat Chem. 2015;7:569–575.
- Ngassa GB, Tonlé IK, Ngameni E. Square wave voltammetric detection by direct electroreduction of paranitrophenol (PNP) using an organosmectite film-modified glassy carbon electrode. Talanta 2016;147:547–555.
- Oja SM, Guerrette JP, David MR, et al. Fluorescence-enabled electrochemical microscopy with dihydroresorufin as a fluorogenic indicator. Anal Chem. 2014;86:6040–6048.
- Paleček E, Ostatná V, Černocká H, et al. Electrocatalytic monitoring of metal binding and mutation-induced conformational changes in p53 at picomole level. J Am Chem Soc. 2011;133:7190–7196.
- Du M, Yang T, Ma S, et al. Ionic liquid-functionalized graphene as modifier for electrochemical and electrocatalytic improvement: comparison of different carbon electrodes. Anal Chim Acta. 2011;690:169–174.
- Fu G, Wu K, Lin J, et al. One-pot water-based synthesis of Pt–Pd alloy nanoflowers and their superior electrocatalytic activity for the oxygen reduction reaction and remarkable methanol-tolerant ability in acid media. J Phys Chem C. 2013;117:9826–9834.
- Li F-M, Gao X-Q, Li S-N, et al. Thermal decomposition synthesis of functionalized PdPt alloy nanodendrites with high selectivity for oxygen reduction reaction. NPG Asia Mater. 2015;7:e219.
- Fu G, Jiang X, Gong M, Chen Y, Tang Y, Lin J, Lu T. Highly branched platinum nanolance assemblies by polyallylamine functionalization as superior active, stable, and alcohol-tolerant oxygen reduction electrocatalysts. Nanoscale. 2014;6:8226–8234.