
Abstract
Lateral flow immunoassay (LFIA) is the most widely used platform of the point-of-care (POC) detection. Since the most important factor in deciding the results of this technique is the visual quality of the test, it should be at its optimum. To address this issue, the present study examines optimising critical parameters to improve the quality of LFIA performance. In this regard the penicillin-binding protein 2a (PBP2a) in methicillin-resistant staphylococcus aureus (MRSA) was selected as a bacterial model. The targeted parameters included a) size of gold nanoparticles (AuNP), b) antibody conjugation conditions with AuNP, c) antibody concentrations in the capturing zones, d) the effects of blocking substances and different chemical buffers for pre-treatment of the strips. Visual quality of different manufactured strips revealed that the diameter of 14 ± 2, PH = 9.5 was the optimum for improvement of MRSA detection quality. The optimum concentration of labelling antibody in conjugate pad and concentration of the capturing antibody in the test band were 40 µg/ml and 1.1 µg/μl in PBS buffer (pH 7.4) respectively. In conclusion by finding the critical factors affecting the detection limit of lateral flow and optimising them, the visual quality of LFIA results can be increased.
1. Introduction
Infectious diseases have been a major threat in developing countries and early prognosis can reduce mortality and morbidity [Citation1]. Due to the importance of prevention and early detection of diseases, point-of-care (POC) diagnostic tool is the choice of interest to minimise detection and subsequently decision time for treatment [Citation2]. Lateral flow immunoassay (LFIA) technology is introduced as a strip-based biosensor and classified as the most widely used platform for the POC detection techniques [Citation3].
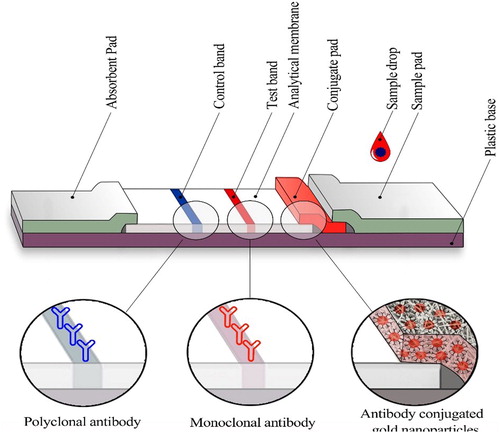
LFIA has wide applications in clinical diagnosis and screening of pathogen and it can be used on various types of fluids specimens such as urine [Citation4]. Its unique advantages, has made it suitable for use in low-resource settings, mainly in low income developing countries. No need for trained people and expensive equipment, portability, user friendly format, rapid prompt result, durable stability in a wide range of climatic conditions and requiring small sample volume are some of LFIA intrinsic properties [Citation5–8].The principle of LFIA technique is flow of the liquid sample through capillaries made from different polymeric pad along a strip. Finally, the appearance of analytic regions determines the properties of unknown sample, which is visual quality in the naked eye. Because of the importance of deciding on test results without the need for a specific device, this technique should be at its optimum [Citation9]. Lateral flow immunoassay strip consists of sample pad, conjugate pad, analytical membrane and absorbent pad adhered onto a plastic backing sheet [Citation6,Citation10]
Despite the widespread POC application of LFIA, the low level of sensitivity limits the application of this technique for various clinical purposes [Citation6]. Several strategies have been developed to enhance the sensitivity of LFIA and to improve performance quality of this technique. A few of these strategies are modification of shape and size in the AuNP, using different types of nanoparticles, exploiting the signal amplification method [Citation11–13], using novel approaches in sensing platforms like quantum dots, fluorescent carbon dots, liposomes, magnetic nanoparticles, selenium nanoparticles and phosphors nanoparticles [Citation3], application of two and three-dimensional paper networks [Citation6] and utilisation of Dual- AuNP conjugated pad layout [Citation14]. However, the majority of these efforts impose some limitations on the LFIA applications due to the need for high cost chemical reagents or external equipment with several timing stages, the instability of reagents, time-consuming procedures and complex interpretation [Citation15]. Therefore, finding optimal protocols to improve the sensitivity and specificity of this diagnostic method can help convert it from a simple tool to a powerful, reliable and nevertheless an inexpensive and accessible device.
The penicillin-binding protein 2a (PBP2a), encoded by the mecA gene, of methicillin-resistant staphylococcus aureus (MRSA) is a candidate target to distinguish MRSA [Citation16]. It is worth noting that MRSA infection is a concern due to high mortality and morbidity in the healthcare system [Citation17].In the present study, we developed a highly sensitive LFIA for detecting PBP2a in MRSA through optimisation of critical parameters including: size of AuNP, antibody conjugation conditions with AuNP, different chemical buffers for pre-treatment of the strips and blocking treatment of substances and antibody concentrations in the capturing zones. Through these advances, we have achieved a detection limit of 104cfu/ml resulting in 20-fold increase in the detection cut-off compared to conventional LFIA identifiable by the naked eye within 15-20 min.
2. Materials and methods
2.1. Materials and instruments
Bovine serum albumin (BSA), HAuCl4, sucrose, Tween 20, sodium citrate were obtained from Sigma-Aldrich (St. Louis, MO, USA). Trehalose, and phosphate buffered saline (PBS; pH7.4, 0.01 M) were obtained from Thermo Fisher Scientific (Waltham, MA, USA).Two different PBP2a monoclonal antibodies (clone 6G10 and clone 17C8) were purchased form Abnova (USA) and used as the conjugated and capturing antibodies, respectively. Goat anti-mouse IgG polyclonal antibody was obtained from BBI Solutions Co (UK). All components of lateral flow test paper, including a polyvinyl alcohol (PVA), backing pad, conjugate pad, absorbent pad and sample pad were purchased from Jiening Biotech Co., Ltd. (Shanghai, China). Nitrocellulose (NC) membrane was prepared from Millipore Co. (HFB13502S25; EMD Millipore, Billerica, MA, USA). A Nano Drop 2000 UV-Vis spectrophotometer (Termo Scientific; Waltham, MA, USA) was used to obtain spectra from AuNP and conjugates. Transmission electron microscopy (TEM; 2100 F 200 kV TEM, JEOL, Peabody, MA, USA) was used to analyse the size and shape of synthesised AuNP. Dynamic light scattering (DLS; Ltd., England) was used to analyse the size and polydispersity of the nanoparticle.
2.2. Synthesis of colloidal gold nanoparticles (AuNP)
AuNP(gold nanoparticles) with an average size of 14 ± 2 and 35 ± 3 nm were synthesised according to inversed Turkevich’ method [Citation18]. In brief, 25 ml de-ionized water was added into Erlenmeyer flask and heated to boiling point, then 11.5 µl of 0.01% (m/v) chloroauric acid (HAuCl4, 250 mg/ml, Sigma) was added to 25 ml of the boiling water with vigorous stirring and we allowed the solution to reach boiling point for 10 min. After 5 min, 650 µl of sodium citrate solution was added to the centre of flask at once, quickly and under constant stirring. 4% sodium citrate solution was used for 14 ± 2 nm AuNP preparation and 1% sodium citrate solution for 35 ± 3 nm AuNP preparation. Boiling was continued for 15 min; during this procedure, the solution colour changed from pale yellow to burgundy. Stirring was continued for an extra 15 min after removing the heat source. Finally, the prepared colloidal gold was stored at 4 °C in the dark for further study. The size and morphology of the AuNP were determined by transmission electron microscopy (TEM). The size and polydispersity of the nanoparticle were determined by Dynamic light scattering (DLS). λ max of the synthesised AuNP were measured at wavelengths ranging from 400 to 600 nm by ultraviolet–visible (UV/vis) spectrophotometry[Citation19].
2.3. Optimisation of parameters for preparation of colloidal gold –labelled monoclonal antibody (McAb)
Optimal pH of colloidal gold solution and minimum antibody level are crucial during conjugation of antibody with colloidal gold for stabilising Ab- AuNP conjugate. These two parameters can be determined by the salt-induced precipitation method [Citation20].
2.3.1. Optimising the pH value of colloidal gold for conjugation
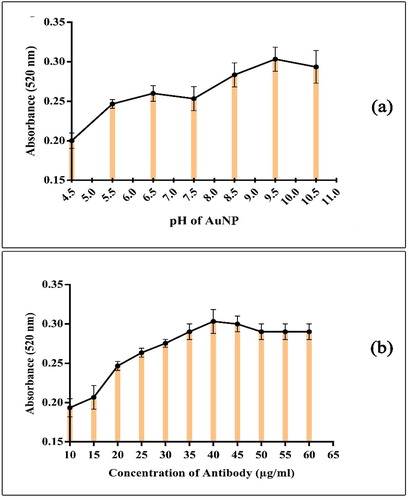
NAOH (0.1 M) was used to adjust the pH of colloidal gold solution to 9.5, briefly, 500 μl of colloidal gold solution was placed in the wells of a 96-well microplate, and different amounts of 0.1 M NAOH solution were added to adjust the pH of the colloidal gold from 4.5 to 10.5. Then, identical amounts of anti-PBP2a (6G10) McAb (5 μl) were added to give a final concentration of 40 μg/ml. The mixtures were incubated for 30 min at room temperature while stirring. Subsequently, 5 μl of 10% NaCl solution (w/v) was added to each well and mixed. After incubating for 20 min, the absorbance of each mixture was measured at 520 and 580 nm wave length by UV–vis spectrophotometer [Citation21]. The differential absorbance (A520nm-A580nm) was used to evaluate the stability and polydispersity constant of the AuNP/Ab complex.
2.3.2. Optimising the concentration of conjugating antibody
The pH value of the colloidal gold was adjusted as described above. 500 μl of colloidal gold were pipetted in the wells of a 96-well microplate. Afterward, different amounts of anti-PBP2a (6G10) McAb were added to give final concentrations of 10, 15, 20, 25, 30, 35, 40, 45, 50, 55 and 60 μg/ml in each well. The mixtures were slowly stirred and incubated for 30 min at room temperature. Finally, 5 μl of 10% NaCl solution was added to each of the wells and mixed. After incubating for 20 min, the absorbance of each mixture was measured at 520 nm and 580 nm wave length by UV–vis spectrophotometer
2.4. Preparation of colloidal gold-labelled monoclonal antibodies
Under optimal conditions the gold-antibody conjugate was prepared in three different protocols.
First protocol: 1 M NaOH was used to adjust the pH (equal to 8.5) of the colloidal gold solution (1%, w/v).Then, 40 ml pH-adjusted colloidal gold solution was mixed with Anti-PBP2a (6G10) McAb (3.3 μl; 5.5 mg/ml; in 5 mM potassium carbonate buffer; pH 8.5), with final concentration of 40 μg/ml. After 30 min of stirring, the mixture was centrifuged for 30 min (4 °C, 10,000 rpm). After centrifugation, the colloidal gold precipitant was resuspended in 20 mM Tris/HCl, pH 8.2 containing 1% BSA. The anti-PBP2a (6G10)-coated colloidal gold nanoparticles were stored at 4 °C [Citation7].
Second protocol: 0.1 M NaOH was used to adjust the pH (equal to 9) of the colloidal gold solution (1%, w/v). 900 μl pH-adjusted colloidal gold (450 μl in 450 μl borax buffer 2 mM, pH 9) was mixed with 100 μl Anti-PBP2a (6G10) McAb (4/5 μl in 95/5 μl borax buffer2mM, pH 9) for 10 min, then centrifuged at 10,000 rpm for 30 min in 4 °C and the colloidal gold pellets were re-suspended in 500 μl 2 mM borax buffer containing 1% (w/v) BSA and 0.05% (w/v) sodium azide[Citation22].
Third protocol: The pH value of the colloidal gold solution (1%, w/v) was adjusted to 9.5 with 0.1 M NaOH. Anti-PBP2a (6G10) McAb (3.3 μl; 40 μg/ml) was added to 450 ml pH-adjusted colloidal gold solution. The mixture was gently stirred for 30 min and to stabilise the McAb-gold conjugate thereafter, 10% BSA (50 μl) solution (with a final concentration of 0.1%) was added to the solution and incubated at room temperature with gentle stirring for 30 min. The mixture was centrifuged for 45 min (4 °C, 10,000 rpm). After centrifugation, the colloidal gold pellets were resuspended in 500 μl 2 mM borate buffer, pH 7.5 containing 1% (w/v) BSA, 4% sucrose, 6% trehalose and 0.05% (w/v) sodium azide. The final McAb-gold conjugate was stored at 4 °C.
2.5. The effects of different chemical buffers for pre-treatment of the strips
Pre-treatment of sample and conjugate pads are often necessary to ensure optimal release and stability. Four various buffers were used for the pre-treatment of the immune-strips and their efficacy were assessed. Buffers for pad pre-treatment were prepared as described.
A: BS (10 mM, pH: 7.4) containing: 6% trehalose, 1% (w/v) BSA, 4% sucrose, 0.05% sodium azide [Citation23].
B: 2 mM borate buffer, pH 7.5 containing: 1% (w/v) BSA, %0.5 tween20 and 0.05% (w/v) sodium azide [Citation22].
C: 50 mM borate buffer, pH 7.5 containing: 1% (w/v) BSA, 5% trehalose [Citation24].
D: 10 mM Tris/HCl, pH 7.4 containing: 1% (w/v) BSA, %0.5 tween20 and 1% (w/v) PEG20,000 [Citation25].
2.6. Preparation of membrane with immobilised antibody
2.6.1. The effects of blocking substances
To test the blocking effects, after fixing and drying the antibody on the surface of the NC membrane for 1 h at RT, 1% (w/v) low-melting-point polyvinyl alcohol (PVA) (in 20 mM Tris/HCl, pH 7.4) is used for 30 min at RT to block any remaining active area on the NC membrane. After washing with water and drying, the nitrocellulose membrane was immersed in 5% sucrose solution to allow free movement of the labelled agent. Then the membrane was dried. Another NC membrane but without sucrose immersion was considered as a comparing counterpart. Finally the results of the experiment were compared together.
2.6.2. Optimisation of antibody concentrations in the capturing zones
Various dilutions of monoclonal antibody (PBP2a, 17C8) were applied to optimise antibody concentration. Six serial dilutions of the antibody including 2.75(1:1), 1.8 (1:2), 1.4 (1:3), 1.1 (1:4), 0.9 (1:5) and 0.78 µg/µl (1:6) were prepared using PBS (1x) buffer and spotted on individual strips. Visual quality of each dilution was evaluated after testing and the best one was considered as the optimum condition.
2.7. Preparation of the immunochromatographic strip (ICS) assay
According to the schematic diagram of the ICS strip in (), each test strip consists of four separate parts including: sample pad, detector element on the conjugate pad, nitrocellulose membrane and absorbent pad. The nitrocellulose membrane was firstly pasted onto an adhesive backing card, the anti-PBP2a (6G10) McAb– AuNP conjugate pads were pasted on the Adhesive backing card with a 2 mm overlap with the bottom of the nitrocellulose membrane, sample pad with a 2 mm overlap with conjugate pads and absorbent pad with a 2 mm overlap with nitrocellulose membrane were mounted on a backing card. Anti-PBP2a (17C8) McAb and goat anti-mouse IgG antibody were applied to a strip of nitrocellulose membrane as a test and control bands, respectively. An optimised amount of anti-PBP2a (17C8) McAb (1.1 μg/μl in PBS buffer, pH 7.4) at a volume of 0.5 μl per dot and 1 μl (1 μg/μl in PBS buffer, pH 7.4) of goat anti-mouse IgG were used per strip. The assay was designed based on a double-antibody sandwich immunoassay format. One hundred microliters of PBS (negative control) and a methicillin-resistant Staphylococcus aureus isolate suspension (109 CFU/mL in PBS; positive control) were applied to the sample pad to evaluate preliminary LFI test functionality. 100 μl sample containing an appropriate number of MRSA isolate suspension were added to the sample pad drop wise, and the solution migrated with capillary action to the absorbent pad. The test signal was developed after 15-20 min. Positive results were identifiable by two red lines in the test and control zones, but a negative result was developed by the appearance of only a red line in the control zone. Test strip detection cut-off was assessed by adding 100 μl of MRSA isolate suspension in PBS (at concentration of 101–109 cfu/ml) on the sample pad. The results of gold standard detection method of MRSA served as controls to confirm validity of our LFIA.
Figure 1. The schematic of lateral flow strip.
3. Results and discussion
In the present study, the factors affecting the optimal performance of Lateral Flow Immunoassay (LFIA) diagnostic method were evaluated. In order to design this platform, Methicillin-resistant staphylococcus aureus (MRSA) was used as target microorganism which is one of the most important hospital and community pathogens, and early detection and prevention of diseases caused by this bacteria reduces the probability of death or severity of disease [Citation16].
LFIA rapid detection strips are widely used in medical diagnosis and compared to standard laboratory techniques such as PCR, which require specialised labour and expensive equipment and are time consuming, this technique is low cost, portable, simple and fast, no need for specialised staff, and with its specific advantages, it is highly efficient in the rapid detection of infectious diseases [Citation4].
In the development of LFIA technique, achieving optimal and satisfactory measurement process of the quality of the detection bands while maintaining its speed is the most important issues and it is necessary to develop an improved LFIA by investigating and optimising the parameters affecting the detection quality [Citation26]. Based on the experiences of researchers in previous studies, optimisation of four main parameters including: 1) size of gold nanoparticles (AuNP), 2) antibody conjugation conditions with AuNP 3) antibody concentrations in the capturing zones, 4) the effects of blocking substances and different chemical buffers for pre-treatment of the strips can play a decisive role in improving the quality of LFIA performance.
3.1. Characterisation of colloidal gold nanoparticles (AuNP) and effects of particle size
AuNP is the most popular label used in most LFIA tests because of their easy synthesis, high stability, easy manipulation of size and shape, and visual signal interpretation [Citation27,Citation28]. To investigate the effect of AuNP size on the LFIA sensitivity, two sizes of nanoparticle (14 ± 2 and 35 ± 3 nm) were synthesised by adjusting the amount of sodium citrate added to the gold solution.
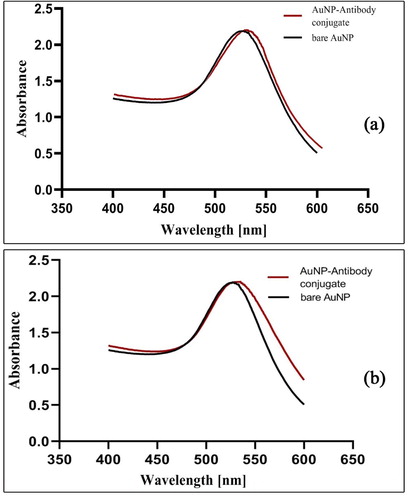
When the AuNP were synthesised, the colour of the solution converted from yellow of HAuCl4 to wine red of the nanoparticles. Howbeit by increasing the size of AuNP, the colour of the solution containing AuNP becomes darker. So that the 14 ± 2 nm nanoparticle was red and the 35 ± 3 nm nanoparticles were purple. The adsorption spectra of the colloidal gold nanoparticles were scanned using a UV-VIS spectrophotometer in the range of 400–600 nm. The maximum absorbance of 14 ± 2 and 35 ± 3 nm AuNP occurred at wavelength of 521 and 526 nm respectively (). The observed absorbance in these two regions indicates the successful synthesis of AuNP.
Figure 2. Characterisation of gold nanoparticles after synthesis. a) UV-Vis spectra of bare AuNP and antibody conjugated AuNP (14 ± 2 nm AuNP), b) UV-Vis spectra of bare AuNP and antibody conjugated AuNP (35 ± 3 nm AuNP).
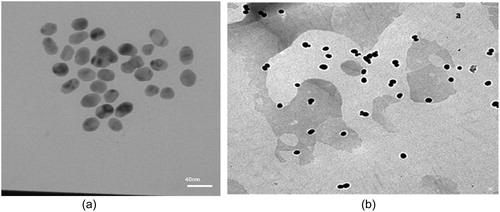
The average size of the AuNP were determined by Dynamic Light Scattering (DLS). The results of measuring these two AuNP are shown in . TEM analysis of the particles confirms the presence of uniform and spherical shaped nanoparticles ().
Figure 3. Dynamic light scattering spectrum of bare AuNP and AuNP -Antibody, a) DLS spectrum of bare AuNP and antibody conjugated AuNP (14 ± 2 nm AuNP), b) DLS spectrum of bare AuNP and antibody conjugated AuNP (35 ± 3 nm AuNP).
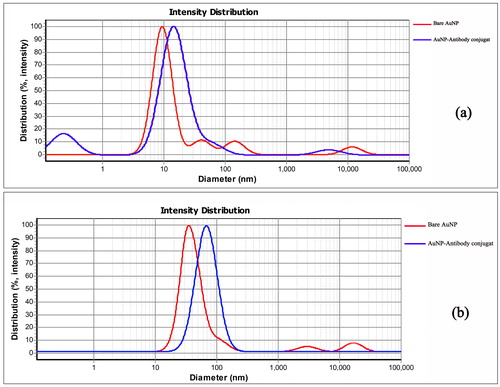
Figure 4. TEM images of naked AuNP with different sizes, A) 35 ± 3 nm B) 14 ± 2 nm.
In our study, there were no significant differences between the quality of test strip results in two nanoparticles sizes (14 ± 2 and 35 ± 3 nm), but the LFIA with 14 ± 2 nm AuNP showed greater signal in PBP2a detection compared to that with 35 ± 3 nm AuNP, it also had the best performance and was stable during sample preparation. Therefore, this size, although not consistent with other reports, was finally chosen as the optimum diameter for LFIA. The reason for this inconsistency is that the larger particles move at a slower rate along the strip, which increases the duration of the test result [Citation29]. It is also due to the different quality of antibodies used in this test that have different structural properties. In addition, larger-size nanoparticles require a higher concentration of antibody to be stable, however, using a high concentration of antibodies will make the reddish AuNP become brighter, thereby reducing the signal intensity LFIA [Citation30]. The reports in the literature show that the larger size of AuNP may have a higher sensitivity than the smaller AuNP [Citation10,Citation15,Citation20,Citation24,Citation31–33]. Most research selected the AuNP with a 20-40 nm diameter for LFIA [Citation5,Citation32]. Based on the reports, larger-size nanoparticles are easily seen but less stable [Citation15,Citation33]. An important factor for nanoparticles as labels is their colloidal stability in solution. A stable suspension ensures a uniform distribution of the conjugate solution during the preparation of the conjugate pad [Citation29,Citation34–37].
3.2. Optimisation conditions for AuNP-Monoclonal antibody (McAb) conjugation and characterisation
During the preparation of the McAb- AuNP conjugate, three different protocols were used and the best results were obtained from the third protocol (mentioned in the materials and methods section) as the optimal condition. To further stabilise the conjugate after binding of the antibody to the colloidal gold, the residues were blocked with BSA, thereby non-specific junctions and unbound antibodies that inhibited proper interaction between the conjugate and the analyte are eliminated. The result of the study is consistent with the research conducted by se Hwan et al. in the field of optimisation of effective parameters on the detection of salmonella bacteria [Citation10,Citation38]. McAb-AuNP conjugates were characterised by UV–vis spectroscopy and DLS measurement. As the DLS results, after the AuNP were conjugated with the antibodies (14 ± 2 and 35 ± 3 nm), the average size of the nanoparticles changed to 15.22 and 72 nm, respectively. This increase in size was due to the coating of antibodies surrounding the gold nanoparticles (). UV–vis spectra of McAb- AuNP (14 ± 2 and 35 ± 3 nm) exhibited maximum absorbance at a wavelength of 525 and 535 nm respectively, and there was a slight red-shift in the maximum absorbance spectrum between the McAb- AuNP conjugate and AuNP (). The consistency of UV–vis spectroscopy results during total time of study confirmed the stability of conjugates.
In the process of conjugate preparation, the pH of the colloidal gold nanoparticles and the amount of antibody play an important role [Citation5]. The optimum pH for conjugation is the isoelectric pH because below this point, the positively charged antibody reacts to the negatively charged nanoparticle and the nanoparticle accumulates, affecting the quality of the conjugate release and above the isoelectric point, the negatively charged protein repels the nanoparticles and conjugation does not occur [Citation38,Citation39]. Therefore, a salt-induced deposition method was used to determine the optimum pH of AuNP and the appropriate amount of antibodies for the preparation of a stable McAb-AuNP conjugate. [Citation24]. Mixtures were prepared at different pH and antibody concentrations. It was revealed that the pH 9.5 and the McAb 6G10 concentration of 40 μg/ml are the most optimised values. AuNP remained stable after binding with antibody during the total time of study. No aggregation of AuNP was observed in antibody concentration equal to 40 μg/ml based on the recorded wavelength of 521 nm, Also, the minimal concentration of antibody for stabilising the AuNP was observed in a micro-tube that does not change colour ().To optimise pH and antibody levels for stable McAb-AuNP conjugates, various tests such as titration test and flocculation test have been performed in the literature, which is consistent with our findings [Citation5,Citation10,Citation15,Citation20,Citation24,Citation39]. The results of all these tests showed, when the gold pH is at the isoelectric point, the antibody is absorbed to the gold surface through the ionic and hydrophobic reactions and by adding a high level of salt, agglomeration does not occur. With the increase of pH, the charge around the nanoparticles will be more negative and the AuNP tolerance to salt will increase. As a result, antibodies cannot bind well to the nanoparticles and cause the deposition of nanoparticles at the conjugate formation stage and the resulting conjugate will not be stable.
Figure 5. Optimal pH value and Ab concentration for coating AuNP.
The next factor to consider in these protocols was the use of different running buffers and their impact which was evaluated. The third protocol buffer included: 2 mM borate buffer, pH 7.5 containing 1% (w/v) BSA, 4% sucrose, 6% trehalose and 0.05% (w/v) sodium azide. Sucrose and trehalose have an influence on the flow rate of McAb- AuNP conjugate, and subsequently, the intensity of the test line. Our results are consistent with other reports [Citation15,Citation40].
3.3. Selection of chemical buffer for pre-treatment of the strips
Pre-treatment of sample and conjugate pads is often necessary to ensure optimal release and stability and affect the quality and rapid release of the conjugate from the conjugate pad [Citation15,Citation41].
Four various buffers were used for the pre-treatment of the strip manufacturing and their efficacy was assessed. In accordance with the final strip function, the third protocol mentioned in the method, was opted as the best buffer with the best performance. The image of the strip pre-treated with the best buffers is shown in . However, the results of the first protocol strip test also showed a good signal intensity on the test line. It seems that this was due to the use of sucrose and trehalose in both protocols, which have a protective effect of conjugated antibody activity and increasing the duration of kit use. The role of these two sugars has been reported in the literature [Citation15,Citation41].
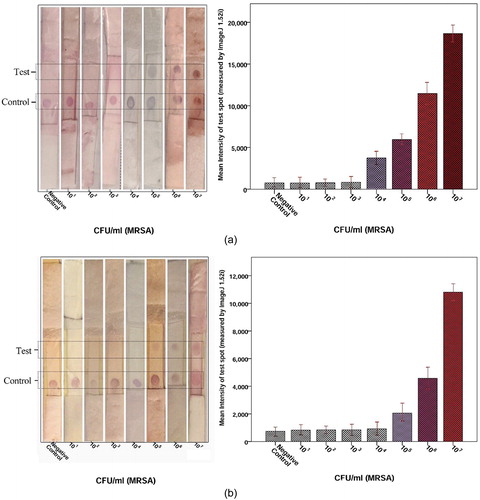
Figure 6. Determination of the detection limit of LFIA strips (A) AuNP (14 ± 2 nm AuNP), (B) AuNP (35 ± 3 nm AuNP). Image analysis of the LFIA strip showed that the first significant signal at MRSA concentrations was 104 cfu/ml for 14 ± 2 nm AuNP and 105 cfu/ml for 35 ± 3 nm AuNP. In this LFIA technique, two red band in the test and control regions indicates a positive result. But a red band in the control region indicate a negative result.
3.4. Effect of blocking substances and antibody concentrations in the capturing zones
We used 1% (w/v) low-melting-point polyvinyl alcohol (PVA) (in 20 mM Tris/HCl, pH 7.4) as blocking buffer. After drying, one NC membrane with immersion sucrose and another without sucrose were used. The blocked membrane causes slow flow of both sample and conjugate solution (1 cm/min).
The concentration of capturing antibody in the test line is a further factor affecting LFIA sensitivity. Between six serial dilutions of Anti-PBP2a (17C8) McAb as the capture antibody (2.75(1:1), 1.8 (1:2), 1.4 (1:3), 1.1 (1:4), 0.9 (1:5) and 0.78 µg/µl (1:6), the concentration of 1.1 (1:4), µg/µl was considered as the optimum Ab concentration on the test. As the concentration of capturing antibody increased, the signal intensity of the test line increased until it was at the highest concentration of 1.1 µg/µl but decreased thereafter. These results were consistent with other studies [Citation27].
3.5. Characterisation of the detection cut-off of LFIA
Different concentrations (101-109 cfu/ml in PBS) of MRSA isolate suspension were applied to the sample pad to evaluate detection cut-off of LFIA test. Test signals were completed within 15-20min. The positive sample had two red lines in test and control zones, but a negative result developed with the appearance of only a red line in the control zone. Detection limit of MRSA was found to be 104 cfu/ml (). This detection limit was acceptable compared with the results of gold standard detection of MRSA.
4. Conclusion
In this study, we developed a simple and highly visual quality LFIA for rapid detection of PBP2a. Our result revealed that optimisation of critical parameter including, size of AuNP, antibody conjugation conditions with AuNP, antibody concentrations in the capturing zones, blocking substances and chemical buffers for pre-treatment of the strips can play a vital role in final visual quality of LFIA test.
Disclosure statement
The authors declare that they have no conflicts of interest.
Additional information
Funding
References
- Bloom DE, Cadarette D. Infectious disease threats in the twenty-first century: strengthening the global response. Front Immunol. 2019;10:549
- Katis IN, He PJ, Eason RW, et al. Improved sensitivity and limit-of-detection of lateral flow devices using spatial constrictions of the flow-path. Biosens Bioelectron. 2018;113:95–100.
- Borse V, Srivastava R. Process parameter optimization for lateral flow immunosensing. Mater Sci Energy Technol. 2019;2(3):434–441.
- Banerjee R, Jaiswal A. Recent advances in nanoparticle-based lateral flow immunoassay as a point-of-care diagnostic tool for infectious agents and diseases. Analyst. 2018;143(9):1970–1996.
- Fan D, Li Y, Gu Z, et al. Colloidal gold probe-based immunochromatographic strip assay for the rapid detection of microbial transglutaminase in frozen surimi. J Chem. 2016;2016:1–7.
- Fu E, Liang T, Houghtaling J, et al. Enhanced sensitivity of lateral flow tests using a two-dimensional paper network format. Anal Chem. 2011;83(20):7941–7946.
- Rong-Hwa S, Shiao-Shek T, Der-Jiang C, et al. Gold nanoparticle-based lateral flow assay for detection of staphylococcal enterotoxin B. Food Chem. 2010;118(2):462–466.
- Gong Y, Zheng Y, Jin B, et al. A portable and universal upconversion nanoparticle-based lateral flow assay platform for point-of-care testing. Talanta. 2019;201:126–133.
- Asiaei S, Bidgoli MR, ZadehKafi A, et al. Sensitivity and colour intensity enhancement in lateral flow immunoassay tests by adjustment of test line position. Clin Chim Acta. 2018;487:210–215.
- Cam D, Öktem HA. Optimizations needed for lateral flow assay for rapid detection of pathogenic E. coli. Turk. J. Biol. 2017;41(6):954–968.
- Tripathi P, Upadhyay N, Nara S. Recent advancements in lateral flow immunoassays: A journey for toxin detection in food. Crit Rev Food Sci Nutr. 2018;58(10):1715–1734.
- Anfossi L, Di Nardo F, Giovannoli C, et al. Increased sensitivity of lateral flow immunoassay for ochratoxin A through silver enhancement. Anal Bioanal Chem. 2013;405(30):9859–9867.
- You M, Lin M, Gong Y, et al. Household fluorescent lateral flow strip platform for sensitive and quantitative prognosis of heart failure using dual-color upconversion nanoparticles. ACS Nano. 2017;11(6):6261–6270.
- Tsai T-T, Huang T-H, Chen C-A, et al. Development a stacking pad design for enhancing the sensitivity of lateral flow immunoassay. Sci Rep. 2018;8(1):17319
- Gong Y, Hu J, Choi JR, et al. Improved LFIAs for highly sensitive detection of BNP at point-of-care. Int J Nanomedicine. 2017;12:4455–4466.
- Sadeghi Y, Salami SA, Kananizadeh P, et al. Real-time PCR followed by high-resolution melting analysis - a new robust approach to evaluate SCCmec typing of methicillin-resistant Staphylococcus aureus . Future Microbiol. 2019;14:155–164.
- Pourramezan N, Moghadam SO, Pourmand MR. Methicillin-resistant Staphylococcus aureus tracking spread among health-care workers and hospitalized patients in critical wards at a university hospital, Tehran, Iran. New Microbes New Infect. 2019;27:29–35.
- Faridi Majidi R, Negahdari B, Tavoosidana G. Reversed Turkevich’method for tuning the size of Gold nanoparticles: evaluation the effect of concentration and temperature. Nanomedicine Research Journal. 2019;3:190–196.
- Wang R, Kim K, Choi N, et al. Highly sensitive detection of high-risk bacterial pathogens using SERS-based lateral flow assay strips. Sens Actuators, B. 2018;270:72–79.
- Chen Y, Chen Q, Han M, et al. Development and optimization of a multiplex lateral flow immunoassay for the simultaneous determination of three mycotoxins in corn, rice and peanut. Food Chem. 2016;213:478–484.
- Dias JA. Immune and Receptor Assays in Theory and Practice. Patrick Englebienne. Boca Raton, FL: CRC Press, 2000, 392 pp., $95.95. ISBN 0-8493-0061-4. Clinical Chemistry. 2001;47(12):2187–2188.
- Wiriyachaiporn S, Howarth PH, Bruce KD, et al. Evaluation of a rapid lateral flow immunoassay for Staphylococcus aureus detection in respiratory samples. Diagn Microbiol Infect Dis. 2013;75(1):28–36.
- Wang Y-K, Yan Y-X, Ji W-H, et al. Rapid simultaneous quantification of zearalenone and fumonisin B1 in corn and wheat by lateral flow dual immunoassay. J Agric Food Chem. 2013;61(21):5031–5036.
- Cheng H, Yang Y, Chen Y, et al. Novel monoclonal antibody-based immunochromatographic strip for detecting citrinin in fruit from Zhejiang province, China. PloS One. 2018;13(5):e0197179
- Zhang Y, Xiao W, Kong H, et al. A highly sensitive immunochromatographic strip test for rapid and quantitative detection of Saikosaponin D. Molecules. 2018;23(2):338.
- Tang R, Yang H, Gong Y, et al. Improved analytical sensitivity of lateral flow assay using sponge for HBV nucleic acid detection. Sci Rep. 2017;7(1):1360
- Pan R, Jiang Y, Sun L, et al. Gold nanoparticle-based enhanced lateral flow immunoassay for detection of Cronobacter sakazakii in powdered infant formula. J Dairy Sci. 2018;101(5):3835–3843.
- Serebrennikova K, Samsonova J, Osipov A. Hierarchical nanogold labels to improve the sensitivity of lateral flow immunoassay. Nanomicro Lett. 2018;10(2):24
- Kim D, Kim Y, Hong S, et al. Development of lateral flow assay based on size-controlled gold nanoparticles for detection of hepatitis B surface antigen. Sensors. 2016;16(12):2154.
- Ríos-Corripio M, Garcia-Perez BE, Jaramillo-Flores ME, et al. UV–Visible intensity ratio (aggregates/single particles) as a measure to obtain stability of gold nanoparticles conjugated with protein A. J Nanopart Res. 2013;15(5):1624.
- Jin Y, Liu R, Zhu L, et al. A novel colloidal gold labeled antigen for the detection of Deoxynivalenol using an immunochromatographic assay method. 2017;94(1):012010.
- Razo S, Panferova N, Panferov V, et al. Enlargement of gold nanoparticles for sensitive immunochromatographic diagnostics of potato brown rot. Sensors. 2019;19(1):153.
- Wang J, Zhou J, Chen Y, et al. Rapid one-step enzyme immunoassay and lateral flow immunochromatographic assay for colistin in animal feed and food. J Animal Sci Biotechnol. 2019;10(1):1–10.
- Zhan L, Guo S-z, Song F, et al. The role of nanoparticle design in determining analytical performance of lateral flow immunoassays. Nano Lett. 2017;17(12):7207–7212.
- Khlebtsov BN, Tumskiy RS, Burov AM, et al. Quantifying the numbers of gold nanoparticles in the test zone of lateral flow immunoassay strips. ACS Appl Nano Mater. 2019;2(8):5020–5028.
- Kamel M, Salah F, Demerdash Z, et al. Development of new lateral-flow immunochromatographic strip using colloidal gold and mesoporous silica nanoparticles for rapid diagnosis of active schistosomiasis. Asian Pac J Trop Biomed. 2019;9(8):315.
- Posthuma-Trumpie GA, Korf J, van Amerongen A. Lateral flow (immuno)assay: its strengths, weaknesses, opportunities and threats. A literature survey. Anal Bioanal Chem. 2009;393(2):569–582.
- Paek S-H, Lee C-W, Yook S-H, et al. Performance control strategies of one-step immuno-chromatographic assay system for Salmonella typhimurium. 1999;32(2):335–360.
- Lata K, Sharma R, Naik L, et al. Lateral flow assay–based rapid detection of cephalexin in milk. J Food Qual. 2016;39(1):64–73.
- Li Y, Liu L, Song S, et al. A rapid and semi-quantitative gold nanoparticles based strip sensor for polymyxin B sulfate residues. Nanomaterials. 2018;8(3):144.
- Millipore E. Rapid lateral flow test strips: Considerations for product development.Billerica, MA, USA: EMD Millipore Corporation; 2013.