
Abstract
A novel, sensitive, economical, and environmentally friendly method is described for the quantitative determination of diphenhydramine hydrochloride (DPH). The method is based on the preparation of silver nanoparticles (AgNPs) from the extract of Capparis spinosa L. (CPL) fruits to determine DPH as one of the antihistamine drugs. The colour intensity of the solution increases with increasing DPH concentrations due to the interaction of AgNPs with DPH. FTIR, X-ray, EDX, SEM, and UV-Vis techniques characterised the prepared nanoparticles. The current method presented a linear relationship over the concentration range of 2–45 µg/mL at a wavelength of 415 nm. The detection limit (LOD) and quantitation limit(LOQ) are studied, and the values are 0.36 and 1.19 µg/mL, respectively. The recovery percentage (accuracy function) is more than 99.5%, and the relative standard deviation (RSD%, as a precision function) was 0.73%. The molar absorptivity and Sandel’s sensitivity index are 5.14 × 10³ L.mol−1.cm−1 and 0.057 µg.cm−2, respectively. The data were compared to those from other previous approaches using t-test and F-test with a 95% confidence level and found to be 2.107 and 3.18, respectively. According to the ICH guidelines (2005), the proposed method has been validated and provides promising results for determination of DPH in pure form and pharmaceutical preparations.
1. Introduction
Diphenhydramine(DPH) is a first-generation antihistamine with anticholinergic, antitussive, antiemetic, and sedative properties and is primarily used to treat allergies. DPH blocks the binding of histamine to the H1 receptor, reducing symptoms. It reduces histamine-related vasodilation and increases capillary permeability. After oral administration, it is readily absorbed and dispersed significantly throughout the body, including the central nervous system. It is primarily eliminated in the urine as metabolites after being metabolised in the liver [Citation1, Citation2].
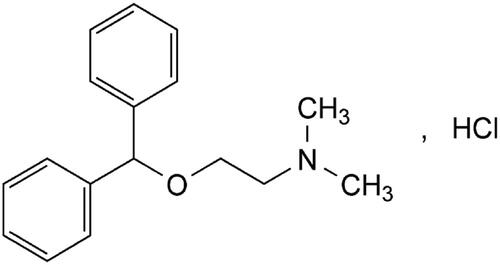
DPH is chemically known as 2-(Diphenylmethoxy)-N,N-dimethylethanamine hydrochloride (). It is white or almost white, crystalline powder, very soluble in water, and freely soluble in alcohol [Citation3].
Figure 1. Chemical structure of diphenhydramine HCl (mwt: 291.82 g/mol).
Different few approaches have been reported for determination of DPH, such as HPLC [Citation4,Citation5], GC [Citation6,Citation7], LC/MS [Citation8] electrochemical methods [Citation9, Citation10], flow injection analysis [Citation11, Citation12], capillary zone electrophoresis [Citation13] and spectroscopic methods, including spectrophotometry [Citation14, Citation15] and spectrofluorimetry [Citation16, Citation17].
Nanotechnology has developed rapidly in recent years, bringing countless benefits to almost every aspect of our lives. Medical applications [Citation18], pharmaceutical analysis [Citation19], catalysis [Citation20], cancer biomarkers [Citation21] and cell imaging [Citation22] are a few of them. Additionally, environmentally friendly green-synthesised nanoparticles of less hazardous elements are rapidly expanding to eliminate toxic reagents and minimise the use of chemical reagents and analytical tools [Citation23–25].
Due to the importance of the DPH, the suggested approach aimed to prepare silver nanoparticles from the extract of Capparis Spinosa L.(CPL) fruits since the literature indicates that there are very few studies, especially on the fruits of the plant [Citation26–28]. These nanoparticles are employed for spectrophotometric determination of DPH because of their ease, low economic cost, environmentally safe method, and fewer solvents and devices.
2. Experimental
2.1. Instrumentation
A spectrophotometer 1800-Shimadzu was used to measure the UV-vis spectrum of the nanocomposite (Shimadzu Ltd, Tokyo, Japan). The size and form of the Ag nanocomposite were measured using a scanning electron microscope (SEM) (Mira3 model, Czech) with 15 kV, magnification of x10. EDX was also used (EDX-1800 Shimadzu Ltd, Japan). D-5000 diffractometer (Siemens, Germany) was used to acquire the X-ray powder diffraction (XRD) pattern. FT-IR 8400S spectrophotometer was used to analyse the Fourier transform infrared (FTIR) spectra (Shimadzu Ltd, Tokyo, Japan).
2.2. Reagents and chemicals
Samarra Drug Industry (SDI), an Iraqi company, provided pure-grade DPH. A nearby local pharmacy provided PECTOMEX® 7.5 mg/5 mL (Razi Pharmaceutical Industries, Syria), Panadol Night® 25 mg/tablet (GSK, U.K.), and ALLERMINE® 25 mg/tablet (Samarra Drugs Industry (SDI), Iraq). Purchases of sodium hydroxide, hydrochloric acid, and AgNO3 were made at Sigma-Aldrich (Hamburg, Germany), while buffer acetate was purchased from Fisher Scientific. Analytical-grade reagents were used throughout.
2.3. Green synthesis of AgNPs
2.3.1. Cpl Fruit collection
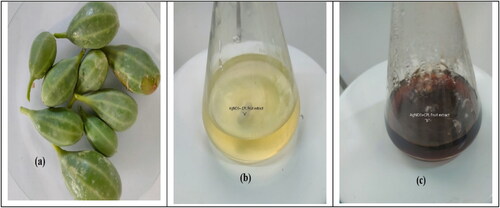
CPL fruits were collected from the Capparis Spinosa L. trees from the desert of Tikrit city, Salah al-Din Governorate, Iraq, in August 2022. The laboratories of the College of Science at Tikrit University, Tikrit, Iraq, identified them. The fruits were washed with distilled water and used freshly ().
Figure 2. (a) Capparis spinosa fruit. (b & c) Colour change in the solution after the addition of CPL fruit extract.
2.3.2. Preparing of fruit extract
In a 250 mL flask, 80 mL of deionised water was added to 8 grams of CPL fruit, which was then heated for 2–5 min. The substance was filtered via Whatman filter paper after cooling. The filtrate was collected and kept at four °C for further usage in an Erlenmeyer flask of 250 ml [Citation29].
2.3.3. Preparing of AgNPs
The concentration of 1 μM AgNO3 was prepared by dissolving 0.017 gm in the deionised water in the volumetric flask of 100 mL. A typical reaction process involved adding 40 mL of CPL fruit extract to 40 mL of AgNO3 solution under shaking. A reasonable period was devoted to heating the resultant combination in a water bath at 70 ± 5 °C. AgNPs were synthesised as indicated by the combination of "AgNO3-CPL" appearing brown. The AgNPs’ creation is confirmed by the UV-Vis spectrophotometer’s 400–450 nm peak [Citation30,Citation31] ().
2.4. Preparation of standard DPH solution
A standard solution of 100 μg/mL DPH was prepared by dissolving 10 mg of DPH into 100 mL deionised water. Working solutions in the range of 2–45 μg/mL were achieved by serial dilutions using deionised water.
2.5. Preparation of DPH tablets and syrups solutions
Not less than 20 DPH® tablets were finely powdered and dissolved in deionised water in an exact amount equivalent to 100 μg/mL (25 mg/tablet for each Panadol Night® and ALLERMINE®). The solution was filtered, and serial dilutions were prepared using the same solvent. While the syrup solution was prepared by diluting 6.7 mL of PECTOMEX® (each 5 mL of syrup container equivalent to 7.5 mg of diphenhydramine hydrochloride, so 6.7 mL of syrup equivalent to 10 mg of DPH) in a volumetric flask of 100 mL and the volume was completed with deionised water to produce a 100 μg/mL solution.
2.6. General procedure of method detection
The principle of the proposed approach is based on the formation of stable AgNPs after the reduction of Ag+ to Ag0 by CPL fruit extract. Pure DPH samples with quantities between 2 to 45 μg/mL were investigated. The absorbance intensities were plotted against the investigated DPH concentrations under optimal conditions. The linear regression equation was derived after the calibration curve was displayed.
3. Results and discussion
3.1. Characterisation of AgNPs
3.1.1. UV-Vis spectrophotometry
The biosynthesis of Ag nanoparticles using Capparis spinosa extract could be confirmed by the colour variation from light yellow to dark brown. The absorption spectrum of silver nanoparticles showed a distinct peak at 415 nm (). The solution’s colour changed from pale yellow to dark brown, indicating the reduction conformation of Ag+ to Ag0. Dark brown colour production at high CPL fruit extract concentrations demonstrated the reduction process. In contrast, variations in brown colour suggest an incomplete reduction at lower concentrations in the CPL fruit extract solution. AgNPs showed the surface plasmon resonance (SPR) band in the presence of light photons due to a combined oscillation of the metal’s conduction and free band electrons. The type of nanoparticles, composition, shape and synthesis matrix are the critical determinants of the SPR band’s intensity.
Figure 3. Characterisation of AgNPs: (A) Visible Spectrum of AgNPs, (B) EDX pattern of AgNPs, (C) FT-IR of AgNPs, and (D) XRD pattern of AgNPs.
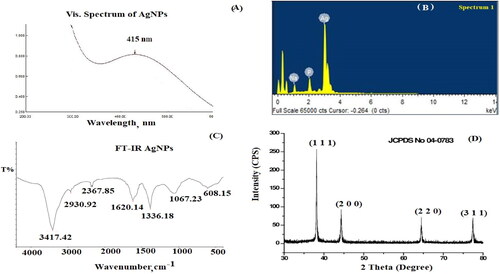
The EDX analysis of Ag nanoparticles showed that the weight percentage of Ag (86.52%) indicated that Ag ions were reduced to AgNPs ().
FT-IR analysis was performed to determine the functional groups in the investigated AgNPs sample. The FT-IR spectrum displayed different absorption bands at 3417, 2930, 2367, 1620, 1336, 1067 and 608 cm-1, corresponding to O-H stretching vibration, medium C-H stretching vibration of alkane, strong O = C=O stretching vibration of carbon dioxide, medium C = C stretching vibration of conjugated alkene, medium O-H bending alcohol, strong S = O stretching of sulfoxide, and AgNPs, respectively (). As previously reported, the observed functional groups agreed with the phytochemicals in the Capparis spinosa extract, including alkaloids, flavonoids, gallic tannins, sterols and triterpenes, glycosides cardiac, leucoanthocyanins, and holosides [Citation32].
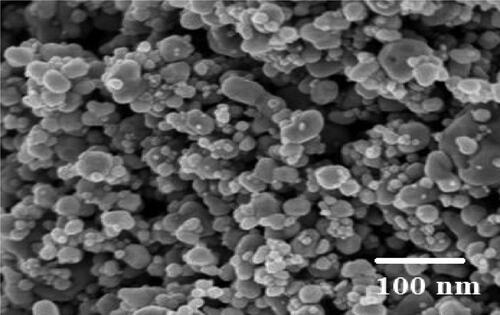
The crystalline silver nanoparticles’ X-ray diffraction pattern. The diffraction pattern reveals four distinct diffraction lines that may be attributed to the (1,1,1), (2,0,0), (2,2,0), and (3,1,1) reflections of the face-centred cubic (fcc) structure of metallic silver, respectively, at 2θ=(38.17, 44.36, 64.49, and 77.44)degree. In agreement with the literature value of a = 4.086 A°, the lattice parameter computed from the XRD pattern was a = b=c = 4.0830 A°. The literature report JCPDS File No. 04-0783 and the diffraction pattern were in agreement (). The diffraction pattern’s sharp, well-defined peaks indicate the silver nanoparticles’ enhanced crystallinity [Citation33]. The mean size of AgNPs was also calculated using Debye–Scherrer’s equation which shows the size range of the synthesised AgNPs from 13 to 21 nm. SEM analysis showed that the synthesised silver nanoparticles were spherical (). The recorded particle size was around 100 nm.
Figure 4. Scanning electron microscope (SEM) micrograph of AgNPs synthesised by CPL fruit extract.
3.2. Optimisation of detection conditions
Various variables were investigated and optimised to select the most suitable conditions for the suggested approach. The parameters include a variety of experimental factors, including the quantity of CPL/Ag nanocomposite, buffer concentration, pH, and stability time.
The suitable quantity of CPL/Ag nanoparticles was selected by experimenting with different amounts in the range of 0.5 − 5.0 mL. It was observed that adding 1.5 mL of CPL/Ag nanocomposites produced maximum absorbance ().
Figure 5. Optimisation of conditions: (A) Effect of quantity of AgNPs, (B) effect of pH value, (C) effect of [buffer], (D) effect of stability time, and (E) effect of temperature z.
![Figure 5. Optimisation of conditions: (A) Effect of quantity of AgNPs, (B) effect of pH value, (C) effect of [buffer], (D) effect of stability time, and (E) effect of temperature z.](/cms/asset/43c57e6d-d755-40f9-aeba-f36e70c41c41/tjen_a_2161525_f0005_c.jpg)
The pH value was investigated as it affects the formation and stability of CPL/Ag nanoparticles. The study was carried out by selecting pH values in the 2–8. The best absorption was found at pH 6.0 ().
Phosphate buffer was used with a concentration range of 0.2 to 1.6 mol/L, and the influence of buffer concentration on peak intensity was investigated (). The buffer concentration was increased to 0.8 mol/L, which increased the absorbance. The CPL/Ag nanocomposite aggregation caused the peak intensity at high buffer concentrations to decrease gradually.
The stability time was tested by repeating the analytical process using stability time in the 1–60 min range. The suitable time to obtain maximum absorbance was 5 min and still constant for more than 60 min ().
The effect of temperature was also investigated using the temperature range of 5–65 °C. The suitable working temperatures were in the range of 25–35 °C ().
3.3. Final spectrum for detection of DPH
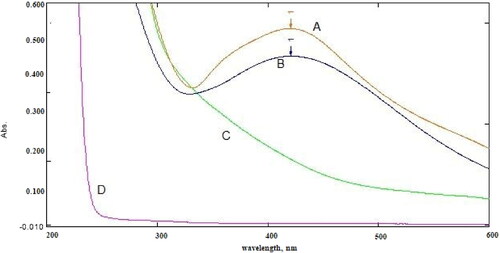
After optimising the analysis conditions, the UV-Vis spectrum of the final product was plotted. The spectra of all variables were plotted: the spectrum of the AgNO3 solution, CPL fruit extract solution, AgNPs, and the spectrum of the drug compound (DPH) in the presence of the AgNPs ().
Figure 6. Final spectrum of (A) AgNps, (B) 1 mL of DPH in the presence of AgNPS, (C) CPL fruit extract, and (D) AgNO3 solution.
3.4. The analytical procedure of the calibration curve
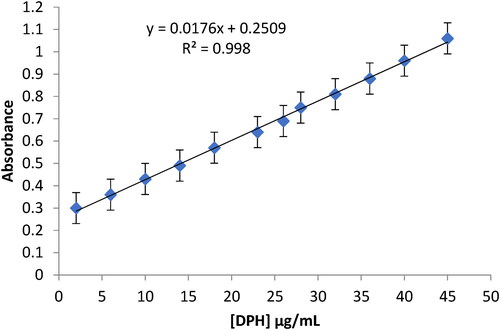
Under optimal analytical conditions, the suggested method was utilised to determine DPH in pure samples, and the analytical figures of merit were achieved at a wavelength of 415 nm. The plotted calibration curve was linear over a concentration range of 2–45 μg/mL (). The molar absorptivity and Sandel’s sensitivity index were 5.14 × 10³ L.mol−1.cm−1 and 0.057 µg.cm−2, and LOD, LOQ were 0.36 μg/mL and 1.19 μg/mL, respectively. The regression line equation was A = 0.0176[DPH] + 0.2509, determination coefficient, R2=0.998(r = 0.9990), as well as the five replicate measurements’ relative standard deviation percentage (RSD%) is 0.73%. The results showed that the proposed methods had a high sensitivity, acceptable stability, and sufficient linearity.
Figure 7. Calibration curve of DPH determination using AgNps.
4. Validation of the method
According to the ICH recommendations [Citation34], the validity of the analytical technique has been confirmed regarding the accuracy, precision, and other factors listed below.
4.1. Linearity
After the optimisation of the experimental settings, the recommended DPH-AgNPS method’s linearity was assessed by examining a series of standard DPH solutions (each with four duplicates) and quantified by following the technique specified in the experimental procedure. The results of the data’s statistical analysis are summarised in . The calibration curve was linear in the 2–45 μg/mL range. With n = 6 and r = 0.9990, the regression equation was A = 0.0176[DPH] + 0.2509.
Table 1. The analytical results of the spectrophotometric approach used to determine DPH in the presence of AgNPs sensing solution.
4.2. Limit of detection (LOD) and limit of quantitation (LOQ)
The suggested approach exhibited promising sensitivity to the target analyte with LOD(3.3σ/s) and LOQ(10σ/s) (where σ is the standard deviation of the signal and s is the slope of the regression line equation of the calibration curve) [Citation35] of 0.36 and 1.19 μg/mL, respectively. High sensitivity for DPH detection was indicated by the analytical data obtained.
4.3. Precision and accuracy
By measuring three significant concentrations of the investigated pharmaceutical compound in pure form on three separate occasions or by repeating the analysis for three successive days, the intra-day and inter-day precisions of the suggested approach were calculated (). The assessed% RSD was in the range of 0.4–0.8% for intra-day assay and 0.2–0.9% for inter-day, suggesting high precision of the recommended approach for the determination of DPH.
Table 2. The data collected for the intra-day and inter-day assays used to evaluate the suggested method’s precision.
Additionally, using the silver nanoparticles sensing solution, the percentage recovery was calculated throughout the concentration range of 2–45 μg/mL to validate the accuracy of the proposed approach. The mean recovery percentage was discovered to be 100.3 ± 0.68%, indicating the recommended method’s high accuracy ().
Table 3. Results of the accuracy test using a spectrophotometric approach in the presence of AgNPs sensing solution.
4.4. Selectivity
By investigating DPH in the presence of a few possible interfering species, the suggested method’s selectivity for the detection of DPH was validated. These are potassium, sodium, calcium, magnesium, and zinc ions. Magnesium stearate, glucose, sucrose, and starch were also studied. The suggested approach was used to evaluate the determination of 8 μg/mL of DPH in the presence of 0.8 μg/mL of each interfering species under optimal conditions. No significant interference was found, as shown in . As a result, the suggested approach can be considered a selective method for the determination of DPH.
Table 4. Tolerable values of 8 μg/mL of DPH detection in the presence of 0.8 μg/mL of interferences using the current approach in the presence AgNPs.
4.5. Analysis of pharmaceutical preparation
The collected data were statistically evaluated, and then they were compared to those from other previously published spectrophotometric approaches [Citation14] using t-test and F-test [Citation36] with a 95% confidence level (). The suggested Ag nanocomposite was used to identify DPH in the drug’s pure form, and the recovery percentage was determined to be 99.48 ± 0.69%. The established approach also estimated DPH in some pharmaceutical dosage forms, and the recovery percentage was more than 99.5%.
Table 5. Analytical data obtained by the detection of ATZ in bulk form and some commercial products using the proposed method in the presence of AgNPs.
5. Conclusions
A novel spectrophotometric method has been devised using a very sensitive AgNPs sensing solution to determine DPH as antihistamine therapy in bulk and some pharmaceutical preparations. AgNPs are spherical particles with special properties that make it possible to create a sensitive detection approach for the substance under investigation. The proposed method shows linear behaviour in the concentration range of 2–45 µg/ml, the least regression line equation is A = 0.0176[DPH] + 0.2509 (r = 0.9990). The results showed that this approach is easier to use and more flexible when exploring various sensing solutions for the determination of different antihistamine therapeutic drugs.
Authors’ contributions
Abdoon, Amin, and Birhan supervised the practical study and approved the measurements of all parameters. Abdoon, Hasan, and Salman carried out the experimental part. All authors wrote the manuscript, reviewed, read, and approved the final version.
Acknowledgments
The authors express their gratitude to the Chemistry Department – College of Science, Tikrit University, Iraq, for using their equipment and facilities.
Disclosure statement
The authors declare that they have no conflicts of interest regarding the publication of this article.
Data availability statement
The data underlying the results presented in the study are available within the manuscript.
Additional information
Funding
References
- Sharma A, Hamelin BA. Classic histamine H1 receptor antagonists: a critical review of their metabolic and pharmacokinetic fate from a bird’s eye view. Curr Drug Metab. 2003;4(2):105–129.
- Carson S, Lee N, Thakurta S. 2010. Drug class review: newer antihistamines: Final report update 2. Portland, OR: Oregon Health & Science University. http://www.ncbi.nlm.nih.gov/books/NBK50558/
- Cartwright AC. 2016. The british pharmacopoeia, 1864 to 2014: medicines, international standards and the state. 1st Ed. United Kongdom: Routledge.
- Marzouk HM, Ibrahim EA, Hegazy MA, et al. Sustainable liquid chromatographic determination and purity assessment of a possible add-on triple-action over-the-counter pharmaceutical combination in COVID-19. Microchem J. 2022;178:107400.
- Njuguna N. M, Abuga KO, Kamau FN, et al. A liquid chromatography method for simultaneous determination of diphenhydramine, promethazine, chlorpheniramine and ephedrine in cold-cough syrups. Pharm Chem J. 2017;51(2):153–158.
- Nualdee K, Buain R, Janchawee B, et al. A stir bar sorptive extraction device coupled with a gas chromatography flame ionization detector for the determination of abused prescription drugs in lean cocktail samples. Anal Methods. 2022;14(26):2557–2568.
- Phonchai A, Pinsrithong S, Janchawee B, et al. Simultaneous determination of abused prescription drugs by simple dilute-and-shoot gas chromatography–flame ionization detection (GC-FID). Anal Lett. 2021;54(4):716–728.
- Kim JY, Choi JY, Yoon CY, et al. L.C.–MS/MS monitoring of 22 illegal antihistamine compounds in health food products from the Korean market. J Korean Soc Appl Biol Chem. 2015;58(1):137–147.
- Ghalehno MH, Parvizi A, Mirzaei M. A novel electrochemical sensor for the determination of diphenylhydramine hydrochloride based on a carbon paste electrode (CPE) modified with ferrite–cobalt–silica/ionic liquid nanocomposite. Russ J Electrochem. 2022;58(5):381–390.
- Marzouk HM, Ibrahim EA, Hegazy MA, et al. A reliable electrochemical sensor based on functionalized magnetite nanoparticles for over‐the‐counter allergy medication abuse sensing in biological fluids. Electroanalysis. 2022;34(3):552–560.
- Jasim AN, Turkey N. S, Abd-Alrazack HF. Design a continuous microfluidic flow cell for turbidimetric-flow injection technology: a new approach for routine analysis of active pharmaceutical formulations. AMECJournal. 2022;5(02):90–104.
- Chunling Y, Yuhai T, Xiaonian H, et al. Flow injection chemiluminescence analysis of diphenhydramine hydrochloride and chlorpheniramine maleate. Instrumentation Science & Technology. 2006;34(5):529–536.
- Mbaye AR, Foulon C, Lecoeur M. Capillary electrophoresis as a versatile tool for quality control and epidermis permeation studies of transdermal formulations. J Pharm Biomed Anal. 2021;193:113732.
- Akram ME, Moftah AM. Spectrophotometric determination of diphenhydramine hydrochloride in pharmaceutical preparations and biological fluids via ion-pair formation. Arabian J Chem. 2010;3(4):265–270.
- Zayed MA, El-Habeeb AA. Spectroscopic study of structure of diphenhydramine drug and its products obtained via reactions with tetracynoethylene and iodine reagents and applications. Drug Test Anal. 2010;2(2):55–69.
- Hammad SF, El‐Khateeb BZ, El‐Malla SF. Micelle‐enhanced spectrofluorimetric determination of diphenhydramine: application to human plasma and its simultaneous determination with naproxen in pharmaceutical tablets. Luminescence. 2021;36(3):733–741.
- Saad RA, Salim MM, Hammad SF. Synchronous spectrofluorometric methods for simultaneous determination of diphenhydramine and ibuprofen or phenylephrine in combined pharmaceutical preparations. Luminescence. 2020;35(4):550–560.
- Shin TH, Cheon J. Synergism of nanomaterials with physical stimuli for biology and medicine. Acc Chem Res. 2017;50(3):567–572.
- Numan RS, Abdoon FM. 2020. Utility of silver nanoparticles as coloring sensor for determination of levofloxacin in its pure form and pharmaceutical formulations using spectrophotometric technique In AIP conference proceedings; Vol. 2213, No. 1, p. 20103. AIP Publishing LLC.
- Dabhane H, Ghotekar S, Zate M, et al. Green synthesis of MgO nanoparticles using aqueous leaf extract of ajwain (Trachyspermum ammi) and evaluation of their catalytic and biological activities. Inorg Chem Commun. 2022;138:109270.
- Fernandez-Baldo MA, Oetega FG, Pareira SV, et al. Nanostructured platform integrated into a microfluidic immunosensor coupled to laser-induced fluorescence for the epithelial cancer biomarker determination. Michrochem J. 2016;128:18–25.
- Ryvolova M, Chomoucka J, Drbohlavova J, et al. Modern micro and nanoparticle-based imaging techniques. Sensors (Basel). 2012;12(11):14792–14820.
- Singh N. B, Jain P, De A, et al. Green synthesis and applications of nanomaterials. Curr Pharm Biotechnol. 2021;22(13):1705–1747.
- Abdoon FM, Atawy HM. Prospective of microwave-assisted and hydrothermal synthesis of carbon quantum dots/silver nanoparticles for spectrophotometric determination of losartan potassium in pure form and pharmaceutical formulations. Mater Today: proc. 2021;42:2141–2149.
- Sivanesan I, Gopal J, Muthu M, et al. Green synthesized chitosan/chitosan nanoforms/nanocomposites for drug delivery applications. Polymers. 2021;13(14):2256.
- Zarei M, Seyedi N, Maghsoudi S, et al. Green synthesis of Ag nanoparticles on the modified graphene oxide using capparis spinosa fruit extract for catalytic reduction of organic dyes. Inorg Chem Commun. 2021;123:108327.
- Ebrahimi K, Madani M, Ashrafi B, et al. Antifungal properties of silver nanoparticles synthesized from capparis spinosa fruit. Res Mol Med. 2019;7(4):43–50.
- Azizian Shermeh O, Valizadeh M, Valizadeh J, et al. Phytochemical investigation and phytosynthesis of silver nanoparticles using aqueous extract of Capparis spinosa L. Modares J Biotechnol. 2017;8(1):80–90.
- Niluxsshun MCD, Masilamani K, Mathiventhan U. Green synthesis of silver nanoparticles from the extracts of fruit peel of Citrus tangerina, Citrus sinensis, and citrus Limon for antibacterial activities. Bioinorg Chem Appl. 2021;2021:1–8.
- Skiba MI, Vorobyova VI. Synthesis of silver nanoparticles using orange peel extract prepared by plasmochemical extraction method and degradation of methylene blue under solar irradiation. Adv Mater Sci Eng. 2019;2019:1–8.
- Zielińska A, Skwarek E, Zaleska A, et al. Preparation of silver nanoparticles with controlled particle size. Procedia Chem. 2009;1(2):1560–1566.
- Tagnaout I, Zerkani H, Mahjoubi M, et al. Phytochemical study, antibacterial and antioxidant activities of extracts of capparis spinosa L. Inter J Pharmaco Phytochem Research. 2016;8(12):1993–2005.
- Agasti N, Kaushik NK. One pot synthesis of crystalline silver nanoparticles. Amer J Nanomater. 2014;2(1):4–7.
- ICH, I. 2005. Q2 (R1): validation of analytical procedures: text and methodology. In International conference on harmonization, Geneva. November.
- Abdoon F, Bichan MJ, Mohamed Ibrahim A, et al. 2022). Ternary complexation process for new spectrophotometric assay of levodopa using Ni (II) and 2, 3-Diaminopyridine. Adv Mater Sci Eng. 2022;2022:1–8.
- Miller JC, Miller JN. 1993. Statistics for analytical chemistry. 3rd Ed. New York: ellis Horwood PTR Prentice Hall.