
 ?Mathematical formulae have been encoded as MathML and are displayed in this HTML version using MathJax in order to improve their display. Uncheck the box to turn MathJax off. This feature requires Javascript. Click on a formula to zoom.
Abstract
In this paper, the photocatalysis material CA+, which uses calcium alginate as carrier and cetyltrimethylammonium bromide as surfactant, was studied. The morphology and structure of the prepared CA+ were characterised by SEM, TEM, FT-IR and Raman spectroscopy. The surface electrical properties and stability of the catalytic materials were evaluated by Zeta potential and cycling performance measurements, and the data were analyzed and processed according to the principle of degradation kinetics. The results show that Ag@AgCl Nanoparticles are distributed on the cross-linked structure of CA in the form of clusters. The prepared CA+ photocatalyst material has good adsorption performance and photocatalytic activity for tetracycline (TC). Temperature has a significant effect on the degradation of TC by photocatalytic materials. The photocatalytic degradation rate is the highest at 40 °C, and the photocatalytic reaction rate was 0.08276 min−1. The photocatalytic degradation process at different temperatures conforms to the quasi first-order reaction kinetics. Adding a certain amount of H2O2 can produce more active species O2−. The photocatalytic material has the advantages of good stability, short photocatalytic degradation time, high catalytic efficiency, and can be used for the degradation of actual tetracycline polluted wastewater.
Keywords:
1. Introduction
Traditional wastewater pollutants usually include heavy metal ions and synthetic azo dyes, as well as a series of recent industrial pollutants, including antibiotics and antibiotic derivatives. Antibiotics are a kind of emerging organic pollutants, which are widely used to treat human and animal diseases. Due to the increase of antibiotic resistance incidents, they have aroused widespread public concern. Tetracycline (TC) is the most common broad-spectrum antibiotic, widely used to treat bacterial infections, and as an additive to promote the growth of a variety of aquaculture animals [Citation1]. However, due to excessive use, TC cannot be effectively decomposed and absorbed in organisms, resulting in a large amount of TC being discharged into the water environment, which is very harmful to the ecological environment and human health [Citation2,Citation3]. When antibiotics enter human body or animal body, only 5–9% exist in the form of maternal structure or metabolites excreted from urine or feces. This leads to extensive use of antibiotics that can cause direct or indirect environmental pollution. In order to solve the above problems, researchers proposed adsorption, biodegradation, electrochemical oxidation and other treatment methods [Citation4]. However, the adsorption method may cause secondary contamination because it is only a transfer of pollutants, rather than eliminating them. Biodegradation method has long cycle and poor treatment effect. Electrochemical oxidation requires additional power and increased water treatment costs. Therefore, how to use green technology to quickly and effectively remove TC in water is a hot research topic [Citation5]. Advanced oxidation processes usually induce the generation of hydroxyl radicals at room temperature and atmospheric pressure to degrade pollutants. Hydroxyl radical is a powerful non-selective oxidant, which can react through three mechanisms: hydrogen extraction, electron transfer and free radical addition. They can degrade complex chemical structures, most of which are man-made pollutants. Therefore, as a feasible and effective method, advanced oxidation process can be used to remove tetracycline from wastewater. As one of the advanced oxidation processes, photocatalysis technology mainly uses clean solar energy resources to reduce pollution from the source, and uses a large number of active groups generated to degrade various pollutants.
Due to the strong surface plasmon resonance (SPR) effect of Ag nanoparticles (AgNPs) and the unique heterojunction structure of Ag/AgCl, this kind of catalyst can effectively absorb visible light and realise the rapid separation of photogenerated electrons and holes. It is a new type of plasma photocatalyst with good visible light response and photocatalytic activity, and is widely used in the field of photocatalysis [Citation6–10]. Using AgMoO4 and HCl as raw materials, Wang synthesised Ag@AgCl Plasma photocatalyst by ion exchange and photo reduction. The catalyst shows very strong visible light absorption and visible light catalytic activity, and has good stability. Hu loaded Ag/AgBr on TiO2 and studied its photocatalytic and antibacterial properties. However, the poor adsorption capacity and easy agglomeration of pure Ag/AgCl for organic pollutants and subsequent complex solid–liquid separation limit the application of powdered Ag/AgCl composites. Loading Ag/AgCl nanomaterials on the surface of porous materials can effectively solve the problems of nanoparticles agglomeration, weak adsorption capacity and difficult separation and recovery while retaining high catalytic activity [Citation11–13]. At present, the various modification researches on it mainly include: Ag@AgX is compounded with inorganic semiconductor materials and new carbon materials to control their morphology. The above method realises the rapid separation of photogenerated carriers of Ag@AgX under visible light, and improves its catalytic stability.
Sodium alginate (SA) is a polysaccharide compound extracted from seaweed, which is biodegradable, stable, safe, nontoxic and easy to extract. SA is composed of two 1,4-glycosidic linkage-linked β-d-mannuronic acid (M unit) and α-l-guluronic acid (G unit) with a certain proportion of GG, MM, GM and MG sequence units. The GG fragment of SA is a double fold helical conformation with a stable and zigzag structure. The oxygen-containing groups on the GG fragment can chelate with Ca2+ to form a special ‘egg-box’ structure, and further form a calcium alginate (CA) gel with a three-dimensional network structure [Citation14].
SA composites have good adsorption properties, which can adsorb heavy metals, azo dyes, organic acids and other pollutants. CA gel as an ideal framework, in wastewater treatment, most of its embedded materials have large specific surface area and a variety of active functional groups, can adsorb a large number of pollutants, but cannot be fundamentally removed. The research on catalytic degradation materials that may covalently combine with CA gel can effectively degrade pollutants while adsorbing pollutants, which is the development direction of future research [Citation15–19].
In this study, under the dispersion of cationic emulsifier cetyltrimethylammonium bromide (CTAB), the concentration of SA and CTAB was controlled through the cross-linking between SA and Ca2+ to form a stable microgel as a template [19,Citation20–23]. At the same time, the microgel was loaded with AgCl by ion exchange and in situ deposition [Citation24]. Then, part of AgCl was reduced to AgNPs by photoreduction reaction, and dispersed on the surface of AgCl. The insoluble particle photocatalytic material was prepared and marked as CA+ [Citation25]. The prepared gel particles have the advantages of strong adsorption capacity, wide response range of visible light wave, high catalytic efficiency and easy recycling, which are used for photocatalytic degradation of TC [Citation26].
2. Materials and methods
2.1. Materials
CTAB, SA, Ca (NO3)2AgNO3, NaCl, and TC (AR, Xilong Chemical Co.). iso-propylalcohol (IBA), ethylenediaminetetraacetic salt (EDTA–2Na) and benzoquinone (BQ) (AR, West Asia Chemical Technology Co., Ltd, Shandong). All the water used in the test was deionised water.
2.2. Preparation of the CA+
10 g/L 16 mL CTAB solution was added to 2 g/L 100 mL SA solution, then CTAB and SA solution were fully mixed after ultrasonic dispersion 30 min. Under magnetic stirring, 10 mL50 g/L AgNO3 solution was slowly added, and after 15 min of magnetic stirring, 50 mL 20 g/L (CaNO3)2 solution was slowly added to the mixed suspension. After continuing stirring for 15 min, 10 mL 20 g/L NaCl solution was added slowly dropped. Stirring was closed after 30 min and the mixed system kept for 4–8 h. The particle precipitate was obtained by filtering through double-layer gauze and washed with deionised water for five times. Then, the precipitate was added into a 250 mL flask containing 50 mL deionised water, and irradiated for 30 min by using a 10 W UV lamp under magnetic stirring. The filtered particles of the double-layer gauze were washed 5 times with deionised water, and vacuum freeze-drying was conducted to obtain photocatalytic materials, which were counted as CA+.
2.3. Characterisations of the CA+
The morphology of CA+ was analyzed by Helios Nanolab600i field emission scanning electron microscope (SEM, FEI, USA), and the operating voltage was 30 kV. JEM-1400 transmission electron microscope (TEM, Japan Electronics Co., Ltd.) was used to observe the morphology and particle size of the catalyst sample, and the operating voltage was 200 kV. FT-IR was measured by IR Tracer-100 Fourier transform infrared spectrometer with resolution of 4 cm−1 and scanning range of 400–4000 cm−1. The UV–Vis absorption of the sample was detected by TU-1901 dual-beam UV–Vis diffuse reflectance spectrophotometer (Beijing Purification General Instrument Co., Ltd.). The analysis range was 200–800 nm with BaSO4 as the reference. UV2600 spectrophotometer (Japan Shimadzu Company) was used to determine the absorbance value of degradation solution. The Zeta potential of samples was measured by Malvern ZEN3600 Zeta potentiometer (UK).
A 350 W xenon lamp (with a filter with a cutoff wavelength of 380 nm to ensure the wavelength λ > 380 nm) was used as the visible light source in the reaction system.
2.4. Evaluation of the CA+
The prepared CA+ photocatalytic material 0.2 g was added into three 100 mL flasks, and then 60 mL 10 mg L−1 TC solution was added. The initial pH value was adjusted to 6. 0, and the solution temperature was selected to 35, 40, 45 °C, respectively. After the adsorption equilibrium was achieved by magnetic stirring for 30 min in the dark room, the photocatalytic reaction was carried out under the irradiation of 350 w xenon lamp (light distance 10 cm). A total of 3 mL upper reaction solution was sampled at a certain time interval as the test solution. The relationship between the absorbance of the solution and time was measured at a certain wavelength, and the kinetic relationship between ln(C0/Ct) and t was investigated, where C0 and Ct were the concentration of TC (mg/L) at reaction time 0 and t, respectively.
The prepared photocatalytic material 0. 3 g was added to a 100 mL triangular flask containing 50 mL TC aqueous solution (10 mg/L), and then the pH value was adjusted to 6. 0, and the temperature was controlled at 40 °C. After adsorption in dark for 30 min under magnetic stirring, it was placed in the visible light and irradiated for 21 min. After the reaction was completed, the catalyst was centrifuged, washed with deionised water for repeated degradation tests. In the influence test of H2O2, 100 mL of two triangle bottles were taken, after adsorption for 30 min, 0. 2 mL of 30% (w/w) H2O2 was added to one bottle, and no H2O2 was added to the other bottle, the reaction time was 18 min, other conditions remained unchanged. In the free radical capture experiment, 100 mL of four triangle bottles were taken, and then three of them were added IPA (5 mL), EDTA–2Na (0. 5 g) and BQ (0. 5 g), respectively, as ·OH、h+ and ·O2– in the catalytic degradation reaction as scavengers, and the remaining one as control. Other conditions remain unchanged. Ct/C0 was used to evaluate the photocatalytic degradation of TC. In this paper, the photocatalytic performance of the samples was evaluated by photocatalytic degradation of methyl orange and phenol solutions.
2.5. Reaction kinetic analysis
In order to study the degradation kinetics of CA+ on TC, the kinetic equation Langmuir–Hinshelwood kinetic model was used. If the degradation reaction is a first-order reaction, the rate equation is as follows:
(1)
(1)
where k is the rate constant of photocatalytic reaction, t and Ct are the irradiation time and the concentration of TC remaining at the irradiation time of t (min), respectively. By integrating the two sides of the equation, the first-order reaction photocatalytic degradation rate equation can be obtained as follows:
(2)
(2)
where Ct (mg/L) is the concentration of TC remaining at the irradiation time of t (min), C0 (mg/L) is the initial concentration of TC, and the slope k (min−1) is the apparent rate constant. The kinetic relationship of photocatalytic degradation of TC by CA+ was investigated by this equation.
3. Results and discussion
3.1. Structural analysis
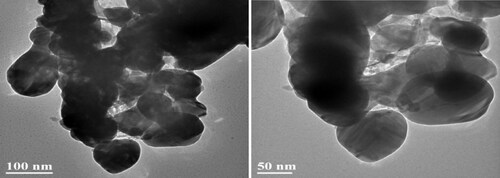
and Citation2 show the SEM and TEM images of CA+ material, respectively. A large number of irregular AgCl and Ag@AgCl particles were loaded in the catalytic material structure, partially overlapped and stacked in clusters. Ag@AgCl particles are spherical with uneven particle size of 50–100 nm. It could be seen that AgCl and Ag@AgCl particles were successfully loaded in the Ca2+ crosslinking gap. The gel grid structure could act as a separator to effectively segment the cluster Ag @AgCl particles, which is beneficial to the adsorption and rapid degradation of TC by the composite materials to a certain extent, and effectively improves the photocatalytic performance of the composite materials. The modification amount of nanoparticles Ag@AgCl also affects the absorption and utilisation of visible light by the composite. The surface plasmon resonance (SPR) effect became more and more obvious with the increase of the amount of nano particles Ag@AgCl modified, and the visible light absorption intensity of the composite increased gradually.
Figure 1. The SEM of the sample.
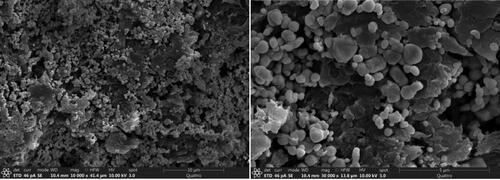
Figure 2. The TEM of the sample.
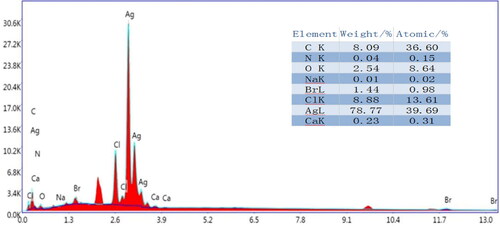
shows the EDS spectra and main element analysis of the prepared CA+. In addition to the C, O and Ca elements of CA in the sample, there are also Ag and Cl elements. The mass concentration of Ag element and the concentration of Ag atom are the largest, and the concentration of Ag atom is about three times that of Cl atom, namely, Ag: AgCl = 2: 1, indicating that Ag+ in some AgCl is reduced to Ag0 nanoparticles and loaded on the surface of AgCl particles [Citation19]. It indicated that at least one nano-Ag particle attached to each AgCl particle surface. In addition, the prepared SA+ contains a certain amount of N and Br atoms, indicating that CA+ contains a small amount of AgBr and CTAB cationic components, in which AgBr particles could synergistically degrade TC by Ag@AgCl.
Figure 3. The EDS profiles of the sample.
3.2. FT-IR analysis
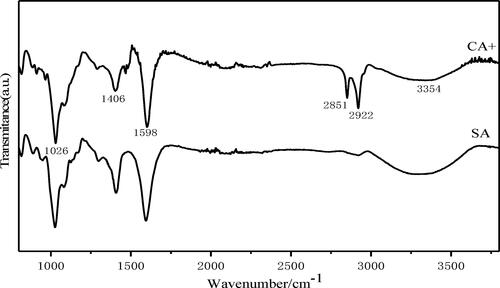
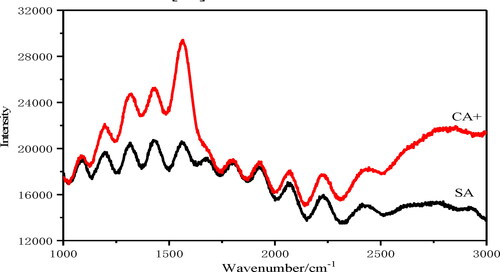
It can be seen from that the absorption peak at 1026 cm−1 in CA+ belongs to the C–O–C stretching vibration absorption peak of epoxy group. The peaks at 1406 cm−1 and 1598 cm−1 were attributed to the bending vibration of –OH (from –COOH) and the stretching vibration of C = O, respectively. The peak at 2851 cm−1 is attributed to the stretching vibration of methylene (–CH2–) in the alkyl chain of CTAB molecule, and the peak at 2922 cm−1 belongs to the vibration absorption peak of methyl (–CH3). It is known that the stretching vibration absorption of free hydroxyl group is located in 3640–3610 cm−1 region, while the stretching vibration peak of associated hydroxyl group is located in 3400–3200 cm−1 region. The broad absorption peak near 3354 cm−1 is the stretching vibration peak of associated hydroxyl (–OH), which is the stretching vibration of O–H bond of oxygen-containing functional groups.
Figure 4. FT-IR spectra of the CA+ and SA.
3.3. The Raman spectra
Through the analysis of Raman spectrum, we can know the vibration and rotation energy level of the material, so that we can identify the material and analyze its properties. Due to the strong local plasma resonance on the surface of AgNPs, there is a very strong local electromagnetic field at the structural gap. The spectral properties of adsorbed molecules in AgNPs will be greatly affected, and the most obvious one is surface enhanced Raman spectroscopy (SERS) [Citation21]. shows that compared with SA, the positions of each peak in CA+ Raman spectra are basically unchanged, but the intensity of the peak changes significantly at 1100–1700 cm−1. With AgNPs as the substrate, the Raman peak of CA+ has obvious enhancement effect. Some oxygen-containing functional groups interacted with AgNPs, and the peak signal is strong, indicating that AgNPs were well combined in CA gel. The vibration peak of carbonyl group was at 1661 cm−1, and no corresponding band appeared in SERS, indicating that the C = O bond was destroyed due to the strong interaction with the silver surface [Citation22].
Figure 5. The Raman spectrum of the CA+ and SA.
3.4. Photocurrent and EIS
The conversion efficiency of solar energy to chemical energy is determined by the balance of these thermodynamic and dynamic processes. In order to obtain excellent photocatalysis performance, effectively carry out visible light induced photocatalysis, and make full use of solar energy resources, photocatalysts must have wide light absorption range, high charge separation efficiency, fast charge mobility, and strong redox capacity at the same time. shows the transient photocurrent response characteristics of the composite photocatalyst under each opening and shading light. The CA+ can produce fast and stable photocurrent under visible light irradiation, and have good reversibility. Therefore, this catalytic material has strong photosensitivity, good photocurrent response, high photogenerated electron transfer efficiency and photogenerated electron-hole pair separation efficiency, indicating that the prepared CA+ has high photocatalytic activity.
Figure 6. The transient photocurrent response (a) and EIS(b) of the CA+.
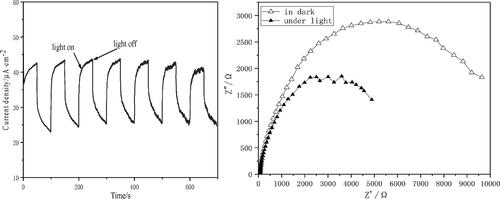
Electrochemical impedance spectroscopy (EIS) is an effective means to analyze the charge transfer at the interface of photocatalyst. Sine wave AC impedance technology is commonly used in electrochemical impedance spectroscopy (EIS). Control the electrode current (or electrode potential) to make it change slightly with time according to the sine wave rule, and measure the change rule of electrode potential (or current) as its response with time. The smaller the arc radius in the EIS is, the higher the electron-hole separation efficiency of the material is. The EIS of the CA+ in shows that the radius of arc is larger without irradiation, while the radius of arc is significantly reduced under visible light. Therefore, under light radiation, the prepared CA+ has smaller photogenerated electron transfer resistance and lower photogenerated electron-hole recombination rate, showing good photocatalytic performance.
3.5. UV–Vis DRS characterisation
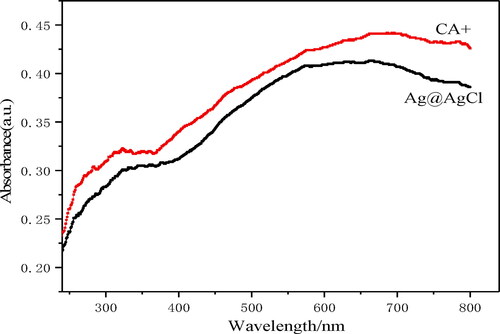
UV–Vis diffuse reflectance spectroscopy (UV–Vis DRS) mainly uses the reflection of light on the surface of a substance to obtain information about the substance, which is related to the electronic structure of the substance. It is generally used to study the structure, oxidation state, coordination state and coordination symmetry of transition metal ions and their complexes on the catalyst surface; the light absorption property of the catalyst can be studied in photocatalysis. Studies have shown that the band gap energy of pure phase AgCl is relatively large (∼3.25 eV) [Citation23], and it can only absorb and utilise ultraviolet light. It can be seen from that compared with AgCl, the CA+ has a relatively strong absorption in the visible region (400–800 nm), which is due to the plasma resonance effect of some AgCl-reduced AgNPs that makes the catalyst have a strong absorption in the visible region [Citation19]. Compared with Ag@AgCl, the CA+ also significantly enhanced the absorption of visible light.
Figure 7. UV–Vis DRS of the CA+ and Ag@AgCl.
3.6. Electrical and stability of the CA+
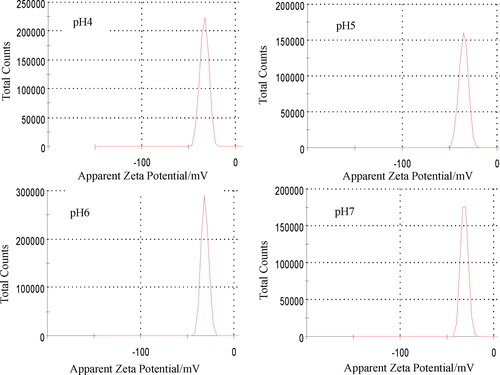
The visible light driven photocatalyst for practical application needs not only high photocatalytic activity, but also high stability. Zeta (ζ) potential can reflect the charge of adsorbed molecules on the surface of catalytic materials, which is an important indicator to characterise the stability of catalytic materials . The Zeta potentials of the CA+ are shown in . The Zeta potentials of pH4, 5, 6, 7 were −32. 8、–30. 9、–34. 9、–30. 9 mV, respectively, which indicated that the surface of the CA+ was negatively charged in the range of pH 4–7. At this time, there was repulsion between the catalytic materials, indicating that the CA+ had strong stability.
Figure 8. Potential distribution of the CA+.
3.7. Stability test of the CA+
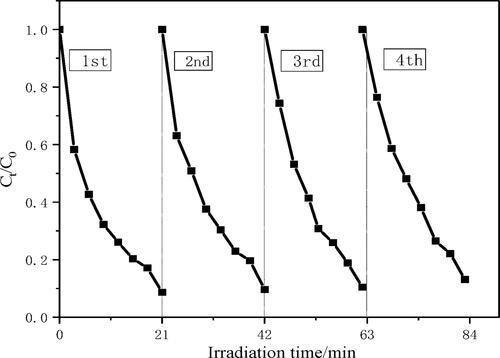
The stability and long-term utilisation of photocatalyst are very important for photocatalytic degradation of pollutants. Therefore, in order to further verify the stability of the photocatalyst, the photocatalytic cycle experiment was carried out. After four experiments, the photocatalytic performance of the photocatalyst did not decrease significantly. After the CA+ was recycled for four times, the degradation curve of TC is shown in . The degradation rates of TC by the CA+ were 98.5, 92.5, 88.7 and 85.5%, respectively, and the degradation rate could still be maintained above 85%, showing high stability, so it has important practical significance. It indicates that the catalytic material has good photocatalytic stability and reusability, and it has great potential as a visible light catalyst for practical production.
Figure 9. Stability test of TC degradation.
3.8. Effect of the temperature
shows the degradation curves and fitting kinetics curves of photocatalytic degradation of TC at 35, 40 and 45 °C, respectively. The results showed that after 30 min of adsorption, the adsorption rates were 5.6, 9.3 and 4.6%, respectively, and 40 °C showed high adsorption performance. Tetracycline has three pKa values (pKa1=3. 3, pKa2=7. 7 and pKa3=9. 7), which are cation (+, 0, 0) in acidic solution and anion (+, –, – or 0, –, –) in alkaline solution. When 4. 3 < pH <7. 7, the surface of the catalyst was negatively charged, and TC mainly existed in the form of TCHO2. The electrostatic repulsion between the catalyst and TC decreased, thereby increasing the adsorption effect [Citation24].
Figure 10. The absorption curve of TC degradation at 35 °C (a), 40 °C (b), 45 °C (c) and their fitted kinetic curves (d).
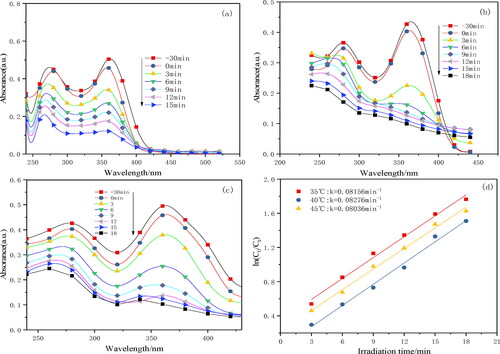
The relationship between ln (C0/Ct) and t at three different temperatures has a good linear correlation, and their correlation coefficients(R)are greater than 0. 99. It can be determined that the process of photocatalytic degradation of TC conforms to the quasi-first-order reaction kinetics model. The degradation rate of TC was greatly affected by three different temperatures. The degradation rate of TC was the highest at 40 °C, with the photocatalytic reaction rate 0. 08276 min−1.
3.9. Effect of H2O2
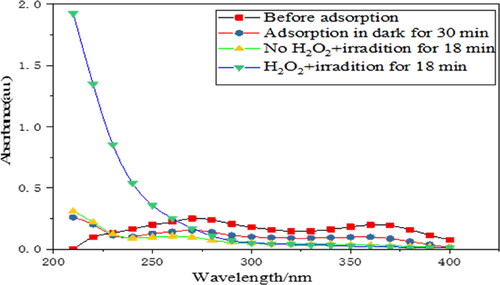
When exposed to light for 18 min, TC without H2O2 showed a weak absorption peak at 267 nm (), indicating that there was still a small amount of aromatic ring A structure. However, when a small amount of H2O2 was added into the system, the peaks caused by tetracycline at 267 nm and 355 nm (aromatic ring B–D and its linked chromogenic group) disappeared, indicating that tetracycline was completely degraded. It is well known that H2O2 is unstable under light and can be decomposed into O2 and H2O. The generated·O2 was adsorbed on the catalyst surface and reacted with photogenerated electrons to generate more active species ·O2. In this way, the extra O2 was involved in the degradation of TC, which further improved the photocatalytic degradation efficiency.
Figure 11. The absorption curve of TC with H2O2 and without H2O2.
3.10. Photocatalytic mechanism analysis
The role of photocatalyst is to accelerate specific oxidation and reduction processes with the participation of light energy. Generally, the photocatalytic reaction follows three basic steps: (1) the generation of electron and hole pairs; (2) The separation of electron and hole pairs and their diffusion to the semiconductor surface; (3) photoreduction and photooxidation reactions are carried out at the surface catalytic active sites.
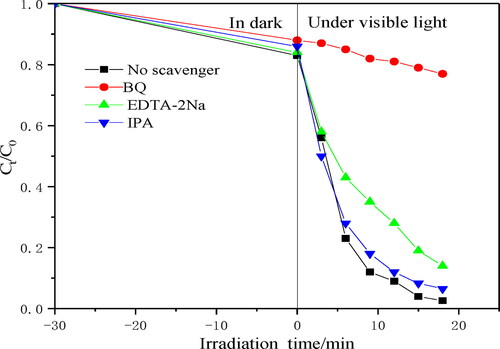
In order to further understand the active substances that CA+ photocatalytic materials play a major role in the photocatalytic degradation of TC, free radical quenching experiments were carried out. shows the degradation rates of photocatalytic materials with and without different quenching agents. The addition of BQ and EDTA–2Na could significantly reduce the photocatalytic activity, especially the addition of BQ makes the catalytic activity more significantly reduced. The dissolved oxygen molecules adsorbed on the surface can be reduced by photogenerated electrons on the conduction band to generate ·O2-, which promotes the degradation of TC, and h+ could directly oxidise and degrade TC. The addition of IBA had little effect on the photocatalytic degradation rate. Therefore, under visible light irradiation, h+ could hardly oxidise water molecules to ·OH, and ·OH had little contribution to the degradation. The above results showed that ·O2-and h+ were the main active species involved in the photocatalytic degradation of TC (see and Citation12).
Figure 12. Effect of different scavengers on photodegradation of TC.
When the frequency of the incident light is the same as that of the metal conduction electron, the nano metal will strongly absorb the incident light. The electrons absorbed by the light vibrate violently on the metal surface and cause a very strong electric field around. After recombination with semiconductor photocatalyst materials, high-energy vibrating hot electrons may be excited from the Fermi energy level of the metal and jump to the conduction band of the semiconductor, or the strong electric field may induce the separation of positive and negative charges in the surrounding semiconductor. Due to the SPR effect, AgNPs can efficiently absorb visible light and generate photogenerated electrons and h+ in the visible region. Photogenerated electrons are transferred to the surface of AgNPs through the Ag@AgCl heterojunction, while h+ is transferred to the surface of AgCl particles, so as to realise the separation of photogenerated electrons and holes. The O2 of the solution obtains photogenerated electrons and generates ·O2-[Citation25]. These ·O2-, h+ can degrade TC adsorbed on the catalyst surface by CA gel. Hole h+ is transferred to the surface of AgCl particles, and Cl0 can also be generated by interaction with Cl−. Cl0 has strong oxidation ability and can rapidly oxidise the TC molecules adsorbed on the catalyst surface. At the same time, Cl0 is reduced to Cl−, thus effectively ensuring the stability of Ag/AgCl catalytic system [Citation26].
4. Conclusion
The CA+ photocatalytic material prepared by chemical coupling, in situ deposition and photoreduction has the advantages of simple preparation process, high loading rate, response to visible light. AgCl and Ag@AgCl particles were successfully loaded in the Ca2+ crosslinking gap, and the gel grid structure could act as a separator to effectively segment the cluster Ag@AgCl particles, which effectively improves the photocatalytic performance of the composite materials. Due to the interaction between some oxygen-containing functional groups and silver nanoparticles, the stretching vibration peak is weakened and the Raman signal peak is strong, indicating that the silver nanoparticles are well compounded in the calcium alginate gel. The CA+ has better photocurrent response performance, smaller photogenerated electron transfer resistance and lower photogenerated electron-hole recombination rate. The material has negative charge on the surface, while tetracycline is a cation in acidic solution, so it has good adsorption performance for TC. Temperature has a significant effect on the degradation of TC by CA+ and the catalytic degradation rate is the highest at 40 °C. Adding a certain amount of H2O2 helps to completely degrade TC. The CA+ is small and granular, with good photocatalytic stability and reusable properties, and is easy to recycle. As a visible light catalyst, the degradation of tetracycline polluted wastewater has great potential.
This paper has made some progress in the preparation of photocatalyst and the research of tetracycline degradation. However, the research in this paper is carried out under the simulated tetracycline wastewater, which can sample the factory wastewater with large tetracycline consumption, such as aquaculture, and then degrade the real tetracycline wastewater, so as to evaluate the effect of photocatalyst in practical application.
Acknowledgments
The authors would like to show sincere thanks to those techniques who have contributed to this research.
Data availability statement
The figures used to support the findings of this study are included in the article.
Disclosure statement
The authors declare that they have no conflicts of interest.
References
- Xue X, Chen X, Zhang Z. Enhancement of redox capacity derived from O-doping of g-C3N4/WO3 nanosheets for the photocatalytic degradation of tetracycline under different dissolved oxygen concentration. Dalton Trans. 2022;51(3):1086–1098.
- Li J, Wang B, Pang Y. Fabrication of 0D/1D Bi2MoO6/Bi/TiO2 heterojunction with effective interfaces for boosted visible-light photocatalytic degradation of tetracycline. Colloids Surf A: Physicochem Eng Aspects. 2022;638:128697.
- Zhu MT, Tonni AK, You YP. Fabrication, characterization, and application of ternary magnetic recyclable Bi2WO6/BiOI@Fe3O4 composite for photodegradation of tetracycline in aqueous solutions. J Environ Manage. 2020;270:110839.
- Yuan J, Pudukudy M, Hu T, et al. CeOx-coupled MIL-125-derived C-TiO2 catalysts for the enhanced photocatalytic abatement of tetracycline under visible light irradiation. Appl Surf Sci. 2021;557:149829.
- Krishnan D, Amanulla B, Vellaichamy B. Photocatalytic degradation of tetracycline under visible light using TiO2@sulfur doped carbon nitride nanocomposite synthesized via in-situ method. J Environ Chem Eng. 2021;9(4):105560.
- Nekouei F, Nekouei S, Noorizadeh H. Enhanced adsorption and catalytic oxidation of ciprofloxacin by an Ag/AgCl@N-doped activated carbon composite. J Phys Chem Solids. 2018;114:36–44.
- Tang Y, Jiang Z, Xing G, et al. Efficient Ag@AgCl cubic cage photo catalysts profit from ultrafast plasmon-induced electron transfer processes. Adv Funct Mater. 2013;23(23):2932–2940.
- Ma X, Dai Y, Yu L, et al. Electron–hole pair generation of the visible-light plasmonic photo catalyst Ag@AgCl: enhanced optical transitions involving mid gap defect states of AgCl. J Phys Chem C. 2014;118(23):12133–12140.
- Fan G, Luo J, Guo L, et al. Doping Ag/AgCl in zeolitic imidazolate framework-8 (ZIF-8) to enhance the performance of photodegradation of methylene blue. Chemosphere. 2018;209:44–52.
- Song B, Tang Q, Li Q, et al. Template assisted synthesis of Ag/AgBr/AgCl hollow microspheres with heterojunction structure as highly activity and stability photocatalyst. Mater Lett. 2017;209:251–254.
- Xu X, Wang M, Pei Y, et al. SiO2@Ag/AgCl: a low-cost and highly efficient plasmonic photocatalyst for degrading rhodamine B under visible light irradiation. RSC Adv. 2014;4(110):64747–64755.
- Sohrabnezhad SH, Pourahmad A. As-synthesis of nanostructure AgCl/Ag/MCM-41 composite. Spectrochim Acta A Mol Biomol Spectrosc. 2012;86:271–275.
- Tang Y, Subramaniam VP, Lau TH, et al. In situ formation of large-scale Ag/AgCl nanoparticles on layered titanate honeycomb by gas phase reaction for visible light degradation of phenol solution. Appl Catal B. 2011;106(3–4):577–585.
- Liu SJ, Li Y, Li L. Enhanced stability and mechanical strength of sodium alginate composite films. Carbohydr Polym. 2017;160:62–70.
- Song D, Park S-J, Kang HW, et al. Recovery of lithium(I), strontium (II), and lanthanum (III) using Ca–alginate beads. J Chem Eng Data. 2013;58(9):2455–2464.
- Gao Q, Wang X, Wang H, et al. Sulfhydryl-modified sodium alginate film for lead-ion adsorption. Mater Lett. 2019;254(25):149–153.
- Dong H, Chen G, Sun J. A novel high-efficiency visible-light sensitive Ag2CO3 photocatalyst with universal photodegradation performances: simple synthesis, reaction mechanism and first-principles study. Appl Catal B. 2013;134:46–54.
- Li D, Li W, Zhang J. Al doped MoS2 monolayer: a promising low-cost single atom catalyst for CO oxidation. Appl Surf Sci. 2019;484:1297–1303.
- Wang P, Huang B, Qin X, et al. Ag@AgCl: a highly efficient and stable photocatalyst active under visible light. Angew Chem. 2008;120(41):8049–8051.
- Asadi S, Eris S, Azizian S. Alginate-based hydrogel beads as a biocompatible and efficient adsorbent for dye removal from aqueous solutions. ACS Omega. 2018;3(11):15140–15148.
- Liu K-K, Tadepalli S, Wang Z, et al. Structure-dependent SERS activity of plasmonic nanorattles with built-in electromagnetic hotspots. Analyst. 2017;142(23):4536–4543.
- Schweinsberg DP, Hope GA, Trueman A, et al. An electrochemical and SERS study of the action of polyvinylpyrrolidone and polyethylenimine as inhibitors for copper in aerated H2SO4. Corros Sci. 1996;38(4):587–599.
- Bi Y, Ouyang S, Cao J, et al. Facile synthesis of rhombic dodecahedral AgX/Ag3PO4 (X = Cl, Br, I) heterocrystals with enhanced photocatalytic properties and stabilities. Phys Chem Chem Phys. 2011;13(21):10071–10075.
- Wu H, Xie H, He G, et al. Effects of the pH and anions on the adsorption of tetracycline on iron-montmorillonite. Appl Clay Sci. 2016;119:161–169.
- An CH, Peng S, Sun YG. Fast synthesis of sunlight-driven AgCl: Ag plasmonic nanophotocatalyst. Adv Mater. 2010;22(23):2570–2574.
- Wang P, Huang B, Qin X, et al. Ag@ AgCl: a highly efficient and stable photocatalyst active under visible light. Angew Chem Int Ed Engl. 2008;47(41):7931–7933.