
 ?Mathematical formulae have been encoded as MathML and are displayed in this HTML version using MathJax in order to improve their display. Uncheck the box to turn MathJax off. This feature requires Javascript. Click on a formula to zoom.
Abstract
Fibroblast growth factor receptor 2 (FGFR2), as a transmembrane receptor tyrosine kinase, is implicated in a plethora of human cancers, including intrahepatic cholangiocarcinomas, breast cancers, and non-small cell lung cancer. The clinically relevant V564F gatekeeper mutation conferred resistance to current FGFR2 drug − Infigratinib. In this study, the protein − ligand interactions between FGFR2 kinase domain (wild-type and V564F) and Infigratinib were compared through an integrated computational method. The multiple, large-scale molecular dynamics (MD) simulations, together with dynamic cross-correlation analysis and binding free energy calculations suggested that the resistant mutation may not trigger the conformational changes of the FGFR2 kinase domain. The simulation results also indicated that the driving force to decrease the binding affinity of Infigratinib to the FGFR2 V564F variant derived from the difference in the protein − ligand hydrogen bonding interactions. Moreover, the per-residue free energy decomposition analysis revealed that the reduced contributions from several residues in the ATP-binding site of FGFR2, especially Glu565 and Ala567 located at the kinase hinge domain, were the key residues responsible for the loss of binding affinity of Infigratinib to the V564F variant. This study may offer useful information for the design of novel selective kinase inhibitors targeting FGFR2.
1. Introduction
As transmembrane receptor tyrosine kinases, fibroblast growth factor receptors (FGFRs) transduce cellular signaling triggered by fibroblast growth factors (FGFs). There are four members of FGFRs, including FGFR1–4, which are implicated in versatile cellular functions such as cell growth, proliferation, apoptosis, and wound healing [Citation1]. All FGFRs constitutes an extracellular binding domain, a single transmembrane domain, and an intracellular domain. FGFs binding to the extracellular domain leads to receptor dimerization and subsequent conformational rearrangements that result in order-specific trans-autophosphorylation of tyrosine residues located at the intracellular kinase domain [Citation2]. FGFRs act as activators that are involved in many cascade pathways such as PI3K-AKT, Ras-MAPK, and signal transducer and activator of transcription proteins [Citation3].
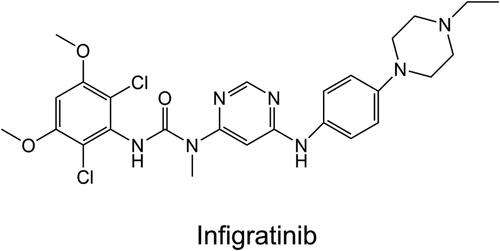
Owing to the important role of FGFRs, abnormal activation of FGFRs through overexpression, point mutations, and chromosomal translocations has implicated in a plethora of human cancers, including intrahepatic cholangiocarcinomas, breast cancers, head and neck squamous cell carcinomas, and non-small cell lung cancers [Citation1]. Thus, the clinical development of potent and selective FGFR kinase inhibitors has provided a therapeutic strategy for many malignancies [Citation4–6]. Until now, three classes of FGFR inhibitors have been reported over the past few years, including small FGFR inhibitors, FGF/FGFR monoclonal antibodies, and FGF ligand traps. For small molecule inhibitors, numerous candidate compounds have been validated to be highly potent and selective FGFR inhibitors, which have already proved by the US Food and Drug Administration (FDA) or entered clinical studies [Citation7]. For example, Erdafitinib (JNJ-42756493), Infigratinib (BGJ398) (), and Pemigatinib (INCB054828) were approved by the FDA for the treatment of patients with cholangiocarcinomas harboring FGFR2 gene fusions/translocations [Citation8–10].
Figure 1. The two-dimensional Chemical structure of Infigratinib.
Despite the clinical benefits obtained by FGFR inhibitors for treating cancers, disease progression frequently occurs within 6–8 months after drug treatment [Citation11]. Like other receptor tyrosine kinase inhibitors, the emergence of drug resistance has also found in the FGFRs caused by acquired secondary mutations. Through molecular analysis of cell-free circulating tumor DNA (cfDNA), primary tumors, and metastases after treatment of Infigratinib in patients with advanced FGFR2 fusion-positive intrahepatic cholangiocarcinomas, a number of recurrent secondary kinase domain mutations (N549H/K, V564F, E565A, L617V, K641R, and K659M) were observed, which displayed clinical resistance against Infigratinib [Citation12]. Of them, the FGFR2 V564F mutation located at the hinge domain is a gatekeeper mutation. However, the resistance mechanism of Infigratinib to the FGFR2 V564F gatekeeper mutation remains unknown.
Herein, molecular docking and classic molecular dynamics (MD) simulations were carried out to shed light on the resistance mechanism of Infigratinib caused by the FGFR2 V564F gatekeeper mutation. A combination of multiple, microsecond MD simulations, dynamical cross-correlation analysis, and binding free energy calculations were used to uncover the effect on the V564F gatekeeper mutation on the flexibility and the influence of conformational dynamics of FGFR2 regions on Infigratinib binding. The critical protein-ligand interactions relative to drug resistance were revealed by per-residue free energy decomposition. These results may help our understanding of V546F resistance mechanism and allow for better design of novel potent inhibitors to overcome the V546F gatekeeper mutation of FGFR2.
2. Materials and methods
2.1. Preparation of initial complex using molecular docking
The three-dimensional crystal structure of human FGFR2 kinase domain (PDB ID: 3RI1) [Citation13]was downloaded from the Protein Data Bank (PDB). The missing loop structure (Gly583–Glu595) of the FGFR2 was built using the UCSF Chimera software [Citation14]. The initial coordinates of FGFR2–Infigratinib complex were obtained from protein-ligand docking studies using the AutoDock4.2 software. The Kollman united atom partial charges were assigned for the protein and the Gasteiger partial charges were assigned for all ligand atoms and rotatable bonds were identified using AutoDock Tools. A cubic box of 60 Å 60 Å
60 Å with a grid spacing of 0.375 Å centered on the ATP-binding site was defined. The affinity maps of the FGFR2 were calculated using AutoGrid software. The subsequent docking parameters were set as follows: 100 docking trails which were clustered according to the root-mean-square deviation (RMSD) tolerance of 1.0 Å, the maximum number of evaluations set as 2,500,000, and other parameters were set as default. The highest ranked structure was selected to perform further MD simulations. The V564F mutant was constructed based on this structural complex using the PyMOL program.
2.2. MD simulations
MD simulations were carried out to investigate the interaction of Infigratinib with the wild-type (WT) and V564F mutant using the Amber 18 software [Citation15]. The partial atomic charges for Infigratinib were calculated using the restrained electrostatic potential (RESP) method based on HF/6-31G* basis set (Gaussian 09, Gaussian, Inc.: Wallingford CT, 2009) [Citation16]. Then, the FGFG2 and Infigratinib were treated by the Amber ff14SB force field [Citation17]and General Amber Force Field (GAFF) [Citation18], respectively. The FGFR2–Infigratinib complex was solvated in an octahedral box of TIP3P [Citation19] water molecules with a 12 Å distance between the complex surface and the box boundary. To neutralize the overall charge of the complex, 3 counterions of Na+ were added into both systems. Thereafter, a total of 0.15 mol/L NaCl were added to the solvent to simulate the physiological condition.
Two-step minimizations, heating, and equilibration were performed prior to MD simulation. During the two-step minimizations, solvent atoms were first fixed while solute molecules were relaxed. Next, solvent and solute atoms were allowed to move freely without any restraint. During each step, 10,000 steps of steepest descent algorithm and 20,000 steps of conjugated gradient algorithm were applied. Then, the system was heated up from 0 to 300 K in 300 ps with harmonic restraints of 10 kcal mol−1
Å−2, followed by the equilibration simulation which was applied at 300 K for 700 ps. Finally, the system was submitted to 1000 ns MD simulation in the NPT ensemble, which was repeated three times using random velocities. During simulations, the van der Waals nonbonded terms were calculated with a 10.0 Å cutoff, and long-range electrostatics were treated by particle-mesh Ewald algorithm [Citation20]. The temperature was maintained at 300 K and pressure at 1 bar using Langevin dynamics and Berendsen barostat, respectively. Covalent bonds involving in hydrogen atoms were constrained with the SHAKE algorithm [Citation21]. A time step of 2 fs was performed and coordinates were recorded every 10 ps for further analysis.
2.3. Binding free energy calculations
The binding free energy (ΔGbinding) of the protein-ligand complex was calculated using the molecular mechanics/generalized Born surface area (MM/GBSA) method [Citation22–26]. The (ΔGbinding) was calculated as follows:
(1)
(1)
The free energy term was calculated as an average over the selected snapshots.
(2)
(2)
(3)
(3)
ΔEMM can be split into three terms, including the intermolecular interaction energy (ΔEint), van der Waals energy (EvdW), and electrostatic energy (ΔEelec). The solvation term (ΔGsolv) can be split into polar (ΔGpolar) and nonpolar contributions (ΔGnonpolar). ΔGpolar was estimated using the modified generalized Born (GB) model developed by Onufriev et al. (igb = 2) [Citation22]. The ΔGnonpolar was calculated using the solvent accessible surface area (SASA) model. Conformational entropy was not calculated because of the high computational demand and low prediction accuracy [Citation22]. In this study, the ΔGbinding was calculated by using the trajectories from MD simulations between 700 and 1000 ns with 300 snapshots for three independent runs.
2.4. Residue-based decomposition of binding free energy
Per-residue free energy decomposition was carried out to highlight the key residues that are responsible for inhibitor binding using the above MM/GBSA method. Each residue contribution includes four energy terms: ΔEele, ΔEvdw, ΔGGB, and ΔGSA.
2.5. Cross-correlation analysis
To show the dynamics of the structure of the simulated systems, dynamical cross-correlation analysis was performed to analyze the cross-correlation shifts of the Cα atoms [Citation27, Citation28]. The cross-correlation matrix (Cij) between residues i and j were calculated using the following equation:
(4)
(4)
where i and j represent the ith and jth Cα atoms of two residues. Positive Cij values (Cij > 0) indicate the two atoms i and j moving in the same direction, while negative Cij values (Cij < 0) describe anti-correlated motions between the two atoms i and j. The zero value of Cij (Cij = 0) suggest no correlation between the two atoms i and j.
2.6. Free energy landscapes
Free energy landscapes were calculated through plotting the two-dimensional histogram of p(d1, d2) using the following equation:
(5)
(5)
where p(d1, d2), kB, and T represent the occupancy probability of each grid point on the two-dimensional plane, Boltzmann’s constant, and the temperature of the system, respectively.
3. Results and discussion
3.1. Overview of the crystal structure of FGFR2 kinase domain
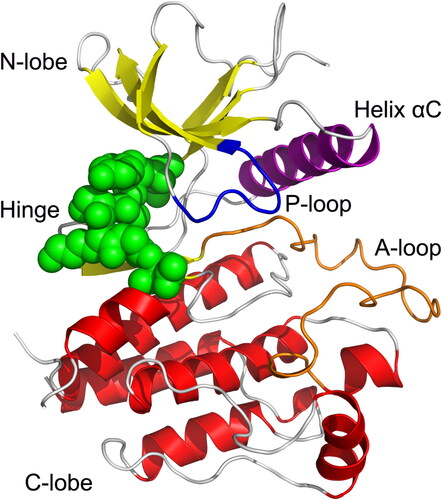
The kinase domain of FGFR2 consists of a smaller N-terminal lobe (N-lobe) and a larger C-terminal lobe (C-lobe), connected by a kinase hinge domain (). The N-lobe contains five-stranded anti-paralleled β-sheets adjacent to the catalytic helix αC. The phosphate-binding loop (P-loop) adopts a ‘U’ shape above the ATP-binding site. The C-lobe mainly includes seven α helices and two β strands. The activation loop (A-loop) runs along the FGFR2 surface located between the N- and C-lobes. The conserved ATP-binding site is located at the cleft between the N- and C-lobes occupied by small molecule inhibitors.
Figure 2. Overview of the crystal structure of FGFR2 kinase domain (PDB ID: 3RI1).
The α-helices, β-strands, and loops are colored red, yellow, and gray, respectively. The hinge domain is colored green spheres. The P-loop, helix αC, and A-loop are colored blue, purple, and orange, respectively.
3.2. Molecular docking studies
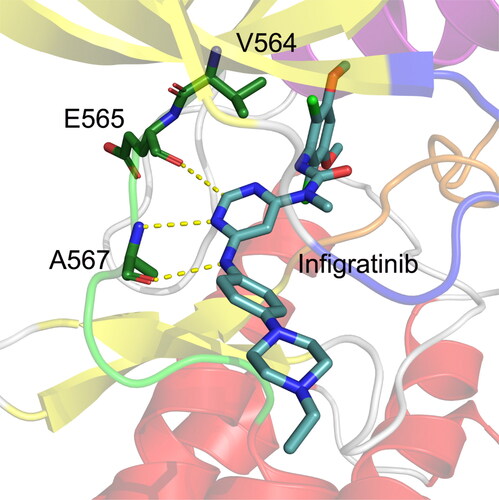
AutoDock 4.2 program was used to construct the protein − ligand interactions [Citation29]. Overall, 100 independent runs were performed, generating 100 different docked conformations of Infigratinib in the ATP-binding site of FGFR2. Then, cluster analysis was carried out to divide the 100 docked conformations of Infigratinib into subgroups according to 1.0 Å RMSD tolerance. This result revealed that Infigratinib largely adopted one preferred conformation (92%) in the ATP-binding site of FGFR2. The docked conformation with the lowest binding free energy of Infigratinib to the FGFR2 in the largest cluster was selected to analyze the potential interactions between FGFR2 and Infigratinib. As shown in , the phenylamine NH and the adjacent pyrimidine nitrogen of Infigratinib are involved in critical H-bonds with the carbonyl and the amino group of Ala567 located in the hinge domain, respectively. The pyrimidine C(2)-H forms a weak H-bond (C-H–-O) with the backbone carbonyl oxygen of Glu565 in the hinge region. In addition, the dichloro, dimethoxy phenyl ring of Infigratinib is in direct hydrophobic contacts with the gatekeeper residue Val564. The terminal 4-ethyl-piperazin moiety protrudes into the solvent. Next, we performed MD simulations to examine the impact of the gatekeeper mutation V564F on the stability and binding affinity of Infigratinib to the FGFR2 mutant [Citation30–32].
Figure 3. The docked conformation of the FGFR2 kinase domain with Infigratinib. The hinge residues Glu565 and Ala567 are Depicted by sticks. Hydrogen bonds are shown by yellow dotted lines.
3.3. Evaluation of the stability of the simulated systems
To probe the dynamics of FGFR2 kinase domain in complex with Infigratinib in solution, MD simulations of both the WT and V564F mutant were conducted in explicit water after modeling the missing residues. For both systems, three simulation runs of 1 µs were performed using the random velocities, leading to a combined total of 3 µs simulated for both the WT and V564F mutant.
The RMSD of the Cα atoms along the trajectories suggested that the simulations can be regarded as fully equilibrated after ∼200 ns for both systems (). Thus, the following analyses were conducted on the last 800 ns of each trajectory. The FGFR2 kinase domain in the WT and V564F mutant states behaved slightly different, but did not deviate from the crystal structure by more than 2.8 Å. Overall, the RMSD analyses revealed that although the WT and V564F mutant states exhibited a slightly different dynamic profile, both did not undergo large conformational changes or domain motions within the period of analysis and the differences between the WT and V564F mutant states were subtle.
Figure 4. RMSD values of the Cα atoms of the FGFR2 kinase domain (a) and the heavy atoms of Infigratinib (b) for the FGFR2-WT (a) and FGFR2-V564F (b) in the process of MD simulations.
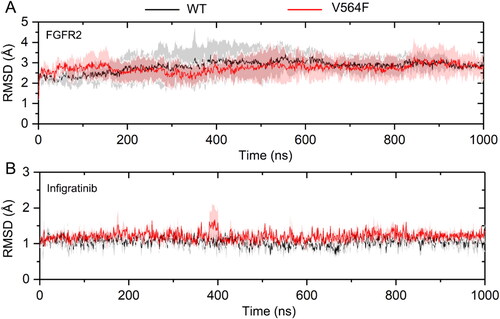
Next, the RMSD of the heavy atoms of Infigratinib was analyzed to monitor the dynamic stability of the Infigratinib in both the WT and V564F mutant states during MD simulations. The smaller the fluctuations of RMSD, the better the stability of the protein − ligand interactions. As shown in , the RMSD of the heavy atoms of Infigratinib in both systems quickly reached a steady state. The RMSD plot of Infigratinib in the V564F mutant (1.21 ± 0.18 Å) fluctuated more than the WT (1.04 ± 0.19 Å), indicating the unstable nature of the FGFR2 V564F mutant when it was bound to Infigratinib. The RMSD plots for Infigratinib in both the WT and V564F mutant states oscillated with small fluctuations (less than 0.2 Å). Taken together, the structural and energetic properties of the FGFR2 − Infigratinib complex were analyzed during the last 800 ns MD simulation trajectories.
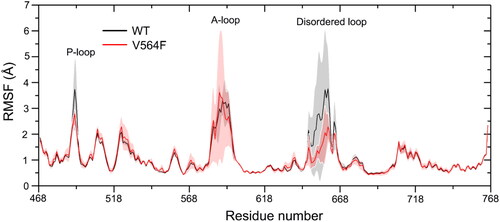
The root-mean-square fluctuation (RMSF) of the Cα atoms along the trajectories were further analyzed to reveal the effect of the V564F mutation on the local flexibility of the FGFR2 kinase domain. As shown in , the RMSF curves displayed only limited differences in the flexibility of the both WT and V564F mutant states, confirming the absence of major conformational changes over the course of the simulations. Overall, the great conformational flexibility was observed in the P-loop, A-loop, and the disordered loop in both systems.
Figure 5. The Cα RMSF of the FGFR2-WT and FGFR2-V564F mutant.
3.4. Correlated motions of the simulated systems
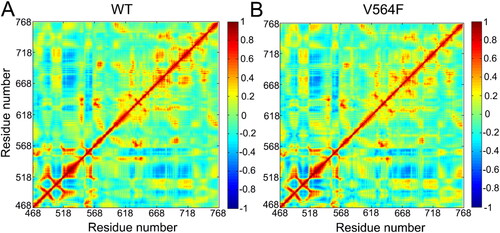
Dynamical cross-correlation map (DCCM) is a popular method to examine the conformational dynamics of proteins in two dimensions [Citation33–37]. As shown in , the cross-correlation coefficients (Cij) range from −1 to +1, relative to three color representations: red color indicated positive correlation values ranging from 0.4 to 1, blue color implied anti-correlation values ranging from −0.4 to −1, and light red and blue color suggested weak or no-correlation for values ranging from −0.4 to 0.4. The extent of correlation or anti-correlation corresponds to the respective color intensities. Overall, both the correlation and anti-correlation motions between residues were similar in both the WT and V564F mutant states, as revealed by the normalized matrix of correlated motions between residues obtained from covariance matrix of the Cα atoms of each residue (). This observation suggested that the V564F mutant did not affect the relative motions of different sub-domains of the FGFR2 kinase domain.
Figure 6. Correlations between the Cα atoms of the FGFR2-WT (a) and the FGFR2-V564F (b) mutant. Correlation values are represented by a color gradient of blue to red.
3.5. Binding free energies predicted by MM/GBSA
MM/GBSA binding free energy calculations were carried out to evaluate the energy property of Infigratinib when it was bound to the WT and V564F mutant. This approach has been widely used to study protein − ligand interactions and has offered useful information pertinent to the impact of mutations on the binding affinities of proteins to diverse ligands [Citation38–41]. In the present study, the binding free energy (ΔGbinding) from the decomposition for both systems were calculated to unravel the energy contributions in the protein − ligand complexes. As shown in , the calculated ΔGbinding for the WT and V564F mutant systems were −57.84 ± 6.08 and −49.57 ± 4.73 kcal/mol, respectively. As expected, the ΔGbinding for the WT was lower than that of the V564F mutant by 8.27 kcal/mol. Overall, the decreased electrostatic interactions (ΔEelec) led to the decrease of the binding free energy between FGFR2-V564F and Infigratinib (−12.56 ± 4.34 kcal/mol) compared to FGFR2-WT and Infigratinib (−20.80 ± 5.14 kcal/mol).
Table 1. Binding free energies of Infigratinib in FGFR2-WT and FGFR2-V564F (kcal/mol).
3.6. Key residues for the loss of binding affinity predicted by free energy decomposition and hydrogen bond analysis
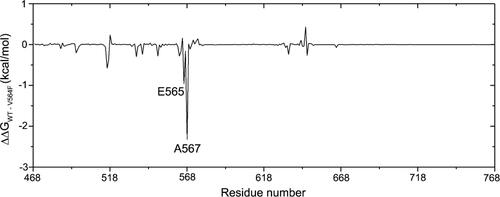
In-depth analysis of the resistant mechanism was performed to evaluate the energy contributions to the interactions of the complexes by means of decomposition of residue-ligand pairs based on the MM/GBSA method. Energy differences of per-residue between WT and V564F mutant systems (ΔΔG = ΔGWT − ΔGV564F) were plotted to uncover the critical residues. The negative values indicated that the residues in the FGFR2-WT formed stronger interactions with Infigratinib than those in the FGFR-V564F mutant. In contract, positive values indicated that the residues in the FGFR2-V564F mutant formed stronger interactions with Infigratinib than those in the FGFR-WT. As shown in , the residues of Glu565 and Ala567 displayed significantly stronger interactions with Infigratinib in the FGFR2-WT than in the FGFR2-V564F mutant. The differences between FGFR2-WT and FGFR2-V564F in other regions were quite small.
Figure 7. The energetic differences of the residue contributions to the binding free energies between the FGFR2-WT and FGFR2-V564F mutant systems (ΔΔG=ΔGWT − ΔGV564F).
Notably, the Glu565 and Ala567 located at the kinase hinge domain required to form hydrogen bonds with the Infigratinib. Thus, the two hydrogen bonds between the carbonyl and the amino group of Ala567 and Infigratinib were analyzed via cpptraj module in Amber [Citation42]. As listed in , in the FGFR2-WT, the phenylamine NH and the adjacent pyrimidine nitrogen of Infigratinib were involved in strong hydrogen bonds with the carbonyl and the amino group of Ala567, respectively. However, in the FGFR2-V564F mutant, these hydrogen bonds were weak as revealed by the decreased hydrogen bonding occupation time in the V564F mutant compared to the WT during MD simulations.
Table 2. Percent of occurrence data (%) for hydrogen bonds between Ala567 and Infigratinib.
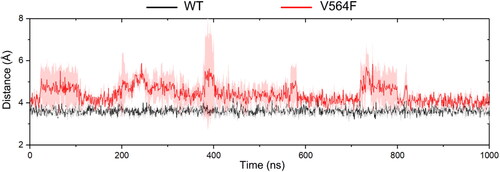
We then analyzed the weak hydrogen bond between the pyrimidine C(2)-H of Infigratinib and the backbone carbonyl oxygen of Glu565 in both systems. The distance between the pyrimidine C(2)-H of Infigratinib and the backbone carbonyl oxygen of Glu565 was monitored in the WT and V564F mutant states along the simulations. As shown in , in the WT, the pyrimidine C(2)-H of Infigratinib forms a weak hydrogen bond (C-H–-O) with the backbone carbonyl oxygen of Glu565 at a distance of ∼3.63 Å. However, binding of Infigratinib with FGFR2-V564F exhibited different phenomenon. The weak hydrogen bond between the pyrimidine C(2)-H of Infigratinib and the backbone carbonyl oxygen of Glu565 disappeared in the V564F mutant at a distance of ∼4.42 Å. Taken together, the hydrogen bonding networks for Infigratinib bound to FGFR2-V564F were less stable that the networks bound to FGFR2-WT, which was in consistence with the results of the energy analysis.
Figure 8. The distance (Å) between the pyrimidine C(2)-H of Infigratinib and the backbone carbonyl oxygen of Glu565 for the FGFR2-WT (a) and FGFR2-V564F (b) in the process of MD simulations.
3.7. Comparative binding modes
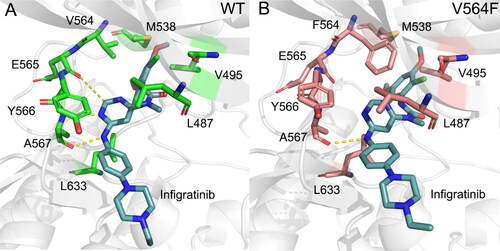
To explore the effect of V564F mutation on the conformational dynamics of Infigratinib in the ATP-binding site, we projected the free-energy landscape onto the two-dimensional space spanned by two distances; one was defined between the pyrimidine C(2)-H of Infigratinib and the backbone carbonyl oxygen of Glu565, and the other was defined between the Cα atom of the gatekeeper residue Val564 or the mutated residue Phe564 and the mass center of the dichloro, dimethoxy phenyl ring of Infigratinib. As shown in , the V564F mutant markedly sampled a distinct free-energy landscape from the WT, indicating that the V564F mutation disrupted the FGFR2 − Infigratinib interactions. To further characterize the dominant structures presenting the major basin for both systems, we performed cluster analysis on the structures extracted from these subbasins [Citation42–44]. As shown in , in the WT, the phenylamine NH and the adjacent pyrimidine nitrogen of Infigratinib forms two key hydrogen bonds with the carbonyl and the amino group of Ala567, respectively. The pyrimidine C(2)-H forms a weak H-bond with the backbone carbonyl oxygen of Glu565. Morover, the dichloro, dimethoxy phenyl ring of Infigratinib engages in hydrophobic contacts with the gatekeeper residue Val564, Val495, and Met538. The phenylamine and the pyrimidine moieties of Infigratinib forms hydrophobic contacts with Leu487, Tyr566, and Leu633. The terminal 4-ethyl-piperazin moiety protrudes into the solvent. In the FGFR2-V564F mutant (), owing to the V564F mutation that introduces a larger side chain, the steric conflict becomes appear between the side chain of Phe564 and the dichloro, dimethoxy phenyl ring of Infigratinib, leading to the movement of the dichloro, dimethoxy phenyl ring of Infigratinib in the ATP-binding site of the FGFR2-V564F mutant. This resulting movement results in the disruption of key hydrogen bonds between the Ala567, Glu565 in the hinge domain and Infigratinib, which weakens the binding affinity of Infigratinib to the FGFR2-V564F mutant and causes the emergence of drug resistance.
Figure 9. Free energy landscape for the FGFR2-WT (a) and FGFR2-V564F (b). the unit of the free energy landscape is kcal/mol.
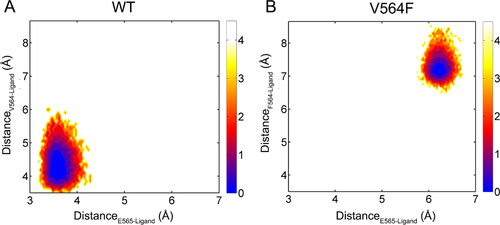
Figure 10. The Representative structures of FGFR2-WT (a) and FGFR2-V564F (b). hydrogen bonds are colored by yellow dotted lines and the key residues are shown by sticks.
4. Conclusions
In this study, computational approaches were performed to explore the Infigratinib resistance to the gatekeeper mutation V564F of FGFR2, both at the structural level and regarding the energy properties. MD simulation results demonstrated that the V564F mutation had a minor effect on the overall conformational dynamics of the FGFR2 kinase domain. Further binding free energy calculations revealed that the preferential Infigratinib binding to FGFR2-WT over FGFR2-V564F was affected by the electrostatic interactions. The decreased hydrogen bonding interactions between the key residues Ala567 and Glu565 at the kinase hinge domain and Infigratinib were responsible for the decreased binding affinity of Infigratinib to the FGFR2-V564F mutant, which may lead to the emergence of Infigratinib resistance to the FGFR2-V564F mutant. Overall, these results may provide useful information to the future design of novel potent inhibitors, which can be affected effectively to overcome the effect of V564F gatekeeper mutation.
Acknowledgements
The authors thank the Shanghai Supercomputer Center for providing computational resources.
Disclosure statement
No potential conflict of interest was reported by the author(s).
References
- Katoh M. Therapeutics targeting FGF signaling network in human diseases. Trends Pharmacol Sci. 2016;37(12):1–14. doi: 10.1016/j.tips.2016.10.003.
- Chen H, Ma J, Li W, et al. A molecular brake in the kinase hinge region regulates the activity of receptor tyrosine kinases. Mol Cell. 2007;27(5):717–730. doi: 10.1016/j.molcel.2007.06.028.
- Huang Z, Marsiglia WM, Basu Roy U, et al. Two FGF receptor kinase molecules act in concert to recruit and transphosphorylate phospholipase Cγ. Mol Cell. 2016;61(1):98–110. doi: 10.1016/j.molcel.2015.11.010.
- Li C, Dai Y, Kong X, et al. Structural optimization of fibroblast growth factor receptor inhibitors for treating solid tumors. J Med Chem. 2023;66(5):3226–3249. doi: 10.1021/acs.jmedchem.2c01507.
- Turner LD, Trinh CH, Hubball RA, et al. From fragment to lead: de novo design and development toward a selective FGFR2 inhibitor. J Med Chem. 2022;65(2):1481–1504. doi: 10.1021/acs.jmedchem.1c01163.
- Ryu S, Nam Y, Kim N, et al. Identification of pyridinyltriazine derivatives as potent panFGFR inhibitors against gatekeeper mutants for overcoming drug resistance. J Med Chem. 2022;65(8):6017–6038. doi: 10.1021/acs.jmedchem.1c01776.
- Guagnano V, Furet P, Spanka C, et al. Discovery of 3-(2,6-Dichloro-3,5-dimethoxy-phenyl)-1-{6-[4-(4-ethyl- piperazin-1-yl)-phenylamino]-pyrimidin-4-yl}-1-methyl-urea (NVP-BGJ398), a potent and selective inhibitor of the fibroblast growth factor receptor family of receptor tyrosine kinase. J Med Chem. 2011;54(20):7066–7083. doi: 10.1021/jm2006222.
- Roskoski R. Properties of FDA-approved small molecule protein kinase inhibitors: a 2022 update. Pharmacol Res. 2022;175:106037.
- Kang C. Infigratinib: first approval. Drugs. 2021;81(11):1355–1360. doi: 10.1007/s40265-021-01567-1.
- Nogova L, Sequist LV, Garcia JMP, et al. Evaluation of BGJ398, a fibroblast growth factor receptor 1-3 kinase inhibitor, in patientswith advanced solid tumors harboring genetic alterations in fibroblast growth factor receptors: results of a global phase I, dose-escalation and dose-expansion study. J Clin Oncol. 2017;35(2):157–165. doi: 10.1200/JCO.2016.67.2048.
- Silverman IM, Hollebecque A, Friboulet L, et al. Clinicogenomic analysis of FGFR2-rearranged cholangiocarcinoma identifies correlates of response and mechanisms of resistance to pemigatinib. Cancer Discov. 2021;11(2):326–339. doi: 10.1158/2159-8290.CD-20-0766.
- Goyal L, Saha SK, Liu LY, et al. Polyclonal secondary FGFR2 mutations drive acquired resistance to FGFR inhibition in patients with FGFR2 fusion-positive cholangiocarcinoma. Cancer Discov. 2017;7(3):252–263. doi: 10.1158/2159-8290.CD-16-1000.
- Eathiraj S, Palma R, Hirschi M, et al. A novel mode of protein kinase inhibition exploiting hydrophobic motifs of autoinhibited kinases: discovery of ATP-independent inhibitors of fibroblast growth factor receptor. J Biol Chem. 2011;286(23):20677–20687. doi: 10.1074/jbc.M110.213736.
- Pettersen EF, Goddard TD, Huang CC, et al. UCSF Chimera - A visualization system for exploratory research and analysis. J Comput Chem. 2004;25(13):1605–1612. doi: 10.1002/jcc.20084.
- Salomon-Ferrer R, Case DA, Walker RC. An overview of the Amber biomolecular simulation package. WIREs Comput Mol Sci. 2013;3(2):198–210. doi: 10.1002/wcms.1121.
- Bayly CI, Cieplak P, Cornell WD, et al. A Well-Behaved electrostatic potential based method using charge restraints for deriving atomic charges: the RESP model. J. Phys. Chem. 1993;97(40):10269–10280. doi: 10.1021/j100142a004.
- Maier JA, Martinez C, Kasavajhala K, et al. ff14SB: improving the accuracy of protein side chain and backbone parameters from ff99SB. J Chem Theory Comput. 2015;11(8):3696–3713. doi: 10.1021/acs.jctc.5b00255.
- Wang J, Wolf RM, Caldwell JW, et al. Development and testing of a general amber force field. J Comput Chem. 2004;25(9):1157–1174. doi: 10.1002/jcc.20035.
- Jorgensen WL, Chandrasekhar J, Madura JD, et al. Comparison of simple potential functions for simulating liquid water. J Chem Phys. 1983;79(2):926–935. doi: 10.1063/1.445869.
- Darden T, York D, Pedersen L. Particle mesh Ewald: an N.long(N)method for Ewald sums in large systems. J Chem Phys. 1993;98(12):10089–10092. doi: 10.1063/1.464397.
- Ryckaert J-P, Ciccotti G, Berendsen HJC. Numerical integration of the Cartesian equations of motion of a system with constraints: molecular dynamics of n-Alkanes. J Comput Phys. 1977;23(3):327–341. doi: 10.1016/0021-9991(77)90098-5.
- Wang E, Sun H, Wang J, et al. End-Point binding free energy calculation with MM/PBSA and MM/GBSA: strategies and applications in drug design. Chem Rev. 2019;119(16):9478–9508. doi: 10.1021/acs.chemrev.9b00055.
- Li M, Wang Y, Fan J, et al. Mechanistic insights into the long-range allosteric regulation of KRAS via neurofibromatosis type 1 (NF1) scaffold upon SPRED1 loading. J Mol Biol. 2022;434(17):167730. doi: 10.1016/j.jmb.2022.167730.
- Cao S, Jiang X, Tan C, et al. How does nintedanib overcome cancer drug-resistant mutation of RET protein-tyrosine kinase: insights from molecular dynamics simulations. J Mol Model. 2021;27(11):337. doi: 10.1007/s00894-021-04964-1.
- Zhang H, Chu G, Wang G, et al. Mechanistic understanding of the palmitoylation of go protein in the allosteric regulation of adhesion receptor GPR97. Pharmaceutics. 2022;14(9):1856. doi: 10.3390/pharmaceutics14091856.
- Qi X, Li G, Liu J, et al. Structural and energetic insights into the selective inhibition of PKMYT1 against WEE1. J Biomol Struct Dyn. 2023;:1–9. doi: 10.1080/07391102.2023.2225106.
- Li X, Wang C, Peng T, et al. Atomic-scale insights into allosteric inhibition and evolutional rescue mechanism of Streptococcus thermophilus Cas9 by the anti-CRISPR protein AcrIIA6. Comput Struct Biotechnol J. 2021;19:6108–6124. doi: 10.1016/j.csbj.2021.11.010.
- Lu S, Chen Y, Wei J, et al. Mechanism of allosteric activation of SIRT6 revealed by the action of rationally designed activators. Acta Pharm Sin B. 2021;11(5):1355–1361. doi: 10.1016/j.apsb.2020.09.010.
- Morris GM, Ruth H, Lindstrom W, et al. Software news and updates AutoDock4 and AutoDockTools4: automated docking with selective receptor flexibility. J Comput Chem. 2009;30(16):2785–2791. doi: 10.1002/jcc.21256.
- Ni D, Wei J, He X, et al. Discovery of cryptic allosteric sites using reversed allosteric communication by a combined computational and experimental strategy. Chem Sci. 2020;12(1):464–476. doi: 10.1039/d0sc05131d.
- Lu S, He X, Yang Z, et al. Activation pathway of a G protein-coupled receptor uncovers conformational intermediates as targets for allosteric drug design. Nat Commun. 2021;12(1):4721. doi: 10.1038/s41467-021-25020-9.
- Lu S, Ni D, Wang C, et al. Deactivation pathway of ras GTPase underlies conformational substates as targets for drug design. ACS Catal. 2019;9(8):7188–7196. doi: 10.1021/acscatal.9b02556.
- Wang Y, Ji D, Lei C, et al. Mechanistic insights into the effect of phosphorylation on RAS conformational dynamics and its interactions with cell signaling proteins. Comput Struct Biotechnol J. 2021;19:1184–1199. doi: 10.1016/j.csbj.2021.01.044.
- Qiu Y, Yin X, Li X, et al. Untangling dual-targeting therapeutic mechanism of epidermal growth factor receptor (EGFR) based on reversed allosteric communication. Pharmaceutics. 2021;13(5):747. doi: 10.3390/pharmaceutics13050747.
- Ji M, Chai Z, Chen J, et al. Insights into the allosteric effect of SENP1 Q597A mutation on the hydrolytic reaction of SUMO1 via an integrated computational study. Molecules. 2022;27(13):4149. doi: 10.3390/molecules27134149.
- Chen J, Zhang S, Wang W, et al. Mutation-induced impacts on the switch transformations of the GDP- and GTP-bound K-Ras: insights from multiple replica Gaussian accelerated molecular dynamics and free energy analysis. J Chem Inf Model. 2021;61(4):1954–1969. doi: 10.1021/acs.jcim.0c01470.
- Chen J, Zeng Q, Wang W, et al. Decoding the identification mechanism of an SAM-II riboswitch on ligands through multiple independent Gaussian-accelerated molecular dynamics simulations. J Chem Inf Model. 2022;62(23):6118–6132. doi: 10.1021/acs.jcim.2c00961.
- Shi Y, Cao S, Ni D, et al. The role of conformational dynamics and allostery in the control of distinct efficacies of agonists to the glucocorticoid receptor. Front Mol Biosci. 2022;9:933676. doi: 10.3389/fmolb.2022.933676.
- Zhuang H, Fan J, Li M, et al. Mechanistic insights into the clinical Y96D mutation with acquired resistance to AMG510 in the KRASG12C. Front Oncol. 2022;12:915512. doi: 10.3389/fonc.2022.915512.
- He X, Huang N, Qiu Y, et al. Conformational selection mechanism provides structural insights into the optimization of APC-Asef inhibitors. Molecules. 2021;26(4):962. doi: 10.3390/molecules26040962.
- Zhuang H, Ji D, Fan J, et al. Mechanistic insights into the protection effect of Argonaute-RNA complex on the HCV genome. Biomolecules. 2022;12(11):1631. doi: 10.3390/biom12111631.
- Roe DR, Cheatham TE. PTRAJ and CPPTRAJ: software for processing and analysis of molecular dynamics trajectory data. J Chem Theory Comput. 2013;9(7):3084–3095. doi: 10.1021/ct400341p.
- Hu MT, Ma WC, Wang JH, et al. Mechanistic insights into the allosteric mechanism of ZAP-70 induced by the hot spot W165C mutation. J Biomol Struct Dyn. 2023;:1–10. doi: 10.1080/07391102.2023.2240421.
- Zheng G, Xu S, Liu W, et al. Deciphering the resistance mechanism of RET kinase mutant against vandetenib and nintedanib using molecular dynamics simulations. J Exp Nanosci. 2021;16(1):278–293. doi: 10.1080/17458080.2021.1970141.