Abstract
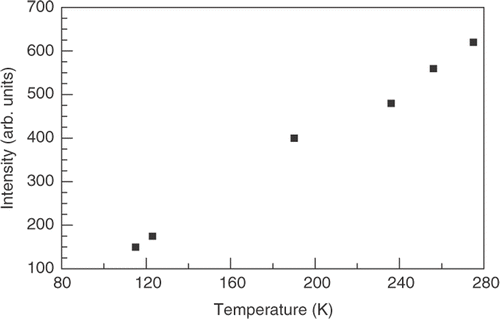
Nickel nanoparticles have been extensively characterised by atomic force microscopy (AFM), scanning electron microscopy (SEM) and confocal micro-Raman spectroscopy. AFM underestimates the particle size compared to SEM measurements. It is shown that Raman spectroscopy can detect the nanometre-thick NiO layer on the particles having frequency shifts of the modes indicative of phonon confinement. The magnetic properties of the particles are studied by ferromagnetic resonance (FMR) of magnetic field aligned particles. The alignment is achieved by suspending the particles in the liquid crystal MBBA and freezing the liquid in a 0.4 T DC magnetic field. The in-field solidification locks the direction of maximum magnetisation of the particles parallel to the direction of the applied DC magnetic field. This removes the effects of dynamical particle fluctuations of the nanoparticles on the magnetic properties allowing a study of the intrinsic magnetic properties of the magnetic nanoparticles. The intensity of the FMR signal decreased with lowering temperature for the particles frozen in the liquid in a 0.4 T DC magnetic field. The effect is suggested to be due to a reduction of the microwave skin depth with lowering temperature.
1. Introduction
The search for higher density magnetic storage devices based on magnetic nanostructures has stimulated considerable research on the magnetic properties of ferromagnetic and antiferromagnetic nanoparticles. Crucial to the applications is knowing the intrinsic magnetic properties of the nanoparticles. Generally the magnetic properties of the nanoparticles are dominated by the dynamical behaviour of the particles which causes differences in the temperature dependence of the magnetisation between magnetic field cooled (FC) samples and zero field cooled (ZFC) samples Citation1, Citation2. When a powder of magnetic nanoparticles is cooled to low temperature in a DC magnetic field the magnetic moment of the nanoparticles aligns with the direction of the cooling field. A measurement of the magnetisation of the field-cooled powder in a DC magnetic field as a function of increasing temperature shows a gradual decrease of the magnetisation and a more pronounced decrease above the blocking temperature (T B) where the particle orientation begins to fluctuate. A good example of this behaviour is presented in the work of Vestal and Zhang Citation2 on ferrite nanoparticles such as CoFe2O4 where it is shown that below T B the dependence of the magnetisation on increasing temperature is different for the ZFC and FC material. Above T B the magnetisation decreases with increasing temperature and is the same for both the ZFC and FC material.
In previous work it has been shown that magnetic nanoparticles can be aligned by suspending the particles in viscous liquids and cooling the liquid below the freezing point in a DC magnetic field Citation3. The field aligns the nanoparticles in the direction of maximum magnetisation while in the liquid phase and the solidification locks in this direction so it is possible to study the angular dependence of the ferromagnetic resonance signal with respect to the direction of maximum magnetisation below the freezing point of the liquid. More importantly it removes the effect of dynamical fluctuations on the magnetic properties that occur in powders allowing a study of the intrinsic magnetic properties of the particles. In this work we report the orientation and temperature dependence of the ferromagnetic resonance (FMR) spectrum of Ni nanoparticles suspended in the liquid crystal N-(p-methoxybenzylidene)-p-butylaniline (MBBA) and cooled below the freezing point (297 K) in a DC magnetic field. This material was chosen because of its relatively high freezing temperature of 297 K providing a wide range of temperatures to study the effects in the oriented nanoparticles. The Ni nanoparticles are superparamagnetic, meaning the magnetisation versus magnetic field does not display hysteresis because they are monodomain. The Ni is ferromagnetic and NiO which forms a layer on the surfaces of the particles is antiferromagnetic. The intensity of the ferromagnetic resonance spectrum is observed to increase as the temperature is raised to room temperature for the aligned particles in the frozen liquid crystal. The effect is attributed to an increase in the skin depth with increasing temperature and the fact that the skin depth is smaller than the average particle size. Before the ferromagnetic measurements were made the particles were subjected to characterisation by atomic force microscopy (AFM), scanning electron microscopy (SEM) and confocal micro-Raman spectroscopy.
2. Experimental
The ferromagnetic resonance (FMR) measurements were made using a Varian E-9 spectrometer operating at 9.2 GHz. with 100 kHz. modulation. The temperature of the sample was controlled by flowing cold nitrogen or helium gas through a double-walled quartz tube which is part of an ADP Heli-Tran system, and which is inserted through the centre of the microwave cavity. The sample was contained in the quartz tube and located at the centre of the cavity.
The nickel nanoparticles were obtained from the Aldrich chemical company. The particles were examined by AFM using a Digital Instruments Nanoscope. This was done by suspending the particles in distilled water and applying ultrasonication. A droplet of the sonicated suspension was deposited on mica and evaporated leaving a residue of nanoparticles on the mica. The AFM scans were then made on the mica. The Image Pro Plus software from Media Cybernetics was used to determine the particle size distribution from both the AFM and SEM images. Raman measurements of the particles were made using a JY Horiba confocal Raman spectrometer employing a helium–neon laser having 632 nm wavelength. SEM images were obtained using a LEO 1530 VP field emission scanning electron microscope. Before analysis the particles were coated with carbon using a BAL-TECMED 020H sputtering coater. The particles were suspended in the liquid crystal N-(p-methoxybenzylidene)-p-butylaniline (MBBA) which is in the liquid phase above 297 K. The suspension contained in a quartz glass holder in the centre of the microwave cavity was then cooled below the solidification temperature of the MBBA in 0.4 T magnetic field. The field aligns the nanoparticles in the direction of maximum magnetisation while in the liquid phase and the solidification locks in this direction. This means that the blocking temperature is above 297 K which is consistent with the size of the particles being 109 nm as discussed below. It also makes it possible to measure the angular dependence of the ferromagnetic resonance signal with respect to the direction of maximum magnetisation below the freezing point of the liquid. It also removes the effect of dynamical behaviour of the particles on the magnetic properties allowing a measurement of the intrinsic magnetic properties of the particles. It should be mentioned that the magnetic attraction between the particles likely means that there is some aggregation of the particles in the frozen liquid crystal.
3. Results
3.1. Characterisation
is a typical AFM image of the nickel nanoparticles on the mica showing an aggregation of particles of various sizes resulting from the magnetic attraction of the particles. The insert in the figure shows the distribution of particle sizes obtained from analysis of the AFM image. The average particle size obtained from AFM is 67 nm.
Figure 1. Atomic force microscope image of nickel nanoparticles on which measurements were made. The width of the image is 1.00 µm. Distribution of particle sizes obtained from analysis of AFM images is shown in the insert.
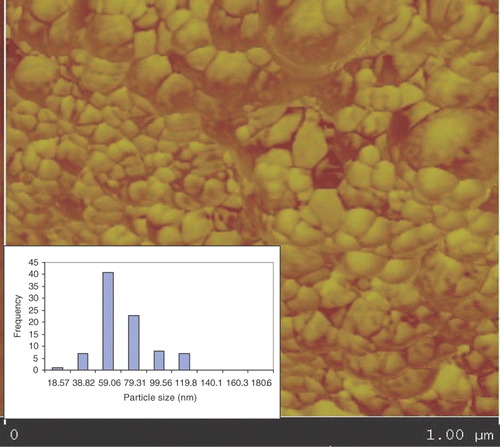
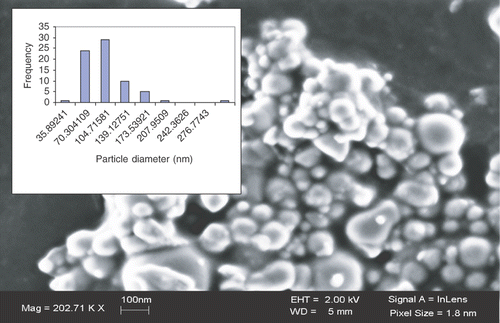
is a representative SEM image of the particles. The insert in the figure shows the distribution of particle sizes obtained from the SEM image. The average particle size obtained from the SEM data is 109 nm. Thus there is a discrepancy between the particle size determined by AFM and SEM. The AFM method shows an average particle size about 38% smaller than that determined by SEM. It is likely that the difficulty is with AFM. Indeed other workers have found that for magnetic particles less than 500 nm the AFM measurement underestimates the particle size by about 30% Citation4. The particle size in AFM is obtained from the peak-to-valley difference in the vertical movement of the tip. For a dense aggregation of nanoparticles, as shown in resulting from the magnetic attraction of the particles, the separation of the particles may be smaller than the tip width. This means the tip will not get down to the base of the particles and a smaller particle size will be imaged.
Figure 2. SEM image of Ni nanoparticles. The distribution of particle sizes obtained from analysis of SEM images is shown in the insert.
Recently it has been shown that it is possible to detect the oxide layer on metal nanoparticles allowing the possibility of estimating its thickness using confocal micro-Raman spectroscopy Citation5. The Raman lines are asymmetrically broadened and shifted to lower frequencies due to phonon confinement. Phonon confinement was first observed by Raman spectroscopy in the optical mode of silicon nanoparticles Citation6. Subsequently theoretical models have been developed relating the frequency shifts and line widths to particle size Citation7, Citation8. compares the Raman spectra obtained from the Ni nanoparticles and that obtained from bulk NiO. The spectrum of the NiO layer on the nanoparticles occurs at higher frequency compared with that from bulk NiO. The unit cell of the antiferromagnetic phase of NiO is rhombohedral Citation9, Citation10. The broad Raman line at 494 cm−1 in bulk NiO can be associated with the transverse optical mode of NiO at K = 0 Citation11. The Raman line from the Ni nanoparticles arises from the NiO layer on the particles. High-resolution transmission electron microscopy (HRTEM) indicates the oxide layer is about 3 nm thick and relatively independent of particle size Citation12. The Raman spectra from the oxide layer should display phonon confinement effects as observed in the Cu, In and Zn nanoparticles Citation5. It is seen in that the frequency of the TO mode in the oxide layer is shifted up compared to the bulk material. Raman spectroscopy measures the frequency at the centre of the Brillioun zone, K = 0. It has been shown that when phonon confinement occurs non-zero values of K can contribute to the Raman line Citation7, Citation8. In the case of silicon K = 0 is a maximum in the phonon dispersion relationship of the LO mode and the frequency decreases as K increases Citation6. This means that when phonon confinement occurs the frequency of the mode decreases. The dispersion relationship for the TO mode of NiO indicates that K = 0 is a minimum point which means that phonon confinement should result in an increase in frequency Citation13. Thus a possible explanation of the upward shift of the frequency in NiO layer on the Ni nanoparticles is that it is a result of phonon confinement.
Figure 3. Raman spectrum obtained from Ni nanoparticles showing the line from Ni–O at 530 cm−1 from the NiO oxide layer on the surface of the particle at higher frequency and the spectrum in bulk NiO at lower frequency.
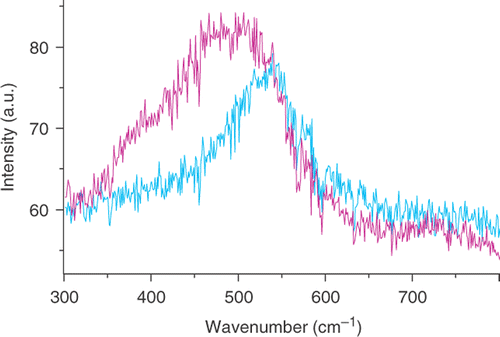
However there is another possible explanation. It has been shown that the frequency of the TO mode in NiO can depend on oxygen content where the frequency is lower in the oxidised state Citation14. Thus the difference in the frequency of the mode in bulk NiO and the NiO oxide layer may be a result of difference in oxygen content and/or phonon confinement. Further work is needed to resolve this issue such as a measurement of the oxygen content in bulk NiO and the 3 nm layer of NiO on the particle surface.
3.2. Magnetic properties
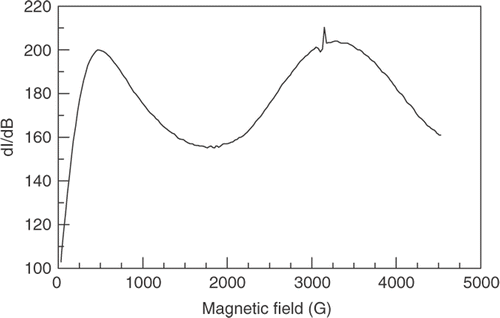
shows the FMR spectrum recorded at 104 K for the magnetic field parallel to the direction of the cooling field. The spectrum consists of two lines, a very low-field derivative signal centred at zero magnetic field and a higher field FMR signal. The presence of the low-field non-resonant absorption signal is a well-established indication of ferromagnetism in materials Citation15, Citation16. The signal occurs because the permeability in the ferromagnetic state depends on the applied magnetic field increasing at low fields to a maximum and then decreasing. Since the surface resistance depends on the square root of the permeability, the microwave absorption depends non-linearly on the strength of the DC magnetic field resulting in a non-resonant derivative signal centred at zero field. This signal is not present in the paramagnetic state and emerges as the temperature is lowered below the Curie temperature, T c. shows a plot of the field at the centre of the high-field ferromagnetic resonance signal versus the angle of the DC magnetic field with respect to the direction of the cooling field at 104 K. This data allows a determination of the g value of the FMR spectrum.
Figure 4. Ferromagnetic resonance spectrum of Ni nanoparticles suspended in the liquid crystal MBBA and cooled below the freezing point of the liquid in a 0.4 T magnetic field for directions parallel to the cooling field at 104 K.
In order to interpret the ferromagnetic resonance data the particles will be assumed to have axial magnetisation symmetry. For a particle having axial symmetry, the dependence of the field position of the FMR signal on the angle with respect to the axis of maximum magnetisation is given by Citation17
Figure 5. Dependence of the field position of the centre ferromagnetic resonance, H r, on the orientation of the DC magnetic field with respect to the direction of the cooling field at 104 K. The units of magnetic field are gauss.
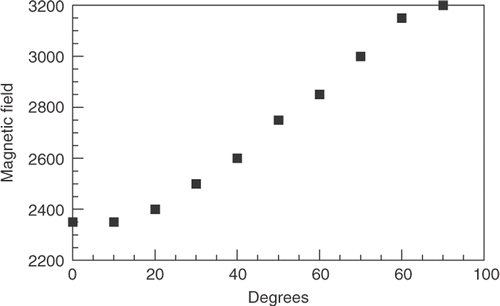
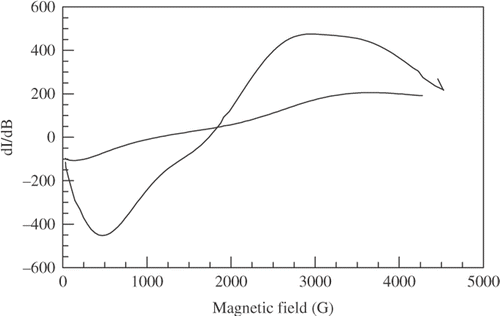
Figure 6. Ferromagnetic resonance spectra for H parallel to the cooling field at 275 K and 115 K (smaller spectrum) showing a marked reduction in intensity as temperature is lowered.
4. Discussion
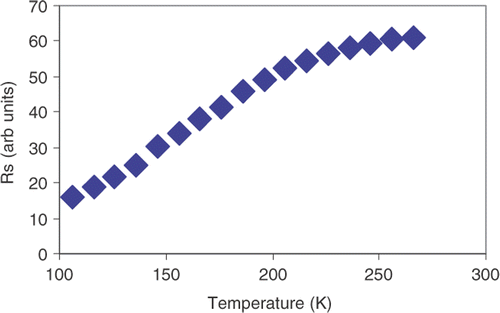
An increase in the intensity of the FMR signal has been observed with increasing temperature for the particles frozen and oriented in the liquid crystal. A possible explanation involves dynamical fluctuations of the particles with the increase in magnetisation with increasing temperature resulting from the fact that between 100 and 575 K the particles on the average are below the blocking temperature as discussed in the introduction. However, dynamical fluctuations of the nanoparticles can be ruled out because the increase in the magnetisation with increasing temperature is observed for the particles locked in orientation in the frozen liquid crystal where fluctuations are not possible. Examination of the dependence of the FMR spectra on the angle of the DC field with respect to the direction of the cooling field at a number of temperatures below the freezing point of the liquid, shows that there are no changes in the orientation. The particles at all temperatures below the freezing points of the liquid crystal remain aligned such that the direction of maximum magnetisation is in the direction of the cooling field. It is concluded that the observed increase in the FMR signal intensity between 100 and 300 K is intrinsic to the nanoparticles and not associated with dynamical fluctuations of the particles, because it is observed in the frozen liquid crystal where fluctuations are not possible. , which shows a decrease in the surface resistance with lowering temperature, suggests a possible explanation for the reduction in intensity of the FMR signal with lowering temperature. The surface resistance is proportional to 1/(σ)1/2 where σ is the conductivity. As the temperature is lowered σ increases and the surface resistance decreases. The skin depth which measures the depth of penetration of the microwaves into the material is also proportional to 1/(σ)1/2 having the specific form
5. Conclusion
Nickel nanoparticles have been characterised by AFM, SEM and Raman spectroscopy. It is shown that the AFM underestimates the size of the metal nanoparticles compared to SEM measurements and may not be a reliable method for measuring particle size of magnetic nanoparticles. However this issue needs further study. It is also shown that confocal micro-Raman spectroscopy can observe the oxide layers on metal nanoparticles and that the frequency of the mode shifts up in the 3 nm NiO layer due to phonon confinement effects. The magnetic properties of the Ni particles suspended in MBBA and frozen in the presence of a DC magnetic field have been studied. This locks the direction of maximum magnetisation parallel to the direction of the cooling field allowing anisotropic FMR measurements to be made. It also removes the effects of particle dynamics on the measurements enabling measurements of intrinsic magnetic behaviour of the particles. The unusual decrease in the intensity of the FMR signal with lowering temperature is suggested to be a result of the temperature-dependent decrease of the skin depth and the fact that it is smaller than the average particle size.
Acknowledgement
The authors are grateful to B. Reddingius of ARDEC for the AFM images.
References
- Kim , DK . 2001 . Characterization of surfactant-coated superparamagnetic monodispersed iron oxide nanoparticles . J. Mag. Mag. Mat. , 225 : 30
- Vestal , CR and John Zang , Z . 2004 . Magnetic spinel ferrite nanoparticles from microemulsions . Int. J. Nanotech. , 1 : 240
- Owens , FJ . 2003 . Ferromagnetic resonance of magnetic field oriented Fe3O4 nanoparticles in frozen ferrofluids . J. Phys. Chem. Solids , 64 : 2289
- Lacava , LM . 2001 . Nanoparticle sizing: a comparative study using atomic force microscopy, transmission electron microscopy and ferromagnetic resonance . J. Mag. Mag. Mat. , 225 : 79
- Owens , FJ and Reddingius , B . 2005 . Confocal micro-Raman Observation of nanometer thick oxide layers on metal nanoparticles . J. Nanosci. Nanotech. , 5 : 836
- Iqbal , Z and Veprek , S . 1982 . Raman scattering from hydrogenated microcrystalline and amorphous silicon . J. Phys. C , 15 : 277
- Cambell , FH and Fauchet , PM . 1986 . The effects of microcrystal size and shape on the one phonon Raman spectra of crystalline semiconductors . Solid State Commun. , 58 : 739
- Richter , H , Wang , ZP and Ley , L . 1981 . The one phonon Raman spectrum in microcrystalline silicon . Solid State Commun. , 39 : 626
- Toussaint , CJ . 1971 . A high-temperature X-ray diffraction study of the NiO-Li2O system . J. Appl. Cryst. , 4 : 293
- Rooksby , HP . 1948 . A note on the structure of nickel oxide at subnormal and elevated temperatures . Acta. Cryst. , 1 : 226
- Reichardt , W , Wagner , W and Kress , W . 1975 . Lattice dynamics of NiO . J. Phys C , 8 : 3955
- Rellinghaus , B . 2001 . The effect of oxidation on the structure of nickel oxide nanoparticles . Eur. Phys. J. D , 16 : 249
- Tubino , R , Piseri , L and Zerpi , G . 1972 . Lattice dynamics and spectroscopic properties by valence force potential of diamond-like crystals of:C, Si, Ge and Sn . J. Chem. Phys. , 56 : 1022
- Delichere , P . 1988 . Electrochromism in nickel oxide films studied by OMA and Raman spectroscopy . J. Electrochem. Soc. , 135 : 1856
- Sastry , MD . 1990 . Low field microwave absorption in Gd2CuO4 . Physica C , 170 : 41
- Owens , FJ . 2001 . Resonant and non resonant microwave absorption study of ferromagnetic transition in RuSr2Gd0.5 Eu0.5Cu2O8 . Physica C , 353 : 265
- de Biasi , RS and Devezas , TC . 1978 . Anisotropy field of small magnetic particles as measured by resonance . J. Appl. Phys. , 49 : 2466
