
Abstract
Assessing comfort of running footwear reliably is challenging. The purpose of this study was to compare the intra-rater reliability between different assessment types, to calculate intra-individual reliability scores and to evaluate the effect of rater selection based on individual reliability scores on group level reliability. Three assessment types: ranking, Visual Analogue Scale (VAS), and Likert Scale (LS) were provided twice in six separate sessions among 30 participants, who assessed comfort of five shoes after treadmill running. Spearman's rho provided an evaluation of inter-session relative reliability and typical error as a measure of absolute reliability for each assessment type. Ranking (r = 0.70, 95% confidence interval [CI] 0.61–0.78) yielded the highest relative reliability for overall comfort, followed by VAS (r = 0.67, 95% CI 0.56–0.75) and LS (r = 0.63, 95% CI 0.52–0.72), with large-scale overlaps of CIs between assessment types. The same order of assessment types was found for the percentage of reliable raters (r ≥ 0.7) with 60% in ranking scale, 47% in VAS and 37% in LS. Forming subgroups corresponding to the intra-individual reliability substantially increased group level reliabilities. Based on measures of relative reliability, an extreme reduction in resolution as provided by the ranking from pairwise comparisons seems to be a valuable tool in footwear comfort assessments if assessment time is of minor importance. No preference can be provided for the two investigated rating scales. Besides the assessment type, a selection of the best raters in additional reliability checks seems to be a prerequisite for further comfort-related studies.
Keywords:
Highlights
Reliability of comfort assessments is participant-specific and in interaction with the provided assessment type.
Ranking scale provides higher relative reliability compared to rating scales.
Comfort related research requires reliability analyses prior to investigation of comfort effects.
Introduction
Comfort has been defined as a contented well-being, enjoyable experience (Comfort, Citationn.d.-a) and a state of physical ease (Comfort, Citationn.d.-b). A more extensive description suitable for comfort in sports and research has been given by Slater (Citation1985) defining comfort as “a pleasant state of physiological, psychological, and physical harmony between a human being and the environment”.
In footwear research Nigg (Citation2010) and Reinschmidt and Nigg (Citation2000) described comfort as an important factor in footwear design and selection and described a paradigm called comfort filter (Nigg, Baltich, Hoerzer, & Enders, Citation2015). According to this paradigm, comfort-orientated selection of running shoes is made by individual filtering based on comfort perception. This decision process potentially leads to a reduction of injury risk (Mündermann, Stefanyshyn, & Nigg, Citation2001) and enhanced running economy (Luo, Stergiou, Worobets, Nigg, & Stefanyshyn, Citation2009). Studies on improving foot-bed shape (Witana, Goonetilleke, Au, Xiong, & Lu, Citation2009) and simulations to evaluate the potential contributors to reduced comfort (Rupérez, Monserrat, Alemany, Juan, & Alcañíz, Citation2010) have emphasized the importance of comfort in marketing and sales.
The quantification of comfort perception remains a challenge in studying effects of comfort (Hoerzer, Trudeau, Edwards, & Nigg, Citation2016; Mills, Blanch, & Vicenzino, Citation2010). Anthropometrics (e.g. skeletal alignment) and foot sensitivity have been identified as potential influences for variation in perception among individuals (Miller, Nigg, Liu, Stefanyshyn, & Nurse, Citation2000; Mündermann et al., Citation2001) as well as the current psychological state (Zhang, Helander, & Drury, Citation1996), which can alter comfort perception over time. However, research examining the effects of footwear comfort on parameters of human movement is only worth pursuing if comfort measurements are repeatable and therefore reliable.
Intra-rater inter-session reliability refers to the measurement of variation in footwear comfort taken by a single person under the same conditions from one testing session to the next (Hoerzer et al., Citation2016; Mills et al., Citation2010). Thus, high reliability (i.e. minimal error in measurement) is essential for investigating the general importance of comfort in footwear research, development and sales. The measurement error is composed of systematic bias and random error, which can be analysed in terms of absolute reliability (e.g. typical error) and relative reliability (e.g. correlation; Atkinson & Nevill, Citation1998; Batterham & George, Citation2003).
The measurement error and therefore the reliability of comfort assessments can be affected by (i) the assessment type (measurement tool) and (ii) the intra-individual reliability (Hoerzer et al., Citation2016; Mills et al., Citation2010) as well as the conditions provided within a study.
The assessment types can be divided into rating and ranking scales (Mills et al., Citation2010) and widely used rating scales include the Visual Analogue Scale (VAS), the Likert Scale (LS) and Yes-No questions (y/n), while ranking can be performed by simple sequencing or variations of pairwise comparisons (Lin & Chiu, Citation2016; Mills et al., Citation2010).
As comfort and preference perceptions are anchored to past experiences and the range of stimuli to be rated (Mündermann, Nigg, Stefanyshyn, & Humble, Citation2002), it seems plausible that a recurring neutral condition could provide a suitable neutralization stimulus in an experimental protocol. Mündermann et al. (Citation2002) concluded that VAS can be a reliable tool to measure footwear comfort (r = 0.79) with the addition of a neutral condition to the study protocol.
For comparison of different assessment types, Mills et al. (Citation2010) investigated absolute inter-session reliability (calculated by inter-session differences) within assessments of inserts in the participants’ own running shoes. This comparison included a ranking using simple sequencing, VAS and LS. Based on the findings of their study, a ranking scale was recommended, followed by VAS yielding higher reliability than LS (Mills et al., Citation2010). Potential weaknesses of this study for evaluating absolute reliability were the comparison of assessment types across different groups of participants and different statistical tests (ANOVA, mixed linear model) among assessment types.
The evaluation of intra-individual reliability requires participant-specific reliability analyses. Hoerzer et al. (Citation2016) investigated the influence of complexity of assessment type (VAS versus y/n) on intra-individual reliability. An arbitrarily-chosen cut-off criteria of r = 0.70 resulted in 31% of the participants for VAS and 47% for y/n being classified as reliable raters. Based on these results, it was concluded that (1) a minority of raters reached a sufficiently high level of reliability and (2) reductions in complexity could improve the rater reliability (although still the majority of subjects could not assess comfort reliably). A possible suggestion for further studies was therefore to reduce complexity of measure and evaluate individual reliability so that preselection of reliable participants within a study could be achieved.
The research to date presents divergent result with regard to reliabilities of various assessment types. While a reduced resolution is considered as a beneficial feature of assessment types (Hoerzer et al., Citation2016), Mills et al. (Citation2010) showed that the high-scale resolution of VAS did not reduce the performance in group-level assessment stability compared to LS. With respect to intra-individual reliability in footwear comfort assessments during running, one study to date (Hoerzer et al., Citation2016) showed a potential influence of assessment type. Consequently, a combination of the approaches by Mills et al. (Citation2010) and Hoerzer et al. (Citation2016) should provide deeper insight into the reliability of comfort assessments, especially by performing different analyses on the same cohort. Therefore, the specific aims of this study were (i) to assess the inter-session relative and absolute reliability of different assessment types (in the same group of participants), (ii) to calculate intra-individual reliabilities and (iii) to evaluate the effect of a rater selection based on intra-individual reliabilities on the inter-session relative reliability of different assessment types.
Methods
Participants
Thirty physically active participants were recruited for this study (age = 30 ± 10 years [minimum age = 20 years, maximum age = 50 years], height = 176 ± 7 cm, mass = 71 ± 11 kg). The sample represents recreational runners as typical customers of running footwear companies. Exclusion criteria were set for injuries of the lower extremities and musculoskeletal or cardiovascular diseases. The study was approved by the Institutional Ethics Committee and all individuals provided written, informed consent prior to participation.
Footwear conditions and test situation
For all testing sessions (see protocol), six footwear conditions were provided (five test shoes and the individual's own running shoe as neutral prior condition). A set of different shoes was assumed to differ in comfort ratings referring to the findings of Hoerzer et al. (Citation2016), Mills et al. (Citation2010) and the paradigm of the comfort filter (Nigg et al., Citation2015). The test shoes (common running footwear) were selected based on varying material and mechanical characteristics () with the following maximum differences: 80 g (weight), 3.7 mm (heel lift), 87 N/mm (forefoot cushioning), 145 N/mm (rearfoot cushioning), 0.2 Nm/° (forefoot bending) and 0.4 Nm/° (midfoot bending). A treadmill (Pulsar It 3p, h/p/cosmos sports & medical Ltd., Nussdorf-Traunstein, Germany) provided a standardized running environment, exposing the participants to their self-selected running speed determined during a priming session. The individuals’ running speed (9.8 ± 0.5 km/h, minimum speed = 9 km/h, maximum speed = 11 km/h) was constant for all footwear conditions and testing sessions.
Table I. Mechanical characteristics of the five test shoes provided in each of the three scales
Assessment types and items
In total, three different assessment types were provided (two rating scales and one ranking scale).
Rating scales were provided by a 100 mm VAS and a 7-point LS spread across 100 mm for optical alignment to VAS. The respective questionnaires consisted of nine items each (one global item: “overall comfort”; eight sub-items: “comfort of heel cushioning”, “comfort of forefoot cushioning”, “comfort of medio-lateral stability”, “comfort of arch”, “comfort of shoe stiffness”, “comfort of fit”, “overall discomfort”, “discomfort of fit”) with anchor points corresponding to “not comfortable at all” (left end) and “maximal comfortable” (right end) both in LS and VAS. The number of items was based on common comfort assessments in footwear development since no gold standard is given in comfort assessments and the tools on quantification of comfort as a subjective construct have to be evaluated particularly in terms of reliability (Pearson, Citation2009). Specific instructions were given according to Mündermann et al. (Citation2002) with additional explanations of shoe stiffness (freedom of movement) and fit (width in the heel and forefoot region and height in the midfoot region). Prolonged running can induce a perception of discomfort, as this sensation is time-dependent (Zhang et al., Citation1996). Therefore, discomfort was added as an independent item to the questionnaire.
The ranking was compiled from pairwise comparisons of the test shoes on the global item “overall comfort”. Each of the test shoes was compared to all other test shoes, resulting in 10 pairwise comparisons. Due to logistical reasons (time of assessments in ranking), the eight sub-items were excluded.
Protocol and data acquisition
A priming session was conducted for each participant prior to the first experimental session to provide novelty of assessment type only within the experiment (Mills et al., Citation2010). Within this priming session, the participants were exposed to each of the test shoes and allowed to familiarize to the study environment. During the course of the experiment the participants performed six sessions within six weeks, typically one session per week. Only one of the three assessment types (LS, VAS and ranking) was provided per session, the order of which was randomized. The respective scale was presented again in the subsequent session for assessing the inter-session reliability. During both the priming and the testing sessions, participants were blinded to the shoes by a folded sleeping mask, preventing a rating of aesthetics and design of the shoes.
Each experimental session started with a 2–5 min warm-up on the treadmill at a self-selected speed for the testing, determined during the familiarization session. Following the warm-up, a comfort assessment questionnaire, containing the nine items of comfort and discomfort, was presented to the participants before starting the protocol of rating scales. The study protocol derived from Mündermann et al. (Citation2002) included a control condition as neutralization stimulus prior to all assessments of test shoes, N corresponding to the neutral condition (own running shoe) and Ti corresponding to the test shoes (N-T1-N-T2-N-T3-N-T4-N-T5). Ratings were asked for the test conditions, but not for the neutral condition.
Within the two ranking sessions, the five test shoes were provided in 10 randomized pairwise comparisons. No neutral condition was provided within the ranking scale. Preference or equality of overall comfort between two conditions had to be given. Points per condition were assigned corresponding to preference (1 for the preferred shoe, 0 for the non-preferred shoe or 0.5 for both if the shoes were considered equal in overall comfort). Comfort assessments for each test condition within all assessment types were given after a two minute run on the treadmill.
Statistical analyses
Statistical analyses were performed separately for the three assessment types (VAS, LS and ranking) and each of the respective items considering the two testing days per assessment type. The statistical analysis included the following steps:
(1) For comparison of assessment types on the overall group level, systematic bias and random error were analysed. Systematic bias was calculated by a sign test for each item and assessment type. Within random error, the typical error (e, Hopkins, Citation2000) served as a measure of absolute reliability and Spearman's rho served as a measure of relative reliability (Atkinson & Nevill, Citation1998). In addition, the intra-class coefficient of correlation (ICC) was calculated for relative reliability of rating scales, allowing for comparison to previous studies. LS was treated as interval scaled, as anchor points were given on the left and right end only. The Ranking scale did not meet the requirements for ICC calculation. Ninety-five per cent confidence intervals (CIs) were provided for relative reliability in group level analyses.
(2) Intra-individual relative reliability coefficients (Spearman's rho) were calculated from the test shoes similar to the procedure of Hoerzer et al. (Citation2016). This analysis was conducted separately for each assessment type in the two respective testing sessions on the item “overall comfort”. Based on the “reliable rater” cut-off criteria (r ≥ 0.7) introduced by Hoerzer et al. (Citation2016), which corresponds to a very large correlation according to Hopkins (Citation2002), the percentage of reliable raters was determined for each assessment type.
(3) For evaluating the influence of the rater selection on relative reliability of different assessment types the individual relative reliability scores (r) based on the ratings of “overall comfort” were subsequently used to build two subgroups within each of the assessment types: Top third, representing the 10 participants with the highest score and top two-thirds, representing the 20 participants with the highest score. For those two subgroups the same comparison of assessment types as described in step (1) for the overall group was performed to evaluate relative reliability by Spearman's rho.
Results
Systematic bias in overall comfort ratings was found for LS with an average increase in rating of 0.3 points within the second LS testing session (p = 0.01). No general trend was found for VAS and ranking. Group analysis of relative reliability in overall comfort ratings revealed a maximum of r = 0.70 (95% CI 0.61–0.78) for ranking (). In rating scales, ICC analysis showed slightly higher values for LS (r = 0.65, 95% CI 0.55–0.73) and VAS (r = 0.68, 95% CI 0.59–0.76) compared to Spearman's rho (r = 0.63, 95% CI 0.52–0.72 for LS, r = 0.67, 95% CI 0.56–0.75 for VAS, ) with large-scale overlaps of CIs between assessment types within both statistical methods. The typical error for overall comfort was e = 0.75 ranks for ranking, e = 0.93 points on LS and e = 1.5 cm on VAS ().
Figure 1. Comparison of relative reliability between assessment types among all participants (dark grey) and subgroups of participants based on individual reliability analysis (top two-thirds in medium grey, top third in light grey).
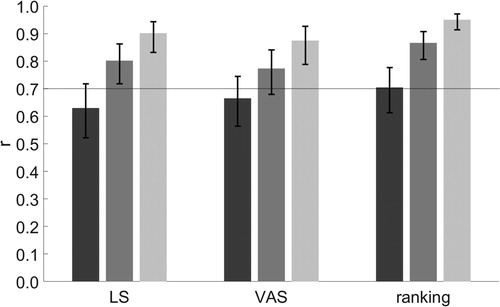
Table II. Comparison of assessment types in all items of the questionnaire with regard to absolute reliability by typical error (e) and relative reliability by rho (r) and 95% CI
In item analysis, systematic bias was found for heel cushioning (p = 0.03), forefoot cushioning (p = 0.03) and comfort of arch (p = 0.03) in LS and for comfort of medio-lateral stability (p = 0.03) in VAS with increased values in the retest. Within LS, comfort of arch showed the lowest, overall discomfort the highest relative inter-session reliability ranging from r = 0.48 to r = 0.71 without overlap of CIs (). In contrast, VAS showed the lowest relative reliability for comfort of medio-lateral stability (r = 0.52) and highest reliability for discomfort of fit (r = 0.70) with a slight overlap of CIs. In six out of nine items of the questionnaire, VAS exceeded the reliability coefficients of LS. In accordance with relative reliability, comfort of arch showed the highest typical error (e = 1.14 points) in LS and comfort of medio-lateral stability the highest typical error (e = 1.79 cm) in VAS.
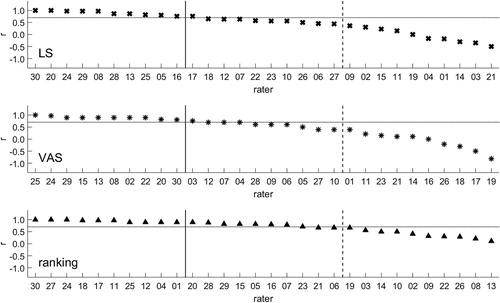
The intra-individual reliabilities for the item “overall comfort” within each of the assessment types can be seen in . The top two-thirds of raters showed coefficients of reliability above r = 0.44 (LS), r = 0.40 (VAS) and r = 0.67 (ranking). The top third exceeded values of r = 0.76 (LS), r = 0.80 (VAS) and r = 0.90 (ranking). The percentage of raters performing with r ≥ 0.7 was 37% for LS, 47% for VAS and 60% for ranking.
Figure 2. Intra-individual relative reliability for the item “overall comfort” in each of the assessment types. Notes: Vertical lines indicate the top third (solid lines) and top two-thirds (dashed lines), respectively. The horizontal line at r = 0.7 represents the cut-off criteria for evaluation of reliable raters introduced by Hoerzer et al. (Citation2016).
For subgroup analyses based on intra-individual reliabilities, the substantial increases in relative reliability within all three assessment types showed no overlap of CIs between the whole group of participants and the top third (). In addition, ranking scale showed no overlap of CI between the whole group of participants and the top two-thirds as well as between the top two-thirds and the top third.
Discussion
To the best knowledge of the authors, this is the most comprehensive study investigating the simultaneously influence of different assessment types, the raters’ intra-individual relative reliability in general and the effect of selected raters on group level relative reliability for footwear-related comfort assessments.
Inter-session reliability of different assessment types
Group level analyses of overall comfort revealed the highest relative reliability within the ranking scale, followed by VAS and LS. In accordance with assumed lowest complexity, which is based on the work of Mills et al. (Citation2010), the ranking from pairwise comparisons outperformed the rating scales with respect to relative reliability. By contrast, the VAS provided the highest resolution and was therefore assumed to be the most complex type and yielded higher relative reliability compared to LS. However, the large-scale overlap of CIs does not facilitate a clear preference of one assessment type.
The order of assessment types detected in the current study with respect to relative reliability is in accordance with the order based on absolute reliability analyses reported by Mills et al. (Citation2010), who depicted better performance for the ranking scale compared to the two rating scales. Furthermore, Hoerzer et al. (Citation2016) compared a low resolution rating scale (y/n) with a high resolution rating scale (VAS) and detected higher reliabilities in comfort assessment when using the low resolution y/n scale. The y/n scale requiring binary response represents the least possible resolution and is comparable to the ranking scale, which requires a direct comparison between conditions, especially in pairwise comparisons.
In the studies cited previously, the assessment type resolution and complexity seemed to influence reliability of footwear comfort assessments. However, in the current study, the VAS yielded higher relative reliability compared to LS despite higher resolution. This confirmed the results of Mills et al. (Citation2010), who found VAS to be more reliable than LS with respect to absolute reliability. A possible explanation for this is that increased resolution of VAS might not correlate with the expected higher differentiation compared to LS. The seven points of the LS in this study were spread across 100 mm, resulting in 16.7 mm spaces between adjacent points in order to achieve optical alignment to the VAS. This is within the range of typical error determined for VAS () and minimal important differences for VAS of about 10 mm that have been identified by Mills et al. (Citation2010). While the scale levels are different and no direct comparison is possible, the spaces between points in LS are comparable to measurement error and minimal important differences of VAS. Combined with equally-labelled anchor points, the VAS and LS could potentially be considered comparable in meaning, which might have caused similar inter-session relative reliability measures. These findings are therefore consistent with previous studies, reporting similar responsiveness of those rating scales in quality of life assessments (Guyatt, Townsend, Berman, & Keller, Citation1987). The results of this study and previous literature indicate that assessment type complexity should not be overrated, as resolution and relative reliability are not linear. Nevertheless, the most extreme reduction in resolution (ranking, y/n) seems to substantially enhance reliability of footwear comfort assessments.
In addition to overall comfort, comparison of rating scales across the supplementary eight items (comfort of heel cushioning, comfort of forefoot cushioning, comfort of medio-lateral stability, comfort of arch, comfort of shoe stiffness, comfort of fit, overall discomfort, discomfort of fit) revealed higher relative reliability in VAS for five out of eight items. However, due to minor differences with recurring overlap of CIs, the VAS might be considered equal to LS based on item-specific relative reliability. These findings are in line with Mills et al. (Citation2010) who reported similar results for the two rating scales in heel and forefoot cushioning. The similarity of VAS and LS can therefore be found in overall comfort and in specific items. The moderate relative reliabilities among the items, however, potentially indicate that either participants might not be experienced in focusing on those particular items, or participants’ sensitivity does not allow participants to recognize shoe characteristics in general or the selected assessment types do not provide a sufficiently sensitive tool for detecting participants’ sensitivity to those items.
Systematic bias was found for four items within the LS and one item within the VAS with increased values in the retest. The changes in the mean were assumed to result from random error (Batterham & George, Citation2003), because randomization of assessment types was expected to assure for exclusion of bias due to learning effects.
Intra-individual reliabilities in general and the effect of rater selection on inter-session reliability in different assessment types
Applying the cut-off criteria of r = 0.7 for individual relative reliability (Hoerzer et al., Citation2016) on the data of the current study, the ranking showed the highest number of reliable raters followed by VAS and LS. This order is consistent with group level relative reliability of overall comfort. Therefore, the large decrease in resolution (ranking) enhances group level reliability and allows for reliable assessments within the majority of raters.
Evaluation of individual relative reliability per assessment type and subsequent exclusion of the third with lowest individual reliability resulted in group level reliabilities above r = 0.7 for all assessment types. Forming subgroups of the best raters can therefore substantially improve the reliability of footwear comfort assessments and selection of the best 67% of raters resulted in acceptable relative reliability across all assessment types according to the criterion of Hoerzer et al. (Citation2016).
The participants within the subgroups differed slightly between the assessment types due to the separate intra-individual reliability analysis. Therefore, comfort assessment seemed to be participant-dependent and showed an interaction with the presented assessment type. This is in line with the findings of Hoerzer et al. (Citation2016), who reported differences in the number of reliable raters within the same group of participants when evaluating assessments of two different scales.
Only five participants of the entire group in the current study performed with a coefficient of reliability above r = 0.7, inattentive of assessment type. Nevertheless, the ranking scale yielded the most reliable raters (60%). This percentage was substantially higher than that for the VAS and LS in the current study (47% and 37%, respectively) as well as for VAS and y/n in a previous study (31 and 46%, Hoerzer et al., Citation2016). Furthermore, overall group and subgroup level relative reliability were highest within the ranking scale, which could therefore be seen as the most valuable tool for footwear comfort assessments.
Practical application and further research
Besides inter-session reliability, the time needed for comfort assessments might influence the preference for one assessment type. The VAS and LS, which allowed for differentiation between shoes and were stated as simple to use (Laerhoven, Zaag-Loonen, & Derkx, Citation2004; Price, McGrath, Rafii, & Buckingham, Citation1983) were equal in assessment time, whereas the ranking scale provided only relative comfort within the conditions, but took almost twice as long to complete. If relative comfort is sufficient for further investigations, the extra effort required for the ranking seems to be worthwhile to achieve higher reliability of measures based on the findings in this study.
Since the reliabilities of assessments in overall group analyses do not generally provide very high correlations (Hopkins, Citation2002), a future standard for comfort-related research in footwear science should include a reliability check of the comfort assessments.
The selection of raters with high intra-individual reliability can contribute to the investigation of comfort-related parameters, however, the selected participants are no longer a random sample of the population. A selection process is therefore suggested for specific investigations on the effects of comfort, while highly individualized and potentially low reliabilities in a general population have to be considered for footwear development. Furthermore, highly individual reliability scores implicate that choosing a shoe based on comfort perception at the point of sale, which was suggested by Nigg et al. (Citation2015) in the paradigm of the comfort filter with regard to injury prevention and running economy, seems to be restricted to a certain part of the population. It is therefore questionable whether the comfort filter can work as a tool for injury prevention in the overall population. The sample size for further studies can be derived from the typical error in the current study by choosing adequate precision and worthwhile effects (Hopkins, Citation2000). Studies on rating consistency of individuals, as provided for orthotics (Mündermann, Nigg, Humble, & Stefanyshyn, Citation2004) and long-term effects could supplement these findings to investigate the importance of comfort in footwear research. In pain assessments, validation of assessment tools is recommended separately for each group of patients (Breivik et al., Citation2008). This could be essential for different uses of footwear as well (e.g. walking, running or cutting).
Methodological considerations
Comparison of different assessment types requires equality in analysis in order to avoid differences in statistical methods across the assessment types (Hoerzer et al., Citation2016; Mills et al., Citation2010). Spearman's rank correlation provided measures of relative reliability within the current study and uniquely, this study analysed CIs in reliability of running footwear comfort assessments to strengthen the explanatory power of reliability tests. However, an increased number of participants might have facilitated a clearer distinction in reliability between assessment types using CIs.
The calculation of typical error as an indicator of absolute reliability provided an approximation of the measurement error. The values were given in the units of measurement for the respective assessment type, which only partially supported direct comparisons. Nevertheless, similarities between the LS and VAS in relative reliability could be strengthened by measures of absolute reliability with regard to meaningful differences within VAS.
Participants were allowed to rank both shoes equally in pairwise comparisons within the ranking scale, which potentially influences relative reliability scores. However, this option depicts practical comparisons of shoes and forced rankings would lead to artificial differentiation of subjectively equal shoes with regard to comfort.
The analysis of intra-individual reliability revealed substantial differences between participants. Age and running speed have been identified as potential contributors to differences in reliability among individuals. Alterations in acuity of sensory receptors in the foot with increased age might influence reliability, and comfort perception has been shown to differ between locomotion speed (walking and running; Miller et al., Citation2000). However, in additional analysis, no correlation between the coefficients of reliability and age or speed could be detected.
A standardized neutral stimulus between testing conditions could potentially provide improvement in the study protocol. As the participants wore their own running shoes prior to each test condition, comfort ratings might have been influenced by anchoring the test condition to the differing neutral condition among participants. However, even if the different anchors potentially influence the absolute rating, this is not expected to influence the reliability of the ratings.
The running trials of two minutes per condition prior to perception assessment resulted from a pilot study and the protocols in previous studies (Mills et al., Citation2010; Mündermann et al., Citation2002). However, an extension of this time period could be considered in protocols of further comfort assessments to account for optimization of running pattern and lower limb muscle activity, especially when running on a treadmill.
Conclusion
The relative reliability of ranking exceeded those of the VAS and LS in comparison of assessment types. Considering the corresponding CIs, however, no clear preference for a specific assessment type can be given in footwear-related comfort assessments based on overall group analysis. In individual analysis, ranking seemed to be a suitable assessment type for a majority of the raters. If differentiation between shoes is not strictly necessary and assessment time is of minor importance, the ranking scale therefore seems to be appropriate based on the results of this study. No preference can be provided for the two investigated rating scales as only minor differences in relative reliability have been found and the time for assessment is similar. For further comfort related studies, additional reliability checks are recommended with regard to differences in individual reliability in interaction with assessment type.
Acknowledgements
We want to acknowledge the support of Dr Drew Harrison for proof-reading the manuscript and the adidas AG for support of the study in terms of a general cooperation with our department.
Disclosure statement
No potential conflict of interest was reported by the authors.
ORCID
Julia Lindorfer http://orcid.org/0000-0003-1469-8545
References
- Atkinson, G., & Nevill, A. M. (1998). Statistical methods for assessing measurement error (reliability) in variables relevant to sports medicine. Sports Medicine, 26(4), 217–238. doi: 10.2165/00007256-199826040-00002
- Batterham, A. M., & George, K. P. (2003). Reliability in evidence-based clinical practice: A primer for allied health professionals. Physical Therapy in Sport, 4(3), 122–128. doi: 10.1016/S1466-853X(03)00076-2
- Breivik, H., Borchgrevink, P., Allen, S., Rosseland, L., Romundstad, L., Hals, E. B., … Stubhaug, A. (2008). Assessment of pain. British Journal of Anaesthesia, 101(1), 17–24. doi: 10.1093/bja/aen103
- Comfort. (n.d.-a). In merriam-webster.com. Retrieved from https://www.merriam-webster.com/dictionary/comfort
- Comfort. (n.d.-b). In oxforddictionaries.com. Retrieved from https://en.oxforddictionaries.com/definition/comfort
- Guyatt, G. H., Townsend, M., Berman, L. B., & Keller, J. L. (1987). A comparison of Likert and visual analogue scales for measuring change in function. Journal of Chronic Diseases, 40(12), 1129–1133. doi: 10.1016/0021-9681(87)90080-4
- Hoerzer, S., Trudeau, M. B., Edwards, W. B., & Nigg, B. M. (2016). Intra-rater reliability of footwear-related comfort assessments. Footwear Science, 8(3), 155–163. doi: 10.1080/19424280.2016.1195451
- Hopkins, W. G. (2000). Measures of reliability in sports medicine and science. Sports Medicine, 30(1), 1–15. doi: 10.2165/00007256-200030010-00001
- Hopkins, W. G. (2002). A new view of statistics. Retrieved from http://sportsci.org/resource/stats/
- Laerhoven, H. V., Zaag-Loonen, H. V. D., & Derkx, B. H. (2004). A comparison of Likert scale and visual analogue scales as response options in children’s questionnaires. Acta Paediatrica, 93(6), 830–835. doi: 10.1111/j.1651-2227.2004.tb03026.x
- Lin, H.-H., & Chiu, H.-T. (2016). Test-retest reliability of paired preference test for weighted shoes. ISBS-Conference Proceedings Archive, 34(1), 423–426.
- Luo, G., Stergiou, P., Worobets, J., Nigg, B., & Stefanyshyn, D. (2009). Improved footwear comfort reduces oxygen consumption during running. Footwear Science, 1(1), 25–29. doi: 10.1080/19424280902993001
- Miller, J. E., Nigg, B. M., Liu, W., Stefanyshyn, D. J., & Nurse, M. A. (2000). Influence of foot, leg and shoe characteristics on subjective comfort. Foot & Ankle International, 21(9), 759–767. doi: 10.1177/107110070002100908
- Mills, K., Blanch, P., & Vicenzino, B. (2010). Identifying Clinically Meaningful Tools for Measuring Comfort Perception of Footwear. Medicine & Science in Sports & Exercise, 42(10), 1966–1971. doi: 10.1249/MSS.0b013e3181dbacc8
- Mündermann, A., Nigg, B. M., Humble, R. N., & Stefanyshyn, D. J. (2004). Consistent immediate effects of foot orthoses on comfort and lower extremity kinematics, kinetics, and muscle activity. Journal of Applied Biomechanics, 20(1), 71–84. doi: 10.1123/jab.20.1.71
- Mündermann, A., Nigg, B. M., Stefanyshyn, D. J., & Humble, R. N. (2002). Development of a reliable method to assess footwear comfort during running. Gait & Posture, 16(1), 38–45. doi: 10.1016/S0966-6362(01)00197-7
- Mündermann, A., Stefanyshyn, D. J., & Nigg, B. M. (2001). Relationship between footwear comfort of shoe inserts and anthropometric and sensory factors. Medicine & Science in Sports & Exercise, 33(11), 1939–1945. doi: 10.1097/00005768-200111000-00021
- Nigg, B. M. (2010). Biomechanics of sport shoes. Calgary: University of Calgary.
- Nigg, B. M., Baltich, J., Hoerzer, S., & Enders, H. (2015). Running shoes and running injuries: Mythbusting and a proposal for two new paradigms: “Preferred movement path” and “comfort filter”. British Journal of Sports Medicine, 49(20), 1290–1294. doi: 10.1136/bjsports-2015-095054
- Pearson, E. J. (2009). Comfort and its measurement--a literature review. Disability and Rehabilitation: Assistive Technology, 4(5), 301–310. doi: 10.1080/17483100902980950
- Price, D. D., McGrath, P. A., Rafii, A., & Buckingham, B. (1983). The validation of visual analogue scales as ratio scale measures for chronic and experimental pain. Pain, 17(1), 45–56. doi: 10.1016/0304-3959(83)90126-4
- Reinschmidt, C., & Nigg, B. M. (2000). Current issues in the design of running and court shoes. Sportverletzung Sportschaeden, 14(3), 71–81.
- Rupérez, M. J., Monserrat, C., Alemany, S., Juan, M. C., & Alcañíz, M. (2010). Contact model, fit process and, foot animation for the virtual simulator of the footwear comfort. Computer-Aided Design, 42(5), 425–431. doi: 10.1016/j.cad.2009.09.003
- Slater, K. (1985). Human comfort (Vol. 1). Springfield, IL: CC Thomas.
- Witana, C. P., Goonetilleke, R. S., Au, E. Y. L., Xiong, S., & Lu, X. (2009). Footbed shapes for enhanced footwear comfort. Ergonomics, 52(5), 617–628. doi: 10.1080/00140130802419503
- Zhang, L., Helander, M. G., & Drury, C. G. (1996). Identifying factors of comfort and discomfort in sitting. Human Factors, 38(3), 377–389. doi: 10.1518/001872096778701962