
 ?Mathematical formulae have been encoded as MathML and are displayed in this HTML version using MathJax in order to improve their display. Uncheck the box to turn MathJax off. This feature requires Javascript. Click on a formula to zoom.
ABSTRACT
The aim of this study is to investigate whether the change in (sub)maximal heart rate after intensified training is associated with the change in performance. Thirty subjects were recruited who performed cardiopulmonary exercise tests to exhaustion 2 weeks before (pre), 1 week after (post) and 5 weeks after (follow-up) an 8-day non-competitive amateur cycling event (TFL). The exercise volume during the TFL was 7.7 fold the volume during the preparation period. Heart rate and cardiopulmonary parameters were obtained at standardised absolute submaximal workloads (low, medium and high intensity) and at peak level each test. Subjects were classified as functionally overreached (FOR) or acute fatigued (AF) based on the change in performance. No differences between FOR and AF were observed for heart rate (P = .51). On total group level (AF + FOR), post-TFL heart rate decreased significantly at low (−4.4 beats·min−1, 95% CI [−8.7, −0.1]) and medium (−5.5 beats·min−1 [−8.5, −2.4]), but not at high intensity. Peak heart rate decreased −3.4 beats·min−1 [−6.1, −0.7]. O2pulse was on average 0.49 ml O2·beat−1 [0.09, 0.89] higher at all intensities after intensified training. No changes in ⩒O2 (P = .44) or the ventilatory threshold (P = .21) were observed. Pearson’s correlation coefficients revealed negative associations between heart rate and O2pulse at low (r = −.56, P < .01) and medium intensity (r = −.54, P < .01), but not with ⩒O2 or any other submaximal parameter. (Sub)maximal heart rate decreased after the TFL. However, this decrease is unrelated to the change in performance. Therefore, heart rate seems inadequate to prescribe and monitor intensified training.
Highlights
Heart rate at submaximal and maximal exercise intensity is lower after an 8-day non-competitive amateur cycling event.
The decrease in heart rate does not result in changes in ⩒O2.
The decrease in heart rate was not related to decreased performance on an incremental cycling test after the 8-day event.
Introduction
Overtraining is a process of intensified training with insufficient rest, resulting in accumulated fatigue and decreased performance. The possible expression of overtraining is functional overreaching (FOR), non-functional overreaching (NFOR), or eventually overtraining syndrome (OTS) (Meeusen et al., Citation2006, Citation2013). FOR is sometimes deliberately induced in training programmes, whereas NFOR and OTS should be avoided because of the severity of symptoms and the long or even absent recovery times. It is, therefore, important to appropriately prescribe exercise and monitor training status.
Heart rate is strongly related to oxygen consumption, and it is easily measured as a result of the ongoing technical developments (Achten & Jeukendrup, Citation2003). Some approaches use (daily) resting heart rate or heart rate variability measures to prescribe and monitor training (Buchheit, Citation2014). Though, the focus in this paper is on exercise heart rate, because it is often used to prescribe and monitor training intensity (e.g. Lucía, Hoyos, Santalla, Earnest, & Chicharro, Citation2003). Maximal heart rate is generally reduced after an intensified training period (Meeusen et al., Citation2013), but the effect on submaximal heart rate is not completely clear. It was initially believed that the heart rate increased with overtraining (Kuipers & Keizer, Citation1988). In contrast, Bosquet, Merkari, Arvisais, and Aubert (Citation2008) concluded in their review that submaximal heart rate was lower after periods of intensified training of more than 2 weeks, but unchanged after shorter periods (< 2 weeks). A recent study also showed a drop in submaximal heart rate only after an 8-day training camp (Decroix, Lamberts, & Meeusen, Citation2018).
Furthermore, it is unknown whether the possible change in heart rate is associated with underperformance (i.e. FOR) after an intensified training period. Le Meur et al. (Citation2014) showed that (sub)maximal heart rate was lower after intensified training, regardless of whether athletes underperformed (FOR) or maintained performance level after this period. Still, the oxygen consumption remained unchanged in these subjects. Thus, the question arises whether other cardiopulmonary parameters can explain the drop in heart rate or the change in performance.
Therefore, the first aim of this study was to investigate the effect of intensified training on (sub)maximal heart rate. A second goal was to examine whether the potential change in (sub)maximal heart rate or other cardiopulmonary variables were associated with a change in physical performance. For this purpose, we evaluated cardiopulmonary exercise tests before and after an 8-day non-competitive amateur cycling event that possibly resulted in underperformance (FOR). Subjects who underperformed as a result of the event (FOR) were compared with subjects who maintained their performance level, and correlation analyses were performed. It was hypothesised that (sub)maximal heart rate would be lower after this period of intensified training, but that this decrease would not be associated with a change in performance.
Methods
Subjects
A total of 30 subjects were recruited (11 female, 19 male). ⩒O2max at baseline (mean ± SD) was 51.8 ± 6.3 ml O2·kg−1 min−1, peak power output was 4.12 ± 0.57 W kg−1 and age was 40.8 ± 10.8 years. The subjects’ fitness level can be described as performance level 1 (4%), 2 (57%), 3 (25%) and 4 (14%) according to the ⩒O2max-based athlete classification norms (De Pauw et al., Citation2013; Decroix, De Pauw, Foster, & Meeusen, Citation2016). Subjects gave written informed consent prior to the first measurements. The study was conducted in accordance with the Declaration of Helsinki and approved by the institutional ethical committee (VUmc 2014.319).
Design
The subjects visited our laboratory 12–17 days before (pre), 5–8 days after (post) and 33–36 days after (follow-up) the Tour for Life (TFL). The TFL is an amateur non-competitive cycling event that covers a total of 1300 km and 18,500 vertical climbing metres in 8 consecutive days. A previous study (ten Haaf et al., Citation2017) showed that subjects cycled on average 495 ± 66 min per day with a rating of perceived exertion (Foster et al., Citation1995) of 6.9 ± 1.2 on a 0–10 visual analogue scale. The exercise volume was approximately 7.7 fold the exercise volume during the preparation over the preceding 8 months. During each laboratory visit, cardiopulmonary parameters and performance were evaluated by means of a maximal incremental cycling test to exhaustion. As part of a larger research project, subjects performed two tests during each visit, with 4 h between the start of the morning and afternoon exercise test. Subjects did not perform a vigorous exercise within 36 h prior to the laboratory visits. Habitual breakfast was consumed at home, at the latest 2 h before each laboratory visit. Between the exercise bouts, the subjects relaxed and lunch was provided.
Incremental exercise test
Each exercise bout started with cycling (Excalibur Sport, Lode Medical Technology, Groningen, The Netherlands, or; Ergomedic 839E, Monark Exercise AB, Vansbro, Sweden) at 80 W for 3 min, increased by 30 W (women) or 40 W (men) every 3 min. The test ended when the subject was unable to maintain a cadence of at least 60 rpm, despite strong verbal encouragement. Each subject performed the tests on the same ergometer and at the same time of the day during each laboratory visit. Saddle and handle bar height were recorded after the first test, and the same settings were used in all subsequent tests. Performance was defined as the peak power output (PPO) achieved during each test. PPO was calculated as the average power output over the last 3 min of the exercise test (i.e. PPO = Wcompl + Wincr × (t/180), where Wcompl is the last completed workload, Wincr is the increment in workload, and t is the number of seconds in the last workload).
Cardiopulmonary measurements
Heart rate was measured beat-by-beat using a portable electrocardiography device (VU-AMS; Vrije Universiteit Amsterdam, the Netherlands). Both 5 and 7 lead versions of the VU-AMS5fs device (De Geus, Willemsen, Klaver, & Van Doornen, Citation1995) together with Kendal ARBO H98SG single-use electrodes were used. Gas exchange was measured breath-by-breath using open-circuit spirometry (Cosmed Quark CPET; and Cosmed Quark B2, Cosmed S. R. L., Rome, Italy). The gas analysers and volume transducers were calibrated before every test (gas analysers: reference gas mixture of 16.00% O2 and 5.00% CO2, volume transducers: 3 L syringe). The same machine was used for each individual during each visit.
Data analyses
A 4th-order moving median filter was applied on the breath-by-breath respiratory data and the beat-by-beat heart rate data to remove outliers. The ventilatory threshold (L O2·min−1) was determined by two blinded assessors according to the v-slope method (Beaver, Wasserman, & Whipp, Citation1986). Thresholds that differed more than 2% between assessors were discussed until consensus was reached.
For further analyses data were converted into second-by-second data using interpolation. Heart rate (beats·min−1), O2pulse (ml O2·beat−1), ⩒O2 (L O2·min−1), ⩒CO2 (L CO2·min−1), respiratory exchange ratio (RER) and pulmonary ventilation (L·min−1) were obtained at standardised absolute submaximal workload (low, medium and high intensity) and at peak levels. Low exercise intensity was defined as the first exercise step (80 W). Medium and high intensity were defined as 50% PPO and 100% PPO of the worst performance of the three visits, respectively. Worst performance was determined per subject as the lowest PPO of the 6 tests, so that the cardiopulmonary parameters were calculated at the same absolute power output for each exercise test. 50% of worst performance was rounded to the lower exercise step. Peak values were defined as the highest values before volitional exhaustion. As an example, a male subject whose lowest peak power output in the 6 tests was 328 W completed at least 7 exercise steps every test (i.e. 80–120–160–200–240–280–320 W). In this example, the parameters for all 6 exercise tests were calculated over the last 30 s of the first step (80 W), third step (160 W, 50% worst performance), seventh step (320 W, 100% worst performance) and the highest 30 s average (peak). All outcome parameters were averaged over the morning and afternoon exercise test for each visit.
Classification functional overreaching
Subjects were classified as either functional overreached (FOR) or acute fatigued (AF) based on the change in physical performance since underperformance is one of the main characteristics of FOR (Meeusen et al., Citation2013). In line with previous research, subjects were classified as FOR if the decrease in performance between the pre- and post-TFL exercise tests was bigger than the smallest worthwhile change (Aubry, Hausswirth, Louis, Coutts, & Le Meur, Citation2014; Decroix, Piacentini, Rietjens, & Meeusen, Citation2016; ten Haaf et al., Citation2017). The smallest worthwhile change was calculated as 0.3 * the coefficient of variation of peak power output between the 2 pre-TFL exercise tests (Hopkins, Hawley, & Burke, Citation1999).
Statistics
Normality of the data was confirmed after checking using the Shapiro–Wilks test. Repeated-Measures ANOVAs with visit (pre, post and follow-up) and intensity (low, medium, high and peak intensity) as within-subject factors and classification (FOR, AF) as between-subject factor were used to analyse differences in heart rate, O2pulse, ⩒O2, ⩒CO2, RER and pulmonary ventilation. Differences between visits for the ventilatory threshold and physical performance (PPO) were analysed using Repeated-Measures ANOVAs with visit (pre, post and follow-up) as within-subject factor and classification (FOR, AF) as between-subject factor. Significant main effects were followed by Bonferroni adjusted pairwise comparisons. Pearson’s correlation coefficients were calculated to investigate the associations between the pre- versus post-TFL changes of the cardiopulmonary measures at each exercise intensity (heart rate, O2pulse, ⩒O2, ⩒CO2, RER and pulmonary ventilation), the ventilatory threshold and physical performance. The standard deviations shown in figures were adjusted for repeated-measures by means of excluding between-subject variability (Cousineau, Citation2005). P-values smaller than .05 were considered statistically significant. Analyses were performed using SPSS (IBM Corp., IBM SPSS Statistics for Windows, Version 24.0, Amonk, NY).
Results
One subject was excluded from analyses because he showed asthmatic symptoms during the post-TFL exercise tests. Three subjects dropped-out during the follow-up measurements due to injuries. Data of 3 subjects were missing due to technical errors. As a result, 24 subjects were included in the ANOVAs, and 26 in the correlation analyses.
The coefficient of variation of PPO in the pre-TFL exercise tests was 1.6%, meaning that the smallest worthwhile change was 0.5%. According to the classification criteria, 12 subjects were categorised as FOR and 12 as AF. The baseline characteristics of these groups are displayed in . As a consequence of our classification criteria, PPO in FOR was 0.21 W·kg−1 (95% confidence interval [−0.38, −0.06]) lower post compared to pre-TFL, but did not change significantly in AF (0.02 W kg−1 [−0.09, 0.13]). At follow-up, PPO was significantly lower in FOR (−0.22 W kg−1 [−0.41, −0.02]) but not in AF (−0.06 W kg−1 [−0.22, 0.11]).
Table I. Baseline characteristics (mean ± normal SD) for acute fatigued (AF) and functionally overreached (FOR) subjects.
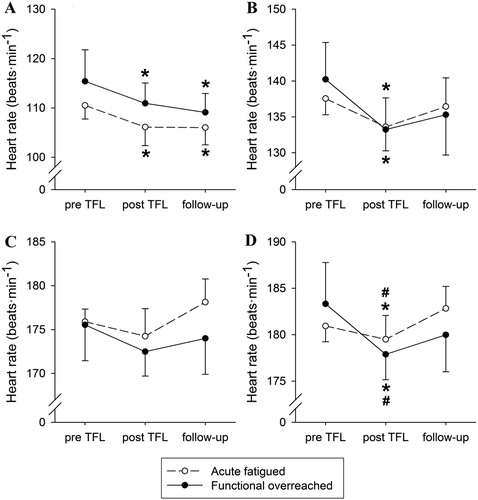
No significant visit by classification (F(2,44) = 1.33, P = .27, = .06) or visit by intensity by classification (F(2.8,62.0) = 0.76, P = .51,
= .03) interaction effect was observed for heart rate (). On total group level (AF + FOR), the visit by intensity interaction was significant (F(2.8,62.0) = 6.50, P < .001,
= .23). At low intensity, the heart rate post-TFL (−4.4 beats·min−1, 95% confidence interval: [−8.7, −0.1]) and at follow-up (−5.4 beats·min−1 [−9.5, −1.3]) were lower than pre-TFL. At medium exercise intensity the heart rate was lower post compared to pre-TFL (−5.5 beats·min−1 [−8.5, −2.4]), but at high exercise intensity, no significant differences were observed between the visits. The peak heart rate was lower post-TFL than pre-TFL (−3.4 beats·min−1 [−6.1, −0.7]) and follow-up (−2.7 beats·min−1 [−5.3, −0.1]).
Figure 1. Heart rate at low (A, 80 W), medium (B, 50% worst performance), high (C, 100% worst performance) and peak (D) exercise intensity for acute fatigued (N = 12, open circles) and functionally overreached subjects (N = 12, filled circles). Data are displayed as mean ± adjusted SD (Cousineau, Citation2005). *Significant different from baseline (P < .05). # Significant different from follow-up (P < .05).
In line with heart rate, none of the other cardiopulmonary parameters showed a significant visit by classification (O2 pulse: P = .77, ⩒O2: P = .96, ⩒CO2: P = .55, RER: P = .35, pulmonary ventilation: P = .74, ventilatory threshold: P = .86) or visit by intensity by classification interaction effect (O2 pulse: P = .40, ⩒O2: P = .43, ⩒CO2: P = .69, RER: P = .18, pulmonary ventilation: P = .43). Data based on percentage of the maximal value for AF and FOR per visit are provided in Supplementary table I.
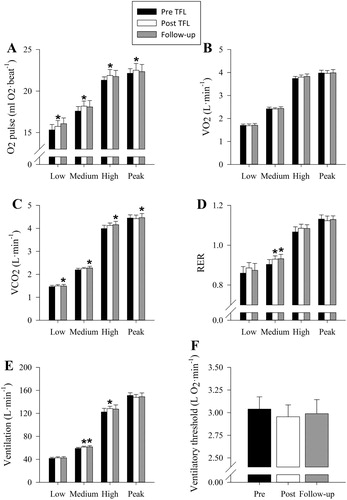
On total group level (AF + FOR), a significant effect of the visit was observed for O2pulse (F(1.69,38.8) = 3.72, P = .04, = .14), without different effects between the exercise intensities. The O2pulse post-TFL was on average 0.49 ml O2·beat−1 [0.09, 0.89] higher than pre-TFL, but not significantly different at follow-up ((A)). ⩒O2 ((B)) did not change between the visits (F(2,44) = 0.81, P = .45,
= .04), while ⩒CO2 was 0.075 L CO2·min−1 [0.000, 0.149] higher at follow-up compared to pre-TFL ((C)). Only at medium exercise intensity the RER was higher post TFL (0.03 [0.01, 0.04]) and at follow-up (0.03 [0.01, 0.05]) compared to pre-TFL ((D)). Pulmonary ventilation ((E)) was higher post than pre-TFL, but only at medium (2.40 L·min−1 [1.00, 3.81]) and high exercise intensity (5.93 L min−1 [2.01, 9.84]). The ventilatory threshold ((F)) was not different between visits (F(2,44) = 1.63, P = .21,
= .07).
Figure 2. O2 pulse (A), ⩒O2 (B), ⩒CO2 (C), respiratory exchange ratio (D), pulmonary ventilation (E) and ventilatory threshold (F) for the pre (black), post (white) TFL and follow-up (grey) incremental cycling ergometer tests. Data (N = 24) are shown for low (80 W), medium (50% worst performance) and high intensity (100% worst performance) and peak values. Worst performance was determined per subject as the lowest peak power output of all tests, so that the cardiopulmonary parameters were calculated at the same absolute power output for each exercise test. Data are displayed as mean ± adjusted SD (Cousineau, Citation2005). * Significant different from baseline (P < .05).
shows the associations between the changes in cardiopulmonary and performance data, calculated as the differences between pre- and post-TFL (e.g. heart ratepost-pre versus O2pulsepost-pre). A negative association was observed between the change in heart rate and O2pulse at low (r = −.56, P < .01) and medium (r = −.54, P < .01), but not at high (r = −.30, P = .13) and peak exercise intensity (r = −.04, P = .86). Yet, the change in submaximal heart rate was not related to changes in ⩒O2 or changes in any other parameter. In contrast, O2pulse was positively associated with ⩒O2 at every exercise intensity, with the strongest associations at high (r = .82, P < .001) and peak intensity (r = .85, P < .001). Performance was weakly negatively associated with the change in ⩒CO2 at low (r = −.40, P = .04) and medium exercise intensity (r = −.44, P = .03). At high intensity, performance was negatively associated with the change in RER (r = −.54, P < .01) and pulmonary ventilation (r = −.47, P = .02). The peak values of all parameters changed positively with the change in performance, except RER (r = .06, P = .76).
Table II. Pearson’s correlation coefficients (N = 26) between pre versus post-TFL changes in cardiopulmonary variables, ventilatory threshold and performance (defined as peak power output).
Discussion
This study showed that heart rate during exercise was lower after an 8-day non-competitive amateur cycling event. Historical reviews suggested that submaximal heart rate is increased after intensified training (Kuipers & Keizer, Citation1988). This is still sometimes assumed in recent studies (Brink, Visscher, Coutts, & Lemmink, Citation2012; Schmikli, de Vries, Brink, & Backx, Citation2012). However, in line with our results, experimental data showed decreased heart rate (Le Meur, Hausswirth, et al., Citation2013; Le Meur et al., Citation2014), or increased power output at a given submaximal heart rate (Decroix et al., Citation2018; Lamberts, Rietjens, Tijdink, Noakes, & Lambert, Citation2010) after the training load was increased. This is regarded as a sign of overload and fatigue, rather than a supercompensation effect. Interestingly, the decreased heart rate in our study was observed 5–8 days after the intensified training period, while other studies observed a return to baseline values after such a period of time (Decroix et al., Citation2018; Le Meur et al., Citation2014). This suggests that homeostasis in our study was more disturbed, possibly due to a different relative increase in training load (7.7 fold for 8 days in our study versus 130% for 3 weeks and 208% for 8 days, respectively). Moreover, in a review by Bosquet and colleagues (Citation2008), it was concluded that heart rate during exercise decreased after overload training lasting longer than 2 weeks, but remained unchanged after shorter periods. Our data, however, showed that heart rate was significantly lower even after only 8 days of overload training. These observations suggest that not only the duration of intensified training, but also the relative increase in training load affects the heart rate. The changes in performance and cardiopulmonary measures at follow-up should be interpreted with care. Some subjects continued their pre-event training programme, while others stopped training because they reached their goal (riding the TLF) or because the follow-up visit coincided with the end of the Dutch cycling season. It is therefore unclear whether the changes reflect overtraining or detraining.
In line with previous work (Le Meur et al., Citation2014), submaximal heart rate in our study decreased both in AF and FOR athletes. Also, the correlation analyses revealed no associations between the change in heart rate and performance. This suggests that the observed change in submaximal heart rate in our study is rather a general effect of intensified training (i.e. the TFL), than that it is associated with underperformance. This can possibly be explained by the finding that, despite a decreased (sub)maximal heart rate after the TFL, ⩒O2 was unchanged at all exercise intensities. The negative association between the pre- versus post-TFL changes in heart rate and O2pulse at low and medium exercise intensity illustrates that ⩒O2 was maintained through compensation by an increased stroke volume and/or arteriovenous oxygen difference. A case study from the 1970s applied the direct Fick principle to reveal that stroke volume decreased and arteriovenous oxygen difference increased after jogging across the United States for 6 days per week, for 2.5 months (Bruce, Kusumi, Culver, & Butler, Citation1975). Similarly, an experimental study using impedance cardiography showed a decrease in stroke volume, and an increase in arteriovenous oxygen difference in overreached but not in acute fatigued athletes (Le Meur et al., Citation2014). It is, therefore, speculated that an increased arteriovenous oxygen difference compensated for the decrease in heart rate in our study, but further research in necessary to evaluate this hypothesis.
In line with ⩒O2, the ventilatory threshold remained unchanged in this study. This suggests that the cellular lactate production and clearance were unaltered (Billat, Sirvent, Py, Koralsztein, & Mercier, Citation2003). In contrast, at a high exercise intensity, the change in respiratory exchange ratio and pulmonary ventilation were associated with the change in performance in our study. This suggests accelerated acidosis at exercise intensity above the ventilatory threshold, resulting in an increased relative effort and, eventually, earlier fatigue. This, however, is not in line with the literature, which suggests unchanged or slightly decreased blood lactate concentrations in athletes with decreased performance after intensified training (Urhausen & Kindermann, Citation2002).
The cause of the observed decrease in heart rate cannot be determined from our data. Le Meur and colleagues (Citation2014) found lower cardiac output in FOR athletes and concluded that this was due to adrenal insufficiency. However, plasma epinephrine concentrations in that study were only decreased at the highest exercise intensities, while heart rate and stroke volume were lower at all intensities. Therefore, adrenal insufficiency cannot solely explain the lower cardiac output. Perhaps parasympathetic hyperactivity partly causes the lower heart rate, as has been demonstrated by research on heart rate variability (Le Meur, Pichon, et al., Citation2013) and the rate of heart rate increase (Bellenger et al., Citation2017) in overreached athletes. Yet, other mechanisms such as decreased density and/or sensitivity of the adrenal receptors may affect the heart rate (Steinacker, Lormes, Reissnecker, & Liu, Citation2004). Further research should apply the simultaneous assessment of these potential mechanisms to reveal their relative contributions.
Peak heart rate was lower after the TFL. A lower peak heart rate is generally found in overreaching (Meeusen et al., Citation2013). In an observational study, a decreased peak heart rate during the Tour the France and Vuelta a España has been shown (Lucía et al., Citation2003). By means of linear regression analysis a decrease of 0.389 beats·min−1 per day, or 3.1 beats·min−1 after 8 days of racing, was estimated. The decreased peak heart rate in our study was not statistically different between AF and FOR, although the visit by classification interaction effect was borderline significant (P = .056). At high intensity (100% PPO) no changes between pre- and post-TFL were observed. Also in another study, the heart rate decreased at submaximal intensity, whereas the peak heart rate was only lower in FOR but not in AF athletes (Le Meur et al., Citation2014). These findings do not exclude the possibility that the generally observed decreased peak heart rate in overreaching is a consequence of decreased peak power output.
Our finding that heart rate decreased after intensified training, without association with the change in performance, has important consequences for training prescription and monitoring. Firstly, prescription and monitoring are often based on heart rate-defined training zones (Achten & Jeukendrup, Citation2003). However, a lower submaximal heart rate will result in underestimating the internal training load. In line with this finding, it was recently reported that (sub)maximal heart rate immediately after the Vuelta a España was lower than 1 week before the race (Rodríguez-Marroyo, Villa, Pernía, & Foster, Citation2017). Recalculation of the heart rate-defined training zones showed that the time in the highest training zone (i.e. above the respiratory compensation threshold) during the race was underestimated based on the difference in the heart rate response before and after the Vuelta. Secondly, several training monitoring tools, such as the Lamberts and Lambert Submaximal Cycle Test (Lamberts, Swart, Noakes, & Lambert, Citation2011), are based on changes in heart rate at submaximal exercise intensity. Yet, our study, as well as previous data (Le Meur et al., Citation2014), illustrates that a decreased heart rate is a general response after an intensified training period, rather than an indicator of decreased performance. Since decreased performance is one of the main characteristics of overreaching (Meeusen et al., Citation2013), and thus the primary target of training monitoring during a period of intensified exercise, submaximal heart rate seems inadequate as a single measure to monitor intensified training. Still, it should be acknowledged that a change in performance results from combined changes in fitness and fatigue, and that our methodology does not distinguish between these two. Also, recent studies suggested that objective and subjective measures should be combined to monitor training (Bourdon et al., Citation2017; Lamberts et al., Citation2011). For example, the rating of perceived exertion has been shown to be a crucial measure for interpretation of the Lamberts and Lambert Submaximal Cycle Test. Athletes and coaches are, therefore, advised to included measures of perceptual effort in heart rate testing protocols to assess training status.
Limitations
In this study, we were able to evaluate cardiopulmonary exercise tests before and after intensified training in a relatively large study population. The downside of our methodology, however, is that the subjects were on average older and of lower fitness level than elite athletes. This probably means that their maximal heart rate and stroke volume were different from elite athletes. Additionally, the applied increase in exercise volume during the Tour for Life is not expected in elite sports practice. Lastly, the classification criterion is in line with a series of recent papers from different groups. Still, consensus has not been reached on the method to distinguish acute fatigue, functional and non-functional overreaching. Other approaches include for example changes in subjective fatigue or apply a more conservative threshold for the change in performance. To test this limitation in our study, a definition of the smallest worthwhile change of 0.7 * the coefficient of variation has been applied, but without different results (data not shown). Also, the correlation analyses () revealed no association between heart rate and performance when expressed as continuous measures.
Conclusion
This study showed that heart rate at submaximal and maximal exercise intensity is lower after an 8-day non-competitive amateur cycling event. However, this decrease is unrelated to the change in performance and does not result in lower ⩒O2. Coaches and athletes should, therefore, be aware of the possible limitations of heart rate for prescription and monitoring of intensified training.
Supplemental data
Supplemental data for this article can be accessed here (https://doi.org/10.1080/17461391.2019.1571112).
Art_5_Supplementary_table_I_time_and_class_180803.docx
Download MS Word (21 KB)Acknowledgements
This study was performed by the Ambruro consortium, an acronym for its partners Vrije Universiteit Amsterdam, Vrije Universiteit Brussels, UMC Utrecht, Università degli Studi di Roma Foro Italico. Led by the Vrije Universiteit Amsterdam the consortium designed and conducted the Ambruro training monitor study, of which part of the results are described in this paper.
The time and effort of all participants are highly appreciated. We also acknowledge the Tour for Life organisation for their support with the recruitment of subjects and logistics. At last, we thank Erik Oudenhoven, Margot Klöpping, Ineke Nederend and all students for their enthusiastic help with data acquisition.
Disclosure statement
No potential conflict of interest was reported by the authors.
References
- Achten, J., & Jeukendrup, A. E. (2003). Heart rate monitoring: Applications and limitations. Sports Medicine, 33(7), 517–538. doi: 10.2165/00007256-200333070-00004
- Aubry, A., Hausswirth, C., Louis, J., Coutts, A. J., & Le Meur, Y. (2014). Functional overreaching: The key to peak performance during the taper? Medicine & Science in Sports & Exercise, 46(9), 1769–1777. doi: 10.1249/MSS.0000000000000301
- Beaver, W. L., Wasserman, K., & Whipp, B. J. (1986). A new method for detecting anaerobic threshold by gas exchange. Journal of Applied Physiology, 60(6), 2020–2027. doi: 10.1152/jappl.1986.60.6.2020
- Bellenger, C. R., Thomson, R. L., Robertson, E. Y., Davison, K., Nelson, M. J., Karavirta, L., & Buckley, J. D. (2017). The effect of functional overreaching on parameters of autonomic heart rate regulation. European Journal of Applied Physiology, 117(3), 541–550. doi: 10.1007/s00421-017-3549-5
- Billat, V., Sirvent, P., Py, G., Koralsztein, J., & Mercier, J. (2003). The Concept of maximal lactate Steady State. Sports Medicine, 33(6), 407–426. doi: 10.2165/00007256-200333060-00003
- Bosquet, L., Merkari, S., Arvisais, D., & Aubert, A. E. (2008). Is heart rate a convenient tool to monitor over-reaching? A systematic review of the literature. British Journal of Sports Medicine, 42(9), 709–714. doi: 10.1136/bjsm.2007.042200
- Bourdon, P. C., Cardinale, M., Murray, A., Gastin, P., Kellmann, M., Varley, M. C. … Cable, N. T. (2017). Monitoring athlete training loads: Consensus Statement. International Journal of Sports Physiology and Performance, 12, S2-161–S2-170. doi: 10.1123/IJSPP.2017-0208
- Brink, M. S., Visscher, C., Coutts, A. J., & Lemmink, K. A. P. M. (2012). Changes in perceived stress and recovery in overreached young elite soccer players. Scandinavian Journal of Medicine & Science in Sports, 22(2), 285–292. doi: 10.1111/j.1600-0838.2010.01237.x
- Bruce, R. A., Kusumi, F., Culver, B. H., & Butler, J. (1975). Cardiac limitation to maximal oxygen transport and changes in components after jogging across the US. Journal of Applied Physiology, 39(6), 958–964. doi: 10.1152/jappl.1975.39.6.958
- Buchheit, M. (2014). Monitoring training status with HR measures: Do all roads lead to Rome? Frontiers in Physiology, 5, 73. doi: 10.3389/fphys.2014.00073
- Cousineau, D. (2005). Confidence intervals in within-subject designs: A simpler solution to Loftus and Masson’s method. Tutorials in Quantitative Methods for Psychology, 1(1), 42–45. doi: 10.20982/tqmp.01.1.p042
- Decroix, L., De Pauw, K., Foster, C., & Meeusen, R. (2016). Guidelines to classify female subject groups in sport science research. International Journal of Sports Physiology and Performance, 11(2), 204–213. doi: 10.1123/ijspp.2015-0153
- Decroix, L., Lamberts, R. P., & Meeusen, R. (2018). Can the Lamberts submaximal Cycle test reflect overreaching in Professional Cyclists? International Journal of Sports Physiology and Performance, 13(1), 23–28. doi: 10.1123/ijspp.2016-0685
- Decroix, L., Piacentini, M. F., Rietjens, G., & Meeusen, R. (2016). Monitoring physical and cognitive overload during a training camp in professional female cyclists. International Journal of Sports Physiology and Performance, 11(7), 933–939. doi: 10.1123/ijspp.2015-0570
- De Geus, E. J. C., Willemsen, G. H. M., Klaver, C. H. A. M., & Van Doornen, L. J. P. (1995). Ambulatory measurement of respiratory sinus arrhythmia and respiration rate. Biological Psychology, 41(3), 205–227. doi: 10.1016/0301-0511(95)05137-6
- De Pauw, K., Roelands, B., Cheung, S. S., de Geus, B., Rietjens, G., & Meeusen, R. (2013). Guidelines to classify subject groups in sport-science research. International Journal of Sports Physiology and Performance, 8(2), 111–122. doi: 10.1123/ijspp.8.2.111
- Foster, C., Hector, L. L., Welsh, R., Schrager, M., Green, M. A., & Snyder, A. C. (1995). Effects of specific versus cross-training on running performance. European Journal of Applied Physiology and Occupational Physiology, 70(4), 367–372. doi: 10.1007/BF00865035
- Hopkins, W. G., Hawley, J. A., & Burke, L. M. (1999). Design and analysis of research on sport performance enhancement. Medicine & Science in Sports & Exercise, 31(3), 472–485. doi: 10.1097/00005768-199903000-00018
- Kuipers, H., & Keizer, H. A. (1988). Overtraining in elite athletes. Review and directions for the future. Sports Medicine, 6(2), 79–92. doi: 10.2165/00007256-198806020-00003
- Lamberts, R. P., Rietjens, G. J., Tijdink, H. H., Noakes, T. D., & Lambert, M. I. (2010). Measuring submaximal performance parameters to monitor fatigue and predict cycling performance: A case study of a world-class cyclo-cross cyclist. European Journal of Applied Physiology, 108(1), 183–190. doi: 10.1007/s00421-009-1291-3
- Lamberts, R. P., Swart, J., Noakes, T. D., & Lambert, M. I. (2011). A novel submaximal cycle test to monitor fatigue and predict cycling performance. British Journal of Sports Medicine, 45(10), 797–804. doi: 10.1136/bjsm.2009.061325
- Le Meur, Y., Hausswirth, C., Natta, F., Couturier, A., Bignet, F., & Vidal, P. P. (2013). A multidisciplinary approach to overreaching detection in endurance trained athletes. Journal of Applied Physiology, 114(3), 411–420. doi: 10.1152/japplphysiol.01254.2012
- Le Meur, Y., Louis, J., Aubry, A., Gueneron, J., Pichon, A., Schaal, K., … Hausswirth, C. (2014). Maximal exercise limitation in functionally overreached triathletes: Role of cardiac adrenergic stimulation. Journal of Applied Physiology, 117(3), 214–222. doi: 10.1152/japplphysiol.00191.2014
- Le Meur, Y., Pichon, A., Schaal, K., Schmitt, L., Louis, J., Gueneron, J., … Hausswirth, C. (2013). Evidence of parasympathetic hyperactivity in functionally overreached athletes. Medicine & Science in Sports & Exercise, 45(11), 2061–2071. doi: 10.1249/MSS.0b013e3182980125
- Lucía, A., Hoyos, J., Santalla, A., Earnest, C., & Chicharro, J. L. (2003). Tour de France versus Vuelta a España: Which is harder? Medicine & Science in Sports & Exercise, 35(5), 872–878. doi: 10.1249/01.MSS.0000064999.82036.B4
- Meeusen, R., Duclos, M., Foster, C., Fry, A., Gleeson, M., Nieman, D., … Urhausen, A. (2013). Prevention, diagnosis, and treatment of the overtraining syndrome: Joint consensus statement of the European College of Sport Science and the American College of Sports Medicine. Medicine & Science in Sports & Exercise, 45(1), 186–205. doi: 10.1249/MSS.0b013e318279a10a
- Meeusen, R., Duclos, M., Gleeson, M., Rietjens, G., Steinacker, J., & Urhausen, A. (2006). Prevention, diagnosis and treatment of the overtraining syndrome. European Journal of Sport Science, 6(1), 1–14. doi: 10.1080/17461390600617717
- Rodríguez-Marroyo, J. A., Villa, J. G., Pernía, R., & Foster, C. (2017). Decrement in professional cyclists’ performance after a Grand Tour. International Journal of Sports Physiology and Performance, 12(10), 1348–1355. doi: 10.1123/ijspp.2016-0294
- Schmikli, S. L., de Vries, W. R., Brink, M. S., & Backx, F. J. G. (2012). Monitoring performance, pituitary-adrenal hormones and mood profiles: How to diagnose non-functional over-reaching in male elite junior soccer players. British Journal of Sports Medicine, 46(14), 1019–1023. doi: 10.1136/bjsports-2011-090492
- Steinacker, J. M., Lormes, W., Reissnecker, S., & Liu, Y. (2004). New aspects of the hormone and cytokine response to training. European Journal of Applied Physiology, 91, 382–391. doi: 10.1007/s00421-003-0960-x
- ten Haaf, T., van Staveren, S., Oudenhoven, E., Piacentini, M. F., Meeusen, R., Roelands, B., … de Koning, J. J. (2017). Prediction of functional overreaching from subjective fatigue and readiness to train after only 3 days of cycling. International Journal of Sports Physiology and Performance, 12(S2), 87–94.
- Urhausen, A., & Kindermann, W. (2002). Diagnosis of overtraining: What tools do we have? Sports Medicine, 32(2), 95–102. doi: 10.2165/00007256-200232020-00002