
ABSTRACT
This study aims to (a) quantify the movement patterns during rugby league match-play and (b) identify if differences exist by levels of competition within the movement patterns and units through the sequential movement pattern (SMP) algorithm. Global Positioning System data were analysed from three competition levels; four Super League regular (regular-SL), three Super League (semi-)Finals (final-SL) and four international rugby league (international) matches. The SMP framework extracted movement pattern data for each athlete within the dataset. Between competition levels, differences were analysed using linear discriminant analysis (LDA). Movement patterns were decomposed into their composite movement units; then Kruskal–Wallis rank-sum and Dunn post-hoc were used to show differences. The SMP algorithm found 121 movement patterns comprised mainly of “walk” and “jog” based movement units. The LDA had an accuracy score of 0.81, showing good separation between competition levels. Linear discriminant 1 and 2 explained 86% and 14% of the variance. The Kruskal–Wallis found differences between competition levels for 9 of 17 movement units. Differences were primarily present between regular-SL and international with other combinations showing less differences. Movement units which showed significant differences between competition levels were mainly composed of low velocities with mixed acceleration and turning angles. The SMP algorithm found 121 movement patterns across all levels of rugby league match-play, of which, 9 were found to show significant differences between competition levels. Of these nine, all showed significant differences present between international and domestic, whereas only four found differences present within the domestic levels. This study shows the SMP algorithm can be used to differentiate between levels of rugby league and that higher levels of competition may have greater velocity demands.
Highlights
This study shows that movement patterns and movement units can be used to investigate team sports through the application of the SMP framework
One hundred and twenty-one movement patterns were found to be present within rugby league match-play, with the walk- and jog-based movement units most prevalent. No movement pattern was unique to a single competition level.
Further analysis revealed that the majority of movement units analysed had significant differences between international and domestic rugby league, whereas only four movement units (i.e. f,m,n,q) had significant differences within the two domestic rugby league levels.
International rugby league had higher occurrences of the movement patterns consisting of higher velocity movement units (ie. T,S,y). This suggests that international rugby league players may need greater high velocity exposure in training.
Introduction
Capturing the movement patterns of team-sport athletes during competition is important to understand the characteristics of a match. A greater understanding of these movement patterns can advance training programmes by improving training specificity. This may be beneficial for the development of technical skills while replicating the demands of a match (Whitehead et al., Citation2020) or during rehabilitation and return to play following an injury. Likewise, a greater understanding of the differences between levels of competition could help to optimise an athlete’s preparation (e.g. transition from domestic to international matches) and long-term development.
In order to quantify the physical characteristics of different sporting codes, micro-technologies (e.g. global positioning systems [GPS], accelerometers, magnetometers, and gyroscopes) have been used extensively in recent literature (Glassbrook et al., Citation2019; Whitehead et al., Citation2018). These technologies provide practitioners with information regarding the external load an athlete has experienced (Gallo et al., Citation2015; Roe et al., Citation2016) and are commonly utilised within team sport settings (West, Citation2020). GPS devices provide positional data that when processed further produces information regarding locomotive outcomes (Benson et al., Citation2020). These devices provide practitioners with a relative ease of use and generate data that can be used to inform training prescription (Kupperman & Hertel, Citation2020).
Research quantifying the characteristics of rugby league match-play has typically reported a small number of external load variables using GPS (Kupperman & Hertel, Citation2020), and reports data per whole match, per half or averages the values per minute (Dalton-Barron, Palczewska et al., Citation2020). More recently, the peak demands (e.g. highest average speed for a predefined epoch) have also been quantified (Glassbrook et al., Citation2019; Weaving et al., Citation2019; Whitehead et al., Citation2018). There is limited research within international RL, with Rennie et al. (Citation2020) investigating the locomotor characteristics of an international team during a World Cup, reporting slightly higher locomotor demands to that of a domestic rugby league.
External load from GPS is typically reported as volumes (e.g. total distance), subsetted threshold values (e.g. distance covered above specific speed thresholds) or duration-based volumes (e.g. distance covered per minute). These variables are often subjectively chosen (i.e. speed thresholds), non-specific (i.e. non-individualised) and are simply numeric descriptors of a series of physical actions (Dalton-Barron, Whitehead et al., Citation2020). These data do not capture and reflect the true external load completed (i.e. the volume of physical exercise and biomechanical stress) (Vanrenterghem et al., Citation2017), and provide little context on how the external load was accumulated. For example, the specific running angles, acceleration values and running velocities that occurred alongside potential temporal effects on them. As such, these data only have a limited application when it comes to enhancing training specificity (Gamble, Chia, & Allen, Citation2020). One area that may offer further insights in this regard involves the use of data mining and pattern recognition techniques to discover the movement patterns of athletes (White, Palczewska, Weaving, Collins, & Jones, Citation2021).
White et al. (Citation2021) proposed the sequential movement pattern (SMP)-mining framework, where pattern recognition is used to extract movement patterns from GPS data. These movement units are comprised of velocity, acceleration and turning angle data calculated from the GPS coordinates, obtained from commercially available microtechnology devices. These movement units are then aligned chronologically to give movement patterns. The use of these movement patterns may allow researchers and practitioners to better understand an athlete’s training needs (e.g. movement patterns as well as velocity derived external load measures), optimising training, rehabilitation and performance outcomes within team sports. To date, this framework has not been applied to team sports. Therefore, the aim of this study was, for the first time, to— i) quantify the movement patterns and movement units during rugby league match-play, utilising the SMP framework and ii) identify if differences exist by levels of competition within the movement patterns and units.
Methods
Study design
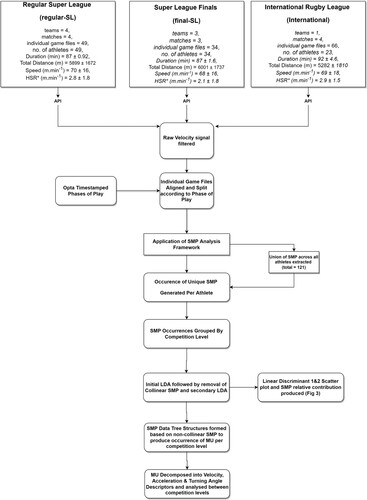
To quantify the movement units and patterns using the SMP framework during the rugby league match-play and to identify the differences by the levels of competition GPS data from the regular Super League (regular-SL), the Super League semi-finals and finals (final-SL) and international competition (International) during 2019, were analysed ( depicts the breakdown of participants, teams competition levels and shows descriptive statistics for each competition level). The regular-SL data included matches from teams that finished the season in the lower half of the Super League table. To ensure that no single team had an adverse effect on the data, teams only featured in one set of match data for either regular-SL or final-SL. For regular-SL and final-SL data, the assigned home team was chosen for analysis to limit any potential effect of the venue. This was not feasible for one semi-final due to insufficient data and the away team was used. To ensure that the league position did not affect the data, these matches were from the first half of the season only.
Figure 1. Methodology Flow Diagram. Values shown in mean ± SD.
Data collection
Players’ GPS data were recorded with the same microtechnology device (Optimeye S5, Catapult Sports, Melbourne, Australia), containing a 10 Hz GPS. The validity and reliability of these devices have been investigated previously (Varley, Elias, & Aughey, Citation2012), data collection was consistent with the methods outlined by Dalton-Barron, Palczewska et al. (Citation2020). No personal data were accessible by the research team and no identifiable data were presented; thus written informed consent was not needed by each participant, thereby conforming with the United Kingdom Data Protection Act, 2018. Ethics approval for the study was granted by the Leeds Beckett University Ethics Committee.
Data preparation
describes the data flow including the steps involved in data preparation, data pre-processing, and statistical analyses. All steps were completed in R (version 3.6.2). For the extraction of the movement patterns, longitude, latitude and raw doppler-derived speed and acceleration for each player were downloaded through Catapult’s proprietary application programming interface (API). To remove erroneous data within each file, sampling points within the speed and acceleration vectors were identified according to previously identified criteria: the number of connected satellites ≤10, horizontal dilution of precision (HDOP) ≥1, velocity >10 m·s−1, acceleration > ±6 m·s−2. Once identified, the erroneous data was removed and replaced with imputed data as outlined by Dalton-Barron, Palczewska et al. (Citation2020). A timeline of individual player actions and match events was provided by Opta (Leeds, UK), and was used to split the match data by ball in play or ball out of play (BOP). The methodology to split the data was the same as used by Rennie et al. (Citation2020). All BOP data were excluded from further analysis preventing non-match play data affecting the movement patterns or units.
The SMP framework (see Supplementary Material 1) was applied to the resulting GPS dataset, giving movement patterns for each player within each match at each competition level (White et al., Citation2021) (see for methodology flow diagram). These movement patterns consist of consecutive movement units aligned chronologically. Following this, the union of movement patterns across all players and within each competition level were extracted. The count of these movement patterns and units were then analysed to identify if differences between competition levels were present (see Supplementary Material 2 for a sample of the final dataset and Supplementary material 3 for distribution of all movement patterns across competition levels.).
Data analysis
To quantify the movement patterns (i.e. aim i), an initial descriptive analysis was performed on the output of the SMP framework (see Supplementary Material 3). A matrix consisting of the count of all movement patterns (total = 121) that were found was built for each player and then aggregated to a competition level. To determine if differences exist by competition level (i.e. aim ii), a dimension reduction and classification technique, linear discriminant analysis (LDA) (Rao, Citation1948) was applied. LDA maximises variance between competition levels while minimising within competition variance. A confusion matrix was used to assess the accuracy of the LDA model in classifying competition levels (Richter, O’Reilly, & Delahunt, Citation2021). The relative contribution of the different movement patterns to the final LDA model was also extracted.
Using the movement patterns identified as the most discriminant between competition levels, a count of the movement units present in these patterns was calculated. Of the 48 movement units (see Supplementary Material 5) used in the SMP framework, 17 were present in the decomposed movement patterns (). These units were then decomposed into velocity, acceleration and a change of the direction descriptors.
Table 1. Differences between movement units at different levels of rugby league competition.
In order to derive the data for the decomposed movement unit, a data-tree structure was used to aggregate the movement unit counts accordingly (data.tree R Package, Glur (2020)), which prevented movement units from being counted multiple times. The movement unit count distributions were initially explored through density plots and showed significant positive skewness. To reduce error from the non-normal distribution, data were log-transformed prior to the analysis. As the data showed a slight negative skewness following transformation, non-parametric analysis methods were utilised. The Kruskal–Wallis (KW) rank sum was used to explore competition level differences. The Dunn post-hoc testing was conducted with the significance level set to p = 0.05. The magnitude of differences between competition levels was calculated by effect sizes. The magnitude of effects was classed as Cohen’s d; trivial <0.2, small = 0.20–0.59, moderate = 0.60–1.19, large = 1.2–1.99, and very large >2.0.
Results
One hundred and twenty-one unique movement patterns were discovered across all competition levels of RL and no movement pattern was unique to a single competition level (see Supplementary Material 3). The most common movement patterns included combinations of the g,e,v, u, n, m movement units, also with I and j often present. These all involve either “walk” or “jog” as their velocity descriptors, “acceleration” or “deceleration” as acceleration descriptors and “straight” or “acute-change” as turning angle descriptors (see Supplementary Material 6).
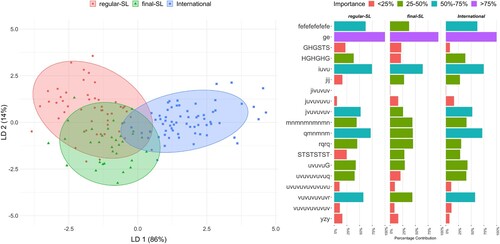
The LDA was developed in a stepwise process by removing the collinear movement patterns based on the Pearson Threshold value of 0.79. The final LDA model was developed on the resulting 19 movement patterns [using the “lda” function from the MASS package (Venables & Ripley, Citation2002)]. Collinear movement patterns were removed (102 movement patterns removed, 19 retained) in a stepwise process with a Pearson’s R threshold value of 0.79 resulting in the highest LDA accuracy value (0.81). International showed a low false-negative and high true positive rate (see Supplementary Material 4 for confusion matrix). This LDA resulted in two linear discriminants (LD), which explained 100% of the variance between competition levels. shows the scatter plot output of the LDA with the variance explained by the two LD included and the relative contribution of the analysed movement patterns. The plot indicates that there is a separation between international and regular-SL/final-SL for LD1, and LD2 shows separation between regular-SL and final-SL al. It also shows “ge” was the movement pattern that offered the highest contribution to separate the competition levels. Although both regular-SL and international had six movement patterns that provided 75% or higher contribution to the outcome, final-SL only had two movement patterns above it.
Figure 2. Scatter plot of LDA output showing the percentage of variance explained by LD 1 & 2, positioning of the competition levels according to LD1 & LD2, and the percentage contribution of the different movement patterns to the LDA output.
shows the results of the KW test on the movement units, with significant differences present between competition levels, for 9 out of the 17 movement units analysed. also shows the Dunn post-hoc differences between competition levels, for the nine movement units identified by the above KW test along with effect size magnitudes. Of the nine movement units analysed, all showed significant differences between international and regular-SL, with three (“e”, “g”, “h”) showing differences between international and final-SL. Four movement units (“f”, “m”, “n”, “q”) showed differences with the two domestic RL groups, regular-SL and final-SL.
Discussion
This is the first study to quantify movement patterns and units within rugby league and to investigate the differences between competition levels during rugby league matches. One hundred and twenty-one unique movement patterns were discovered across all competition levels of rugby league. No pattern was unique to a single competition level. There were small differences found between the play-off domestic rugby league matches and international rugby league (i.e. final-SL and international), whereas significant differences were observed between the regular domestic rugby league (regular-SL) and both international and play-off domestic rugby league matches (final-SL and international). For the first time, this study provides an insight into how sports science can move beyond volumes, subsetted threshold values or duration-based volumes, as the main output from GPS systems. The SMP framework provides an insight into the sequences of movement patterns during a match, which leads to the accumulation of external load; thus increasing the overall understanding of the specific demands of a sport. This provides more information to improve the specific movement needs of a sport, which cannot be established from velocity-derived GPS data alone.
For the first time, this study showed that “walk” and “jog” based movement patterns are most prevalent; this may indicate that differences between the competition levels occur within movement patterns of an apparent low intensity (). Similarly, shows that the movement patterns that had the highest contribution to the LDA were also comprised of these low intensity movement units. Due to the granularity of the GPS signal (10 Hz), movement patterns consisting of low intensity movement units may occur immediately pre/post-, or during high intensity events such as contacts or evasive running (e.g. line-breaks). During these events, an athlete’s velocity will decrease considerably for a very small space of time (Dos’Santos, Thomas, & Jones, Citation2021). Aligning these patterns with event-based data to identify when these movement patterns occur within the match, will allow for a greater understanding of the match demands. This may allow for the manipulation of rules within game-based training to recreate specific movement patterns found to be present at key moments (e.g. defensive sets and line-breaks) within the sport.
Figure 3. Movement units decomposed into velocity, acceleration and turning angle descriptors and between level analysis of descriptors with p-values and effect size magnitudes shown(es).
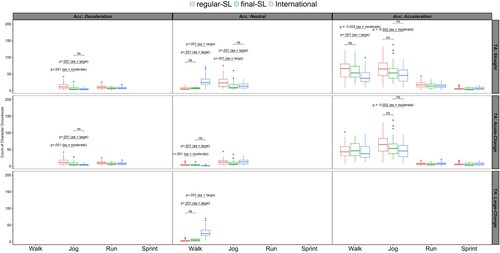
The actions identified in the movement patterns that show significant differences between competition levels typically occur at low velocities (i.e. “walk” & “jog”) and low turning angles (i.e. straight-line or acute angles/>10 degrees & <45 degrees), whereas acceleration descriptors range from deceleration to acceleration (see ). This is in agreement with the findings of Dalton-Barron, Palczewska et al. (Citation2020) who showed that across a full rugby league match, there is a large amount of time spent at low velocities. However, as shows, international has less occurrences of “walk” descriptors, except for at large turning angles. As shows, when comparing between competition levels, the majority of movement units with significant differences present occur between international and regular-SL or regular-SL and final-SL, with a minority of them occurring between final-SL and international. The differences between competition levels are in line with findings by Rennie et al. (Citation2020), who showed peak locomotor values to be higher in international competition than in domestic rugby league. This study builds on the findings of Rennie et al. (Citation2020) by identifying which specific movement patterns are more prevalent in international competition, thereby giving practitioners an insight into how best to replicate match demands in training.
Through the extraction of movement patterns, more variation in movement unit occurrences was observed in both regular-SL and final-SL, at low velocities and turning angles (); however, this changes to more variation present in international at greater velocities and turning angles. This may indicate that within international rugby league, there are more opportunities for intense actions, during a match-play. This in turn suggests that such actions are more necessary when preparing athletes to compete at international level than at lower competition levels. The identification of the movement patterns and understanding of the match events will help to develop our understanding of the specific demands of rugby league. By further breaking down these movement patterns into relevant groupings (i.e. positional, age-grades, competition levels) practitioners can better replicate match demands from a movement pattern perspective—which in turn allows athletes to be better prepared to compete in rugby league from a positional basis, and also to prepare themselves to compete at higher levels of the sport.
As a single international team supplied data, compared to the four regular-SL teams and three final-SL teams, variation present within regular-SL and final-SL data may be due to differing tactical approaches and/or a more diverse player profile. These may have created more variation with the movement patterns, whereas a single team is likely to have less variation present between the matches. While this may be a limitation within this study, from a practical perspective, it shows that the SMP framework is sensitive to differing tactical approaches and the effect this can have on movement patterns. Similarly, the diverse competitive nature of the matches involved at each competition level may have influenced the movement patterns. Regular-SL matches took place during a league-based format, final-SL matches were during a knock-out phase of a domestic league and the international matches were during an end-of-season tour. This may also have been a factor in the reduced differences present between final-SL and international. Similarly, the match outcome was not taken into consideration within this research and may have been an influence on the movement patterns that presented. Further research into the application of the SMP framework within rugby league and team sports, more broadly, should explore the context within which different movement patterns present themselves (e.g. match events [tries, tackles, line breaks etc.], winning/losing team) along with how well training currently replicates the match demands.
The use of microtechnology in sports science has led to a large body of research investigating their use in quantifying external training load (Kupperman & Hertel, Citation2020). Many of these have utilised similar metrics (e.g. distances, accelerations, decelerations, sprints) or derivatives of these metrics with the methods and sport in question being the only differing factors. This has led to the only source of novelty within this area coming from the analysis carried out on these data rather than exploring potential new data to utilise. Within rugby league, McLellan, Lovell, and Gass (Citation2011) was the first study utilising microtechnology to quantify external load. Following this, there was a shift – both in research and applied practice – from the use of video analysis to quantify external load to microtechnologies. Several studies utilised similar methodologies to McLellan until Varley et al. (Citation2012) and Delaney et al. (Citation2015) looked at duration specific running intensities (e.g. m min−1) of team-sport match-play. This was further expanded to include acceleration-based metrics in Delaney et al. (Citation2016). These methodologies have now been accepted both in research and applied practice (Whitehead et al., Citation2018). While these approaches increase our understanding of the magnitude of external load accumulated by players, they fail to give insight into how this is accumulated (i.e. turning angles, velocities, accelerations). This is the first study in team sports looking to utilise microtechnology to quantify how athletes accumulate external training load. By doing so, it has the potential to increase knowledge of the movements underpinning external training load in a rugby league and allow for greater specificity within the training prescription.
Conclusion
This study quantified the different movement patterns and units present within rugby league match-play and how these movement patterns and units differ between competition levels. These movement patterns and units were largely comprised of low velocity and low turning angle movements. Further analysis of these movement patterns showed that significant differences were present between competition levels. These differences were primarily found between international and domestic rugby leagues. International rugby league had less occurrences of low velocity movement patterns along with higher occurrences of high velocity movement patterns, when compared to domestic rugby league. This suggests a greater need for high velocity movement patterns when preparing athletes for international competitions.
Supplemental Material
Download MS Word (804.1 KB)Acknowledgements
No external financial support. Catapult S5 GPS units were used in this research, three of the authors use them as part of their working equipment; NDB previously received research funding from Catapult Sports. We would like to express our gratitude to all coaches and practitioners within all Super League clubs who supported the project.
Disclosure statement
No potential conflict of interest was reported by the author(s).
Additional information
Funding
References:
- Benson, L. C., Räisänen, A. M., Volkova, V. G., Pasanen, K., & Emery, C. A. (2020). Workload a-WEAR-ness: Monitoring workload in team sports with wearable technology. A scoping review. Journal of Orthopaedic & Sport Physical Therapy, 50(10), 549–563. doi:10.2519/jospt.2020.9753
- Dalton-Barron, N., Palczewska, A., McLaren, S. J., Rennie, G., Beggs, C., Roe, G., & Jones, B. (2020). A league-wide investigation into variability of rugby league match running from 322 Super League games. Science and Medicine in Football, 1–9. doi:10.1080/24733938.2020.1844907
- Dalton-Barron, N., Whitehead, S., Roe, G., Cummins, C., Beggs, C., & Jones, B. (2020). Time to embrace the complexity when analysing GPS data? A systematic review of contextual factors on match running in rugby league. Journal of Sports Sciences, 38(10), 1161–1180. doi:10.1080/02640414.2020.1745446
- Delaney, J. A., Duthie, G. M., Thornton, H. R., Scott, T. J., Gay, D., & Dascombe, B. J. (2016). Acceleration-based running intensities of professional rugby league match play. International Journal of Sports Physiology and Performance, 11(6), 802–809. doi:10.1123/ijspp.2015-0424
- Delaney, J. A., Scott, T. J., Thornton, H. R., Bennett, K. J. M., Gay, D., Duthie, G. M., & Dascombe, B. J. (2015). Establishing duration-specific running intensities from match-play analysis in rugby league. International Journal of Sports Physiology and Performance, 10(6), 725–731. doi:10.1123/ijspp.2015-0092
- Dos’Santos, T., Thomas, C., & Jones, P. A. (2021). The effect of angle on change of direction biomechanics: Comparison and inter-task relationships. Journal of Sports Sciences. doi:10.1080/02640414.2021.1948258
- Gallo, T., Cormack, S., Gabbett, T., Williams, M., & Lorenzen, C. (2015). Characteristics impacting on session rating of perceived exertion training load in Australian footballers. Journal of Sports Sciences, 33(5), 467–475. doi:10.1080/02640414.2014.947311
- Gamble, P., Chia, L., & Allen, S. (2020). The illogic of being data-driven: Reasserting control and restoring balance in our relationship with data and technology in football. Science and Medical in Football, 4(4), 338–341. doi:10.1080/24733938.2020.1854842
- Glassbrook, D. J., Doyle, T. L. A., Alderson, J. A., & Fuller, J. T. (2019). The demands of professional rugby league match-play: A meta-analysis. Sport Medicine - Open, 5(1). doi:10.1186/s40798-019-0197-9
- Kupperman, N., & Hertel, J. (2020). Global positioning system–derived workload metrics and injury risk in team-based field sports: A systematic review. Journal of Athletic Training, 55(9), 931–943. doi:10.4085/1062-6050-473-19
- McLellan, C. P., Lovell, D. I., & Gass, G. C. (2011). Performance analysis of elite rugby league match play using global positioning systems. Journal of Strength and Conditioning Research, 25(6), 1703–1710. doi:10.1519/JSC.0b013e3181ddf678
- Rao, C. R. (1948). The utilization of multiple measurements in problems of biological classification. Journal of the Royal Statistical Society Series B, 10(2), 159–193. doi:10.1111/j.2517-6161.1948.tb00008.x
- Rennie, G., Dalton-Barron, N., McLaren, S. J., Weaving, D., Hunwicks, R., Barnes, C., … & Jones, B. (2020). Locomotor and collision characteristics by phases of play during the 2017 Rugby League World Cup. Science and Medicine in Football, 4(3), 225–232. doi:10.1080/24733938.2019.1694167
- Richter, C., O’Reilly, M., & Delahunt, E. (2021). Machine learning in sports science: Challenges and opportunities. In Sports Biomechanics, 1-7. Routledge. doi:10.1080/14763141.2021.1910334
- Roe, G., Halkier, M., Beggs, C., Till, K., & Jones, B. (2016). The use of accelerometers to quantify collisions and running demands of rugby union match-play. International Journal Performance Analysis in Sport, 16(2), 590–601. doi:10.1080/24748668.2016.11868911
- Vanrenterghem, J., Nedergaard, N. J., Robinson, M. A., & Drust, B. (2017). Training load monitoring in team sports: A novel framework separating physiological and biomechanical load-adaptation pathways. Sport Medicine, 47(11), 2135–2142. doi:10.1007/s40279-017-0714-2
- Varley, M. C., Elias, G. P., & Aughey, R. J. (2012). Current match-analysis techniques’ underestimation of intense periods of high-velocity running. International Journal of Sports Physiology and Performance, 7(2), 183–185. doi:10.1123/ijspp.7.2.183
- Venables, W. N., & Ripley, B. D. (2002). Modern applied statistics with S (4th ed.). New York: Springer. ISBN 0-387-95457-0.
- Weaving, D., Sawczuk, T., Williams, S., Scott, T., Till, K., Beggs, C., … Jones, B. (2019). The peak duration-specific locomotor demands and concurrent collision frequencies of European Super league rugby. Journal of Sports Sciences, 37(3), 322–330. doi:10.1080/02640414.2018.1500425
- West, S. (2020). More than a metric : How training load is used in elite sport for athlete management authors what can we use training load data for ? Models for Framing Training Load Management. doi:10.1055/a-1268-8791
- White, R., Palczewska, A., Weaving, D., Collins, N., & Jones, B. (2021). Sequential movement pattern-mining (SMP) in field-based team-sport: A framework for quantifying spatiotemporal data and improve training specificity? Journal of Sports Sciences. doi:10.1080/02640414.2021.1982484
- Whitehead, S., Till, K., Jones, B., Beggs, C., Dalton-Barron, N., & Weaving, D. (2020). The use of technical-tactical and physical performance indicators to classify between levels of match-play in elite rugby league. Science and Medicine in Football. doi:10.1080/24733938.2020.1814492
- Whitehead, S., Till, K., Weaving, D., & Jones, B. (2018). The use of microtechnology to quantify the peak match demands of the football codes: A systematic review. Sports Medicine, 48(11), 2549–2575. doi:10.1007/s40279-018-0965-6