
ABSTRACT
Exercise is positively associated with higher microbial diversity, but there is limited information on exercise intensity's effect on gut microbiome composition and function in clinical populations. This study examines whether different intensities of exercise exert differential effects on gut microbiome composition and function in low active people with type 2 diabetes. This is a sub-study of the Exercise for Type 2 Diabetes Study, a single centre, prospective, randomised controlled trial. Participants (n = 12) completed 8-weeks of combined aerobic and resistance moderate intensity continuous training (C-MICT) or combined aerobic and resistance high-intensity interval training (C-HIIT). Faecal samples were collected before and after intervention to measure gut microbiome composition and metabolic pathways (metagenome shotgun sequencing) and short-chain fatty acids. Post-exercise α-diversity was different between groups as was the relative abundance of specific taxa was (p < .05). Post-exercise relative abundance of Bifidobacterium, A. municiphila, and butyrate-producers Lachnospira eligens, Enterococcus spp., and Clostridium Cluster IV were higher at lower exercise intensity. Other butyrate-producers (from Eryspelothrichales and Oscillospirales), and methane producer Methanobrevibacter smithii were higher at higher exercise intensity. Pyruvate metabolism (ko00620),COG “Cell wall membrane envelope biogenesis” and “Unknown function” pathways were significantly different between groups and higher in C-MICT post-exercise. Differential abundance analysis on KO showed higher expression of Two-component system in C-HIIT. Transcription factors and “unknown metabolism” related pathways decreased in both groups. There were no significant between group changes in faecal short chain fatty acids. Exercise intensity had a distinct effect on gut microbiome abundance and metabolic function, without impacting short-chain fatty acid output.
Highlights
Evidence of exercise effect on gut microbiome outcomes is limited to healthy and athletic populations
In low active people with type 2 diabetes, different exercise intensities increased specific health promoting and butyrate producers species, and showed differentially abundant gut microbiome metabolic pathways.
Further investigation is warranted, and if this supports the present findings, then specific exercise intensities may be promoted to target specific species and optimise gut health.
Introduction
Interest in the gut microbiome has increased in recent years, given its role in determining health and disease status (Canfora, Meex, Venema, & Blaak, Citation2019). While it is well known that gut microbiome composition is both inherited and mostly modulated by diet, emerging evidence suggests regular exercise is associated with higher microbial diversity and health promoting taxa (Barton et al., Citation2018; Zhao et al., Citation2018). To date, most exercise and gut microbiome studies have included only healthy or athletic populations, or only reported on specific bacterial species (Ortiz-Alvarez, Xu, & Martinez-Tellez, Citation2020). Thus, there is limited information on the effect of exercise on gut microbiome composition and metabolic function in clinical populations.
The mechanism by which exercise and gut are related is yet to be fully elucidated. It is likely to be driven by microbial butyrate and exercise induced intestinal barrier function changes, in a cross-talk mechanism between gut microbiome and mitochondrial function (Caron et al., Citation2014 Clark & Mach, Citation2017; Gao et al., Citation2009 Vargas-Ortiz, Pérez-Vázquez, & Macías-Cervantes, Citation2019;). Butyrate could induce PGC-1α gene expression in muscle mitochondria, which can improve respiratory capacity and fatty acid oxidation (via AMPK-ACC pathway) (Gao et al., Citation2009). In turn, exercise induces mitochondrial oxidative capacity and SIRT1 expression (Vargas-Ortiz et al., Citation2019), which signals enterocyte proliferation and increase intestinal barrier function, potentially affecting gut microbiome composition (Caron et al., Citation2014).
In a cross-sectional study in healthy participants, using 16S rRNA sequencing, faecal butyrate concentrations were strongly associated with cardiorespiratory fitness, and with butyrate-producing bacteria (i.e. Clostridiales, Roseburia, Lachnospiraceae, and Erysipelotrichaceae) (Estaki et al., Citation2016). Similarly, intervention studies reported exercise increased butyrate-producing bacteria (e.g. Clostridia (order); Lachnospira (family); Akkermansia, Blautia, Roseburia, Bifidobacterium (genus); Faecalibacterium prausnitzi sp.) and faecal butyrate concentrations, both in animal models (Lambert et al., Citation2015) and humans (Allen et al., Citation2018). These findings however were not replicated when using shotgun metagenomics, a more in-depth sequencing analysis (Cronin et al., Citation2018), While human evidence seems to support an exercise-gut microbiome axis, this is currently limited to healthy or athletic populations (Ortiz-Alvarez et al., Citation2020).
The benefits of higher exercise intensities on cardio-metabolic disease outcomes in clinical populations is well documented (Weston, Wisloff, & Coombes, Citation2014), but except from one recent study (Motiani et al., Citation2020), none of these studies have included gut microbiome outcomes. In people with T2D, Motiani and colleagues showed that higher intensity interval exercise (4–6 × 30s all-out cycling bouts) increased the abundance of the Lachnospira genus compared with moderate intensity continuous exercise (60% V̇O2peak), while Clostridium genus decreased in both (Motiani et al., Citation2020). However, the effect of such intensities on the gut microbiome’s metabolic function and metabolites were not investigated, as their study was limited by the use of 16s rRNA sequencing. Given the limited evidence, it is important to understand whether different exercise intensities could increase beneficial bacteria and their metabolites to improve metabolic health in a clinical population.
The aim of this study was to examine whether different intensities of exercise exert differential effects on gut microbiome composition and function in low active people with T2D, using shotgun metagenome sequencing. Our primary outcome was to assess changes in gut microbiome composition and function, while our secondary outcome explored whether changes in gut microbiome composition and function were associated with or confounded by clinical changes (diet, anthropometric and clinical markers). We hypothesised that higher intensity exercise would result in a higher abundance of butyrate-producing species because of the increased physiological demands.
Methods
The present study is a sub-study of the Exercise for Type 2 Diabetes (E4D) Study. Briefly, the E4D Study aimed to compare the effect of resistance training plus moderate intensity continuous or high-intensity interval aerobic training on glycaemic control in low active people with T2D. The study was a single centre, prospective, randomised controlled trial completed at the School of Human Movement and Nutrition Sciences, The University of Queensland, Brisbane, Australia. The University of Queensland Human Research Ethics Committee provided ethical approval (reference number 2015000164) and the trial was registered with the Australian New Zealand Clinical Trials Registry (reg no. ACTRN12615000475549). All individuals included in this sub-study provided written informed consent prior to participation.
Study design
Fourteen participants volunteered for this sub-study and were randomised into one of the two exercise groups. The main trial inclusion and exclusion criteria are shown in Supplementary materials and summarised here. Participants required written confirmation of their T2D disease from their general practitioner (GP) and either a glycated haemoglobin level of ≥6.0% or fasting glucose level of ≥7.0 mmol/L to be included. Participants were required to have stable medication and bodyweight (<5 kg difference) in the three months preceding enrolment, and not meeting the national physical activity guidelines of 150 minutes/week of moderate intensity, or 75 minutes/week of vigorous intensity (low active). Participants were excluded from the main trial if they had any of the conditions outlined by the American College of sports Medicine guidelines, and from this sub-study if they were taking antibiotics medication in the past 3 months or had any gastrointestinal inflammatory condition. Of these, 12 (age 64.3 ± 6.4 y) with confirmed T2D (duration 7.8 ± 6.3y; HbA1c 8.5 ± 1.5%) completed the 8-week exercise intervention. Following the completion of baseline testing, participants were randomised on a 1:1 pattern to C-HIIT or C-MICT using a computer generated sequence by and external member to the research team.
The C-HIIT group trained for 26 minutes three times per week (78 minutes/week) on non-consecutive days. Each session consisted of an aerobic warm-up for three minutes at 50–60% of HRpeak before completing four minutes of high-intensity aerobic exercise (85–95% of HRpeak). The goal was to reach the target HR zone within the first two minutes. A 1-minute rest period followed and then 8 × 1-minute intervals of high-intensity resistance exercise with each interval separated by one minute of rest, before a cool-down for three minutes at 50–60% of HRpeak. Each resistance exercise was completed at a rating of perceived exertion (RPE; BORG 6–20 scale) of ≥ 17 (very hard) with participants completing as many repetitions (at least five; aiming for 10–25) as possible within each 1-minute bout while maintaining correct form. Each session ended with a, aerobic cool-down for three minutes at 50–60% of HRpeak.
Those in MICT trained for 52.5 minutes four times per week – two sessions incorporating both aerobic and resistance training, and two sessions involving aerobic training only, for an exercise duration of 210 minutes/week. For the combined session, participants completed 22 minutes and 30 seconds of aerobic exercise at 55–69% of HRpeak followed by 30 minutes of resistance-type exercises at a moderate intensity (RPE 11-13; fairly light to somewhat hard). The resistance-based exercises were identical to HIIT and completed in the same order except prescription was for two sets of ten of each exercise with each set separated by a one-minute rest period. For the two aerobic-only sessions, participants completed 52 minutes and 30 seconds of aerobic exercise only at 55–69% of HRpeak. This MICT program is comparable with the current recommendations for people with T2D (Hordern et al., Citation2012).
The mode of aerobic exercise in both group (treadmill, upright bike, recline bike) was determined by an Accredited Exercise Physiologist (AEP), before the baseline cardiopulmonary exercise test. The preferred mode for aerobic exercise was treadmill, though bikes were used for those with orthopaedic limitations. The types of resistance-based exercises involved a combination of machine-based, bodyweight, and free-weight exercises. The order the exercises were completed was: (1) leg press, (2) chest press, (3) leg press repeated, (4) seated row, (5) calf raises, (6) shoulder press, (7) abdominal crunch, and (8) bicep curls. The novel C-HIIT protocol was designed to be completed in one third of the time of the current exercise training recommendations (C-MICT), and therefore C-HIIT and C-MICT were not energy matched.
More details on study design and training protocols can be found in Supplementary material and previous work (Cox et al., Citation2020). Two participants did not complete the study due to medical reasons unrelated to the trial interventions. There were no significant differences in demographic, physical or clinical characteristics between the dropouts and the completers.
Primary outcome measurements
Faecal sampling and sequencing
Participants were provided with a home test kit to collect faecal samples both at baseline and follow-up. This kit contained 1x swab tube for faecal sample collection for DNA sequencing and analysis (FecalSwabTM, COPAN Italia, Brescia, Italy); and 2x tubes for the collection of >1 g of faecal samples, which was used for the analysis of short chain fatty acids – SCFA (see below). The FecalSwabTM kit contains a swab that is used to collect the necessary amount of sample and a preservative that stabilises DNA and improves extraction yield. Participants were provided with sampling instructions that followed the International Human Microbiome Standards for frozen samples (IHMS SOP 04 V1) (Dore et al., Citation2015). Once participants collected their samples, they were instructed to place them in a provided sealing bag. This bag was then placed into another sealing bag that contained a gel ice pack to keep the samples frozen during transport back to the lab. Participants stored their samples at –20°C straight after collection and returned these to the lab within a week. Once in the lab, all samples were stored at −80°C until analysis.
DNA was extracted from 50 to 200 mg of faecal matter with a preliminary step of bead beating using 0.1 dia. glass beads (BioSpec Products #11079101) on the Powerlyser 24 homogenizer (Mo-Bio #13155) and 750 µl of Bead Solution (Qiagen cat no # 12855-100-BS). Extraction was as per Qiagen DNeasy Powersoil Kit (cat #12888-100). Final elution volume was 50 µl. Libraries were prepared according to the manufacturer’s protocol using Nextera XT Library Preparation Kit (Illumina #FC-131-1096). Nextera XT libraries were pooled at equimolar amounts of 2nM per library to create a sequencing pool. The library pool was quantified in triplicates using the Qubit™ dsDNA HS Assay Kit (Invitrogen). Library QC is performed using the Agilent D1000 HS tapes (#5067-5582) on the TapeStation 4200 (Agilent # G2991AA) as per the manufacturer’s protocol. The library was prepared for sequencing on the NextSeq500 (Illumina) using NextSeq 500/550 High Output v2 2 × 150bp paired end chemistry in the Centre for Ecogenomics, University of Queensland (Brisbane, Australia), according to manufacturer’s protocol. Further details on DNA extraction and sequencing, metagenome assembly, calculation of microbial abundances and functional profiling can be found in Supplementary materials.
Extraction and measurement of faecal SCFA
SCFA were extracted and analysed with Gas chromatography–mass spectrometry GC-MS using a high polarity, polyethylene glycol (PEG), fused silica capillary column DB-WAXetr (30, 0.25 mm id, 0.25 μm film thickness), with helium as carrier gas at 1 mL/min (1 μL splitless mode injection, 250°C) following the procedures described in (García-Villalba et al., Citation2012). Results were expressed as the amount of SCFA in µmol per gram of wet faecal matter (µmol/g). This was corrected for internal standard recovery relative to the amount of internal standard used to establish the standard curve. The amount of each SCFA was then expressed as a relative percentage of the overall SCFA present (µmol/g) in each respective sample.
Secondary outcomes measurements
Secondary outcome measurements included clinical markers (V̇O2peak; glucose and lipid metabolism markers, diet and physical activity). These outcomes were collected to assess whether any changes in gut microbiome composition and function were associated with these variables. If they were, a sensitivity analysis was performed to assess the impact of the secondary outcome/s. At baseline, participants completed a graded continuous exercise test to determine peak oxygen uptake (V̇O2peak), assessed as the mean of the two highest 10-second values attained during the test (where the difference in V̇O2 between values was no greater than 150 mL/min/body mass). The peak heart rate achieved during the test was used to prescribe the intensity during the exercise training program.
Blood from the antecubital vein was used to assess HbA1c with immunoturbidimetric method (Metus et al., Citation1999); and fasting plasma glucose, serum lipid profile (total cholesterol [TC], low-density lipoprotein cholesterol [LDL], high-density lipoprotein cholesterol [HDL], triglycerides [TG]) and plasma high-sensitivity c-reactive protein (hs-CRP) were analysed with manufacturer kits in an automated analyser (Randox RX daytona+, West Virginia, USA). More details on clinical outcomes including blood pressure and anthropometry can be found in Supplementary material.
Participants were asked to maintain their usual physical activity (outside intervention training sessions), medication and dietary habits. At baseline and at 8-weeks, dietary intake was assessed using 24-hour recall method. The 24-hour recalls were analysed using FoodWorks (Xyris, ver. 9, Brisbane, Australia) for energy content and macronutrient distribution. Although we acknowledge prescribing a standardised diet to follow would have controlled for potential diet differences and thus limit this confounder; this approach would have changed participants’ usual diet potentially masking or overestimating the effect of exercise. Instead we analysed dietary data to confirm whether (1) participants changed their diet, and (2) diet affected gut microbiome changes.
Statistical analysis
The sample size calculation for the main study (ACTRN12615000475549) considered change in HbA1c as the main outcome. G*Power was used to calculate 90% statistical power (alpha level 0.05) to detect a change in HbA1c of 0.6%±2.67 between groups, and resulted in a minimum sample size of n = 22 per group. Based on a simulation study, the minimum sample size to detect a taxonomic difference between groups using permutational multivariate analysis of variance (PERMANOVA) with 90% power and effect size ω2 = 0.17 was n = 5 per group (Kelly et al., Citation2015). Data were checked for normality through histograms, q-q plots and Shapiro–Wilk tests (p < .05 indicating significant deviation from normality). Given the sample size and nature of the data, most variables were not normally distributed and were log transformed for analysis. Differences in the microbial community composition between groups were analysed in PAST (ver. 4.03) (Hammer, Harper, & Ryan, Citation2001) using principal component analysis (PCA) and PERMANOVA on centred-log ratio transformed species level abundance data. PCA was calculated with Euclidean distances and bootstrapping (n = 999) to calculate 95% confidence intervals. PERMANOVA was calculated with Euclidean distances and n = 999 permutations.
Significant differences in the α-diversity (Shannon and Simpson indices), species-level relative abundances, clinical outcomes, and the amount of SCFA, between post-exercise groups were evaluated with analysis of covariance (ANCOVA) in SPSS version 26 (IBM Corp, New York, USA). ANCOVA on post-exercise outcomes adjusted for their respective baseline values, was used to account for the large inter-individual variability and effect baseline values can have on the outcome variable (Committee for Medicinal Products for Human Use (CHMP), Citation2015). ANCOVA’s unstandardized residuals were checked for normality, and for those not normally distributed a Mann–Whitney U test was used. Given the exploratory nature of this study, differences between groups were determined based on pair-wise comparisons of adjusted means comparisons of post-intervention values with Bonferroni correction (Tian, Manfei, Justin, Hongyue, & Xiaohui, Citation2018).
For the assessment of metabolic function, KEGG Orthology (KO) IDs were mapped, filtered and tested for differential abundance (pre- versus post-intervention for each group) using the DESeq2 library in R (Love, Huber, & Anders, Citation2014), while KEGG and COG pathways were analysed with MicrobiomeAnalyst web server (Dhariwal et al., Citation2017). KOs with a Benjamini-Hochberg corrected p-value < .1 considered significantly differentially abundant. Relative pathway abundances were analysed with ANCOVA as described above, and also in a non-adjusted analysis to explore the effects of group and time (2 × 2 ANOVA, Supplementary materials).
Sensitivity analyses were conducted on those taxa with relative abundances found to be significantly different between groups post-intervention. To understand whether these differences were affected by confounders, a Spearman’s correlation was conducted with diet and clinical markers variables. Analysis included baseline, post-intervention and change from baseline measurements of these variables. Hierarchical multiple regressions were used to assess whether change in taxa relative abundance was associated with group allocation, independent of dietary and clinical markers.
Results
Participants’ characteristics are shown in Table S1 (Supplementary material). Groups were comparable, though C-MICT had a higher prevalence of females and cardiorespiratory fitness at baseline. There were no adverse effects reported during the trial.
Exercise intensity effects on gut microbiome composition
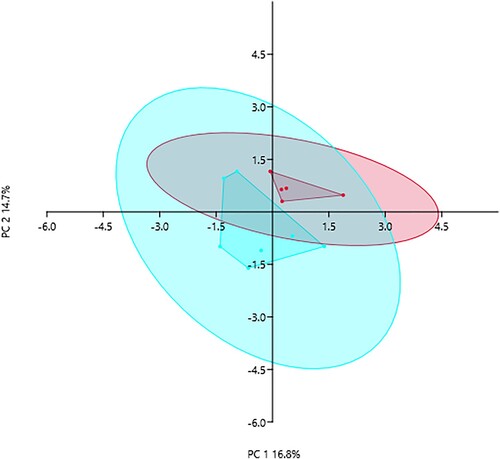
PCA on species level abundances showed that PC1 and PC2 could explain 16.8% and 14.7% of variability between C-HIIT and C-MICT groups after 8-weeks of training (), respectively. PERMANOVA showed community composition was significantly different between groups (p = .037, F = 1.584, n = 999 permutations). There were no significant differences between groups when comparing alpha diversity Shannon H index (adjusted mean difference post-exercise-0.152, 95%CI −0.609, 0.305, p = .466) and evenness Simpson index (adjusted mean difference −0.007, 95%CI −0.033, 0.020, p = .590) (see Figure S1, Supplementary material).
Figure 1. Principal component analysis visualising the variation in microbial community composition after 8-weeks of C-HIIT (red) or C-MICT (blue) training. Convex hulls and 95% confidence ellipses shown (PERMANOVA p = .037, F = 1.584, n = 999 permutations)
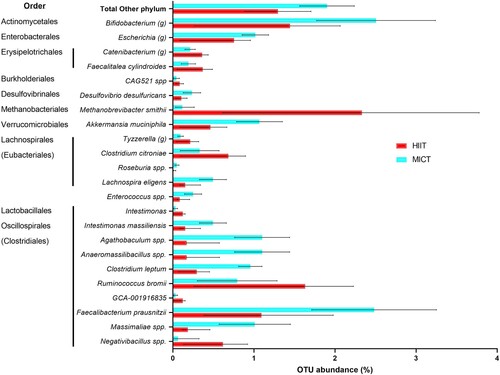
shows significant differences in microbial relative abundances between C-HIIT and C-MICT after 8-weeks of exercise training, based on adjusted means difference. There was a large effect of group allocation (partial eta-square > 0.30) (see Table S2 – Supplementary material). Differences between groups in Tyzzerella (g), Clostridium citroniae, Enterococcus spp. and Faecalibacterium prausnitzii were not significant in the ANCOVA main analysis (omnibus test), but were in the post-hoc pairwise comparisons (see Table S2 – Supplementary material). Compared with C-HIIT, C-MICT resulted in higher abundance of minor phyla (“Other phylum” in , including Verrucomicrobia, Actinobacteria, Desulfobacterota phyla), Bifidobacterium genus, unknown species from Escherichia genus, Lachnospira eligens, unknown species from genera Enterococcus, Agathobaculum, Anaeromassilibacillus, Massimaliae, and Clostridium leptum. C-HIIT showed higher abundance of species from Erysipelotrichales order, Methanobrevibacter smithii, and other Lachnospirales and Oscillospirales including Ruminococcus bromi and unknown species from Nagativibacillus.
Figure 2. Relative abundance of gut microbiome taxa after 8-weeks of C-HIIT or C-MICT. Data shown as post-intervention means adjusted for baseline values with 95% confidence intervals bars, all variables shown are significantly different between groups (ANCOVA with Bonferroni post-hoc test, p < .05).
Exercise intensity effects on gut microbiome function
Faecal concentrations of SCFA before and after C-HIIT or C-MICT are shown in Figure S3 (Supplementary materials). There was no significant change between groups after exercise (adjusted mean difference, 95%CI post-exercise between C-MICT and C-HIIT: 12.51 (−17.45, 42.48) μmol/g acetic acid p = .356; 2.81(−10.27,15.89) μmol/g butyric acid p = .618; −0.43(−3.84, 2.97) μmol/g propionic acid p = .773; 6.11 (−22.21,34.45) μmol/g total SCFA, p = .616). The change in relative abundance of each SCFA was also not significant between C-MICT and C-HIIT (adjusted mean difference, 95%CI post-exercise 8.38% (−6.35, 23.12) acetic p = .213, −3.45% (−27.59, 20.70) butyric p = .739, and −3.96%(−10.20, 2.29) propionic acid, p = .172).
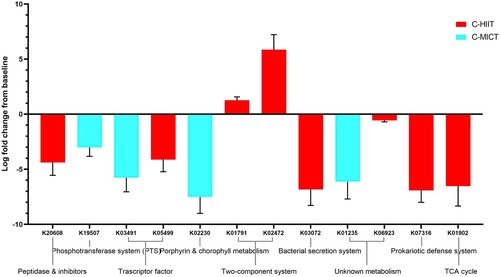
Markers of metabolic pathways were also different between groups. KEGG Orthology (KO) identifiers that were significantly differentially abundant following C-HIIT or C-MICT are shown in (values given as log2 fold change from baseline ± SE). Both groups showed a decrease in KO of unknown metabolism (C-MICT: K01235 alpha-glucuronidase, −6.13 ± 1.57; C-HIIT: K06923 uncharacterised protein, −0.56 ± 0.14) and transcription factors (C-HIIT: K05499 lacl family transcriptional regulator, −4.12 ± 1.10; C-HIIT K03491 lichenan operon transcriptional regulator, −5.76 ± 1.28). Only C-HIIT showed an increase in KOs from the two-component system (cellular signalling) (K01791 UDP-N-acetylglucosamine 2-epimerase 1.27 ± 0.31, and K02472 UDP-N-acetyl-D-mannosaminuronic acid dehydrogenase 5.86 ± 1.37). Peptidase inhibitor (K20608 tetrahedral aminopeptidase, −4.38 ± 1.17), bacterial secretion (K03072 protein translocase subunit SecD −6.84 ± 1.45), defence system (K07316, −6.92 ± 1.08), and TCA cycle (succinate CoA synthase component K01902, −6.53 ± 1.81) KOs all decreased following C-HIIT. Following C-MICT, KOs related to the Phosphotransferase system (K19507 fructoselysine/glucoselysine PTS system EIIB component, −3.02 ± 0.81) and Porphyrin and chlorophyll metabolism (K02230 cobaltochelatase CobN, −7.51 ± 1.49) decreased.
Figure 3. Differential abundance analysis of KEGG Orthology (KO) identifiers for C-HIIT and C-MICT. KOs shown are those significantly differentially abundant post versus pre-intervention for C-HIIT or C-MICT (values given as log2 fold change ± SE).
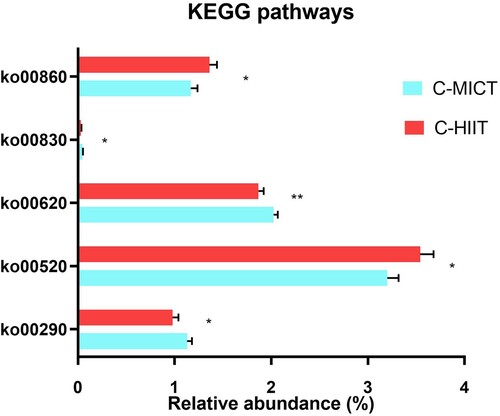
Differences between groups in KEGG pathway abundances after 8-weeks of exercise training are shown in . Pyruvate metabolism (ko00620) was significantly different between groups and higher in C-MICT post-exercise. Butyrate and propionate metabolism were not affected by group allocation, while other pathways investigated were marginally significant. In non-adjusted analysis, there were some associations between group and changes in other amino acid, carbohydrate, cofactors and vitamins, and polyketides metabolism pathways (Table S4, Supplementary material). Relative abundance of COG “Cell wall membrane envelope biogenesis” and “Unknown function” pathways was significantly different between groups after exercise (mean difference C-MICT compared to C-HIIT +0.45% 95%CI −0.10 −1.10, p = .10; and +0.18% 95%CI 0.00,0.36, p = .05; respectively) as shown in Table S5, Supplementary material. All other COG pathways investigated were not significantly different between groups, with some showing a significant change over time.
Figure 4. KEGG pathway relative abundances after 8-weeks of C-HIIT or C-MICT training. Data are shown as post-intervention means adjusted for baseline values with standard error bars. Variables shown are significantly different between groups **p = .05, * p < .10 (ANCOVA with Bonferroni post-hoc test).
Associations between gut microbiome and secondary outcomes changes (diet and clinical markers)
There were no significant differences in diet and clinical markers between groups after 8-weeks of training, including fasting glucose, HbA1c, lipid profile, hs-CRP, diet and cardiorespiratory fitness (Group*time interaction, Table S3, Supplementary material). Post-hoc analysis revealed a significant mean difference between C-MICT and C-HIIT post-intervention fibre intake, when adjusted for baseline fibre intake (+7.05 g/day 95%CI 1.5-12.6, p = .019). As fibre intake was the only variable that significantly differed between groups, sensitivity analyses were used to explore whether fibre intake influenced observed gut microbiome composition changes.
Sensitivity analysis
Sensitivity analyses were conducted with those taxa shown to be significantly differentially abundant between groups, to test whether changes were independent of dietary fibre intake. We conducted hierarchical multiple regressions including variables correlated with changes in specific taxa. We found fibre intake was an independent predictor of changes in Massimaliae spp. (B = 0.055, 95%CI 0.028, 0.082, p = .02). This model also included baseline HDL and group, and the addition of change in fibre intake improved the model by 30%. Baseline levels of HDL were also an independent predictor of this taxon (B = 0.902, 95% CI 0.458, 1.345, p = .001). Fibre intake was not an independent predictor in the other taxa.
Discussion
We found that over an 8-week training intervention, exercise intensity had differing effects on the abundance of specific gut microbiome taxa and function in low active people with T2D. These changes were not associated with medication, dietary and clinical factors. Moderate intensity and longer duration of exercise, as completed by those in C-MICT, resulted in increased Bifidobacterium and Escherichia genera, A. municiphila, and butyrate-producing taxa from orders Lachnospirales (Eubacteriales) (L. eligens), Enterococcus spp., and Clostridium Cluster IV (including C. leptum, F. prausnitzi). Other butyrate producing species from orders Eryspelothrichales and Oscillospirales (R. bromii), and methane producer M.smithii increased following a higher intensity of exercise (C-HIIT). Metabolic pathways in the amino acid, carbohydrate, cofactors and vitamins, and polyketides metabolism categories differed between groups. However, there were no significant between group changes in gut microbiome metabolites (SCFA) or clinical markers, including cardiorespiratory fitness. In contrast to our hypothesis, both intensities promoted butyrate-producing bacteria with MICT increasing slightly more of these species.
Changes in taxa relative abundance observed in our study agree with current evidence suggesting exercise increases butyrate-producing bacteria (Ortiz-Alvarez et al., Citation2020) These included F. cylindroides (family Erysipelotrichaceae) and R. bromii (Oscillospirales), which were higher in C-HIIT than C-MICT post-exercise. The former family was previously shown to be associated with cardiorespiratory fitness (Estaki et al., Citation2016) but not with physical activity levels (Bressa et al., Citation2017). Interestingly, we observed an increased in R. bromii, which is an acetate producer but cross-feeder to butyrate-producing bacteria (Crost et al., Citation2018), whose family Oscillospirales increased in older adults following 5-weeks of endurance exercise (Taniguchi et al., Citation2018). Increased Methanobrevibacter and Negativibacilli spp in C-HIIT compared with C-MICT, are in line with studies on exercise training in mice (Estaki et al., Citation2020; Lambert et al., Citation2015). The former might be beneficial in T2D as methanogenic bacteria could reduce circulating trimethylamine oxide (TMAO), a pro-atherogenic metabolite (Brugère et al., Citation2014). Different species from butyrate-producing Lachnospirales were specifically higher in C-HIIT (C. citroniae, synonim Enterocloster citronium) and in C-MICT (L. eligens, synonym Eubacterium eligens). The latter is in contrast to an increase in Lachnospira genus at higher compared with moderate intensity in participants with pre-diabetes and T2D (Motiani et al., Citation2020). Finally, we observed a significant difference between groups in Enterococcus spp, which has not been previously reported in exercise studies. Because this difference was only significant in post-hoc analysis, and beneficial/pathogen characteristics in this genus is very strain specific (Franz, Huch, Abriouel, Holzapfel, & Gálvez, Citation2011), the interpretation of results remains difficult and thus should be further investigated.
Our findings showed that moderate rather than higher intensity exercise increased relative abundance of Bifidobacterium and A. muciniphila, which are acetate and butyrate producers and have anti-inflammatory properties (Berthon, Baines, Jensen, McLoughlin, & Wood, Citation2017). While these taxa have been mostly associated with specific dietary components or health status (Dao et al., Citation2016), our sensitivity analyses showed that the changes observed in our study were independent of diet markers. Bifidobacterium and A. municiphila were reportedly higher in active than inactive women (Bressa et al., Citation2017), but only A. municiphila increased following moderate intensity exercise in people with pre-diabetes and T2D (Motiani et al., Citation2020). While these changes were associated with improved clinical outcomes, such as decreased HbA1c and improved cardiorespiratory fitness (Motiani et al., Citation2020), we did not observe this. Divergent findings might be explained by the previous study using an acute intervention (2-weeks) and only having 3 out of 18 participants with T2D, versus our 8-week duration and 100% (n = 12) prevalence of T2D. Importantly, authors related improved clinical outcomes to reduced markers of endotoxemia, an outcome we did not measure limiting our ability to compare results (Motiani et al., Citation2020). Endotoxemia is a well described stepping-stone towards changes in systemic inflammation and insulin resistance (Cani et al., Citation2007)), and can be reduced by improving gut barrier function. As this might explain the mechanism linking exercise, increased SCFA and improved metabolic outcomes, future studies should include endotoxemia markers (i.e. plasma lipopolysaccharide binding protein) as well as inflammatory markers.
The lack of SCFA changes, particularly faecal butyrate, was in contrast to what we hypothesised and has been shown in previous studies (Barton et al., Citation2018; Estaki et al., Citation2016). The difference with these previous studies is again the inclusion of young, healthy, and in some cases athletic, participants, which are not comparable with our cohort’s age, fitness and health status (T2D). Metabolic conditions like T2D are characterised by a gut with low beneficial bacteria, high pathogens and pro-oxidative metabolites (Canfora et al., Citation2019; Qin et al., Citation2012), which might particularly affect butyrate concentrations and physiological effects (Bouter et al., Citation2018). Metabolic conditions might attenuate the effect of exercise, as observed in diabetic mice (Lambert et al., Citation2015), and in lean compared to obese participants (Allen et al., Citation2018). In contrast, specific diet components (prebiotics) have shown to be effective at increasing faecal and systemic circulation of SCFA in participants with and without metabolic conditions (van der Beek et al., Citation2018). Given that metabolic conditions might challenge the effect of exercise, future studies in this population could investigate whether combining prebiotic supplementation and exercise is more suitable for this group.
In contrast with limited changes in gut microbiome metabolites (SCFA), we found a marked difference between exercise intensity and metabolic function. Differential analyses showed reduced expression of specific KO in C-HIIT after exercise, which suggests reduced bacterial defence and protein export (Bacterial secretion system – translocase/protein export SecD (K03072), Transcription regulation (Prokaryotic defence system K07316, Transcription factor K05499), and Peptidase and inhibitors (K20608). Most of these are expressed in pathogenic bacteria and involved in antimicrobial peptides production and secretion (Shestov, Ontañón, & Tozeren, Citation2015), suggesting high intensity exercise may result in reducing pathogenicity of gut bacterial communities. Instead, moderate intensity exercise resulted in higher pyruvate metabolism (ko00620), which may explain the increased trend in faecal acetate (as acetate is the product of pyruvate metabolism) and higher A.municiphila (acetate producer) in C-MICT. This species also positively correlated with the pyruvate metabolism pathway (ko00620), suggesting carbohydrate (pyruvate) metabolism and acetate production might prevail at moderate intensity. Taken altogether, metabolic pathway findings support a cross-talk mechanism between gut microbiome and mitochondrial function (in line with (Clark & Mach, Citation2017)); and warrant further investigation on the effects of exercise intensity in healthy and clinical groups.
Strengths and limitations
The present study holds several strengths including study design and use of high-resolution gut microbiome sequencing and reporting, and comprehensive assessment clinical and dietary markers. This has allowed us to detect changes in less investigated OTUs at different exercise intensities from Oscillospirales family (Intestimonas, Agathobaculum- previously Eubacterium, Massimali spp. higher in C-MICT; GCA-001916835 and Anaeromassilibacillus spp. higher in C-HIIT) and Sutterella sp. CAG:521, higher in C-MICT. These have not been previously reported in exercise studies (Ortiz-Alvarez et al., Citation2020), with Suttarella being a recently described genus with a potential role in glucose metabolism (Wang et al., Citation2020). The lack of species level reporting in most exercise studies makes it difficult to compare some of our results and highlight the need for future studies to use high resolution methods for species-level reporting. This can advance our knowledge on the effect of exercise on minor or recently discovered species, and validate our results.
While one of our main strengths was controlling the exercise dose and intensity undertaken by each participant, we did not include dietary manipulation or controlled dietary intake. Participants were told not to change their diet; using free-living conditions, instead of manipulating diet intake, and this could have affected gut microbiome composition and outcomes. However, our analysis showed there were no significant changes in diet intake, and fibre intake was low in both groups at baseline and post-intervention (<22 g/day vs. 25–30 g/day recommendations (Reynolds et al., Citation2019). There was a small increase in fibre intake in C-MICT (mean change 6.0 g/day, p < .05), however sensitivity analyses showed no effect on main outcomes apart from the independent prediction of Massimaliae spp. Hence the increase in this taxon in the C-MICT group could be due to increased fibre intake, rather than exercise per se. Further, the health status and older age of our participants could have biased some of the metagenomics results and impacted our ability to elicit changes in SCFA by only manipulating exercise. Overall reduction in saccharolytic potential and decreased SCFA production were reported as characteristic of an aging microbiome (Rampelli et al., Citation2013). Our sample size led to a high variability in our data and could have impacted our results and external validity. Nevertheless, our sample size was powered to detect changes in taxonomic differences between groups (Kelly et al., Citation2015) and our analysis showed a large effect size in the majority of the gut microbiome composition changes (Table S2, Supplementary material). To assess metabolic function, the present study evaluated the abundance KEGG Orthology and COG pathways. Although these databases are commonly used in studies of the gut microbiome (Turnbaugh et al., Citation2006) they might be inherently biased; and limited by a lack of representativeness and evenness of KOs entries associated to human gut microbiota species (Dias, Starke, Pylro, & Morais, Citation2020). While promising, our preliminary findings on exercise intensity, metabolomics function and SCFA output should be externally validated in larger studies in this and other populations with metabolic conditions.
Conclusion
In low active people with T2D, moderate intensity, longer duration exercise resulted in increased Bifidobacterium and Escherichia genera, A. municiphila, and butyrate-producing taxa from orders Lachnospirales and Clostridium Cluster IV. Higher intensity exercise also increased butyrate producers, but from different orders (Eryspelothrichales and Oscillospirales), and less investigated species (M.smithii, Negativibacilli spp). Amino acid, carbohydrate, cofactors and vitamins, and amino sand nucleotide sugars metabolic pathways expression differed between groups. However, there were no changes in gut microbiome metabolites (SCFA). Our preliminary results on the effects of exercise intensity on gut microbiome composition and metabolic function warrant further investigation.
Supplemental Material
Download MS Word (420.4 KB)Acknowledgements
The research costs associated with this study were covered by internal funding from the Centre for Research in Exercise and Physical Activity (The University of Queensland, Brisbane, Australia). C. R. G. Willis was supported by the Biotechnology and Biological Sciences Research Council-funded South West Biosciences Doctoral Training Partnership (BB/J014400/1; BB/M009122/1). Authors would like to thank participants for their time and commitment to the study.
Disclosure statement
No potential conflict of interest was reported by the author(s).
Additional information
Funding
References
- Allen, M. J., Mailing, J. L., Niemiro, M. G., Moore, D. R., Cook, A. M., White, D. B., et al. (2018). Exercise alters Gut microbiota composition and function in lean and obese humans. Medicine & Science in Sports & Exercise, 50(4), 747–757.
- Barton, W., Penney, N. C., Cronin, O., Garcia-Perez, I., Molloy, M. G., Holmes, E., et al. (2018). The microbiome of professional athletes differs from that of more sedentary subjects in composition and particularly at the functional metabolic level. Gut, 67, 625–633.
- Berthon, B. S., Baines, K. J., Jensen, M. E., McLoughlin, R. F., & Wood, L. G. (2017). Short-chain fatty acids, prebiotics, synbiotics, and systemic inflammation: A systematic review and meta-analysis. The American Journal of Clinical Nutrition, 106(3), 930–945.
- Bouter, K., Bakker, G., Levin, E., Hartstra, A., Kootte, R., Udayappan, S., et al. (2018). Differential metabolic effects of oral butyrate treatment in lean versus metabolic syndrome subjects. Clinical and Translational Gastroenterology, 9(5), 155.
- Bressa, C., Bailén-Andrino, M., Pérez-Santiago, J., González-Soltero, R., Pérez, M., Montalvo-Lominchar, M. G., et al. (2017). Differences in gut microbiota profile between women with active lifestyle and sedentary women. PLOS ONE, 12(2), e0171352.
- Brugère, J.-F., Borrel, G., Gaci, N., Tottey, W., O’Toole, P. W., & Malpuech-Brugère, C. (2014). Archaebiotics. Gut Microbes, 5(1), 5–10.
- Canfora, E. E., Meex, R. C. R., Venema, K., & Blaak, E. E. (2019). Gut microbial metabolites in obesity, NAFLD and T2DM. Nature Reviews Endocrinology, 15(5), 261–273.
- Cani, P. D., Amar, J., Iglesias, M. A., Poggi, M., Knauf, C., Bastelica, D., et al. (2007). Metabolic Endotoxemia initiates obesity and Insulin resistance. Diabetes, 56(7), 1761–1772.
- Caron, A. Z., He, X., Mottawea, W., Seifert, E. L., Jardine, K., Dewar-Darch, D., et al. (2014). The SIRT1 deacetylase protects mice against the symptoms of metabolic syndrome. The FASEB Journal, 28(3), 1306–1316.
- Clark, A., & Mach, N. (2017). The crosstalk between the Gut microbiota and mitochondria during exercise. Frontiers in Physiology, 8(319). https://www.frontiersin.org/articles/10.3389/fphys.2017.00319/full
- Committee for Medicinal Products for Human Use (CHMP). (2015). Guideline on adjustment for baseline covariates in clinical trials London: European Medicines Agency. https://www.ema.europa.eu/en/documents/scientific-guideline/guideline-adjustment-baseline-covariates-clinical-trials_en.pdf.
- Cox, E. R., Gajanand, T., Burton, N. W., Coombes, J. S., & Coombes, B. K. (2020). Effect of different exercise training intensities on musculoskeletal and neuropathic pain in inactive individuals with type 2 diabetes – preliminary randomised controlled trial. Diabetes Research and Clinical Practice, 164, 108168.
- Cronin, O., Barton, W., Skuse, P., Penney, N. C., Garcia-Perez, I., Murphy, E. F., et al. (2018). A prospective metagenomic and metabolomic analysis of the impact of exercise and/or whey protein supplementation on the Gut microbiome of sedentary adults. mSystems, 3(3), e00044–18.
- Crost, E. H., Le Gall, G., Laverde-Gomez, J. A., Mukhopadhya, I., Flint, H. J., & Juge, N. (2018). Mechanistic insights into the cross-feeding of Ruminococcus gnavus and Ruminococcus bromii on host and dietary carbohydrates. Frontiers in Microbiology, 9(2558). https://www.frontiersin.org/articles/10.3389/fmicb.2018.02558/full
- Dao, M. C., Everard, A., Aron-Wisnewsky, J., Sokolovska, N., Prifti, E., Verger, E. O., et al. (2016). Akkermansia muciniphila and improved metabolic health during a dietary intervention in obesity: Relationship with gut microbiome richness and ecology. Gut, 65(3), 426–436.
- Dhariwal, A., Chong, J., Habib, S., King, I. L., Agellon, L. B., & Xia, J. (2017). Microbiomeanalyst: A web-based tool for comprehensive statistical, visual and meta-analysis of microbiome data. Nucleic Acids Research, 45(W1), W180–W1W8.
- Dias, C. K., Starke, R., Pylro, V. S., & Morais, D. K. (2020). Database limitations for studying the human gut microbiome. Peerj. Computer Science, 6, e289.
- Dore, J., Ehrlich, S., Levenez, F., Pelletier, E., Alberti, A., Bertrand, L., et al. (2015). IHMS_SOP 04 V1: Standard operating procedure for fecal samples frozen preserved self-collection, laboratory analysis handled within 24 hours to 7 days (24 hours < x ≤ 7 days). International Human Microbiome Standards. http://www.human-microbiome.org/index.php?id=Sop&num=004
- Estaki, M., Morck, D. W., Ghosh, S., Quin, C., Pither, J., Barnett, J. A., et al. (2020). Physical activity shapes the intestinal microbiome and immunity of healthy mice but Has No protective effects against colitis in MUC2−/− mice. mSystems, 5(5), e00515–20.
- Estaki, M., Pither, J., Baumeister, P., Little, J. P., Gill, S. K., Ghosh, S., et al. (2016). Cardiorespiratory fitness as a predictor of intestinal microbial diversity and distinct metagenomic functions. Microbiome, 4(1), 42.
- Franz, C. M. A. P., Huch, M., Abriouel, H., Holzapfel, W., & Gálvez, A. (2011). Enterococci as probiotics and their implications in food safety. International Journal of Food Microbiology, 151(2), 125–140.
- Gao, Z., Yin, J., Zhang, J., Ward, R. E., Martin, R. J., Lefevre, M., et al. (2009). Butyrate improves Insulin sensitivity and increases energy expenditure in mice. Diabetes, 58(7), 1509–1517.
- García-Villalba R., Giménez-Bastida J. A., García-Conesa M. T., Tomás-Barberán F. A., Carlos Espín J., & Larrosa M. (2012). Alternative method for gas chromatography-mass spectrometry analysis of short-chain fatty acids in faecal samples. Journal of Separation Science, 35(15), 1906–1913.
- Hammer, Ø, Harper, D. A., & Ryan, P. D. (2001). PAST: Paleontological statistics software package for education and data analysis. Palaeontologia Electronica, 4(1), 9.
- Hordern, M. D., Dunstan, D. W., Prins, J. B., Baker, M. K., Singh, M. A., & Coombes, J. S. (2012). Exercise prescription for patients with type 2 diabetes and pre-diabetes: A position statement from exercise and Sport Science Australia. Journal of Science and Medicine in Sport, 15(1), 25–31.
- Kelly, B. J., Gross, R., Bittinger, K., Sherrill-Mix, S., Lewis, J. D., Collman, R. G., et al. (2015). Power and sample-size estimation for microbiome studies using pairwise distances and PERMANOVA. Bioinformatics (oxford, England), 31(15), 2461–2468.
- Lambert, J. E., Myslicki, J. P., Bomhof, M. R., Belke, D. D., Shearer, J., & Reimer, R. A. (2015). Exercise training modifies gut microbiota in normal and diabetic mice. Applied Physiology, Nutrition, and Metabolism, 40(7), 749–752.
- Love M. I., Huber W., & Anders S. (2014). Moderated estimation of fold change and dispersion for RNA-seq data with DESeq2. Genome Biology, 15(12), 550.
- Metus, P., Ruzzante, N., Bonvicini, P., Meneghetti, M., Zaninotto, M., & Plebani, M. (1999). Immunoturbidimetric assay of glycated hemoglobin. Journal of Clinical Laboratory Analysis, 13(1), 5–8.
- Motiani, K. K., Collado, M. C., Eskelinen, J.-J., Virtanen, K. A., Löyttyniemi, E., Salminen, S., et al. (2020). Exercise training modulates Gut microbiota profile and improves endotoxemia. Medicine & Science in Sports & Exercise, 52(1), 94–104.
- Ortiz-Alvarez, L., Xu, H., & Martinez-Tellez, B. (2020). Influence of exercise on the Human Gut microbiota of healthy adults: A systematic review. Clinical and Translational Gastroenterology, 11(2), e00126.
- Qin, J., Li, Y., Cai, Z., Li, S., Zhu, J., Zhang, F., et al. (2012). A metagenome-wide association study of gut microbiota in type 2 diabetes. Nature, 490(7418), 55–60.
- Rampelli, S., Candela, M., Turroni, S., Biagi, E., Collino, S., Franceschi, C., et al. (2013). Functional metagenomic profiling of intestinal microbiome in extreme ageing. Aging (Albany NY, 5(12), 902–912.
- Reynolds, A., Mann, J., Cummings, J., Winter, N., Mete, E., & Te Morenga, L. (2019). Carbohydrate quality and human health: A series of systematic reviews and meta-analyses. The Lancet, 393(10170), 434–445.
- Shestov, M., Ontañón, S., & Tozeren, A. (2015). Encyclopedia of bacterial gene circuits whose presence or absence correlate with pathogenicity–a large-scale system analysis of decoded bacterial genomes. BMC Genomics, 16, 773.
- Taniguchi, H., Tanisawa, K., Sun, X., Kubo, T., Hoshino, Y., Hosokawa, M., et al. (2018). Effects of short-term endurance exercise on gut microbiota in elderly men. Physiological Reports, 6(23), e13935.
- Tian, C., Manfei, X., Justin, T., Hongyue, W., & Xiaohui, N. (2018). Relationship between omnibus and post-hoc tests: An investigation of performance of the F test in ANOVA. Shanghai Archives of Psychiatry, 30(1), 60.
- Turnbaugh, P. J., Ley, R. E., Mahowald, M. A., Magrini, V., Mardis, E. R., & Gordon, J. I. (2006). An obesity-associated gut microbiome with increased capacity for energy harvest. Nature, 444(7122), 1027–1031.
- van der Beek, C. M., Canfora, E. E., Kip, A. M., Gorissen, S. H. M., Olde Damink, S. W. M., van Eijk, H. M., et al. (2018). The prebiotic inulin improves substrate metabolism and promotes short-chain fatty acid production in overweight to obese men. Metabolism, 87, 25–35.
- Vargas-Ortiz, K., Pérez-Vázquez, V., & Macías-Cervantes, M. H. (2019). Exercise and sirtuins: A Way to mitochondrial health in skeletal muscle. International Journal of Molecular Sciences, 20(11), 2717.
- Wang, C., Zhang, H., Liu, H., Zhang, H., Bao, Y., Di, J., et al. (2020). The genus Sutterella is a potential contributor to glucose metabolism improvement after roux-en-Y gastric bypass surgery in T2D. Diabetes Research and Clinical Practice, 162, 108116.
- Weston, K. S., Wisloff, U., & Coombes, J. S. (2014). High-intensity interval training in patients with lifestyle-induced cardiometabolic disease: A systematic review and meta-analysis. British Journal of Sports Medicine, 48(16), 1227–1234.
- Zhao, X., Zhang, Z., Hu, B., Huang, W., Yuan, C., & Zou, L. (2018). Response of Gut microbiota to metabolite changes induced by endurance exercise. Frontiers in Microbiology, 9(765), 765.