
 ?Mathematical formulae have been encoded as MathML and are displayed in this HTML version using MathJax in order to improve their display. Uncheck the box to turn MathJax off. This feature requires Javascript. Click on a formula to zoom.
ABSTRACT
In short-track speed skating, tactical positioning is essential for success as the race format (head-to-head) prioritises finishing position over finishing time. At present, our understanding of this phenomenon is based on measuring the similarity between athletes’ intermediate and final rankings. However, as this approach groups athlete performances across races, each lap’s estimate of tactical importance ignores the athlete-opponent interactions specific to each race. Here, we examine the utility of race-specific athlete-opponent interactions for investigating tactical positioning. Using intermediate and final rankings of elite 1,000 m short-track speed skating competitors collected from 2010/11–2017/18 (n = 6,196, races = 1,549), we compared the current method to a novel approach that accounted for race-specific athlete-opponent interactions. This approach first applied the current method to each race independently before using these values to form (1) discrete, empirical distributions of each lap’s tactical importance and (2) race-specific tactical positioning sequences. Our results showed that accounting for race-specific athlete-opponent interactions provided a higher measurement granularity (i.e. level of detail) for investigating tactical positioning in short-track speed skating, which better captured the complexity of the phenomenon. We observed 61 different tactical positioning behaviours and 1,269 unique tactical positioning sequences compared to the current approach’s nine-point estimates of tactical positioning importance. For this reason, we recommend that researchers and practitioners account for race-specific athlete-opponent interactions in the future as it offers a deeper understanding of tactical positioning that will enhance both strategic and tactical decisions.
Highlights
We compare the current approach for investigating tactical positioning to a novel approach that accounts for race-specific athlete-opponent interactions.
We show that accounting for race-specific athlete-opponent interactions provides a higher measurement granularity (i.e. level of detail) for investigating tactical positioning in short-track speed skating.
We demonstrate that this increased measurement granularity can facilitate a deeper understanding of tactical positioning by (1) producing theoretically-more-correct point estimates of tactical positioning importance, (2) enabling more rigorous statistical analyses into the effect of athlete-environment interactions on tactical positioning behaviour, and (3) allowing sequential analyses that capture the progressive relationships between laps.
We recommend that researchers and practitioners account for race-specific athlete-opponent interactions in future investigations, as the findings will enhance analyst, coach, and athlete preparation for the strategic and tactical decision-making process essential for success in short-track.
Introduction
Short-track speed skating has been part of the Olympic programme since its demonstration at the 1988 Winter Olympic Games. In its current format, individual events (500 m, 1,000 m, and 1,500 m) and relay events (2,000 m, 3,000 m, and 5,000 m) provide a country with the opportunity to win nine gold medals (International Skating Union, Citation2021). In all these events, an athlete/ team must advance through several rounds of qualifying races – e.g. heats, quarterfinals, semi-finals – to reach the medal contest. Each qualifying race involves multiple skaters (typically four to six) racing head-to-head, anticlockwise, around a 111.12 m oval at speeds exceeding 11 m/s (Bullock, Martin, & Zhang, Citation2008; Landry, Gagnon, & Laurendeau, Citation2013). Critically, advancement through these qualifying races, and medal colour, depends on an athlete’s or team’s finishing rank and not their finishing time. For example, an athlete could win the first semi-final with a slower finishing time than an athlete who failed to qualify from the second semi-final. Due to this competition structure and race format, athletes’ decisions regarding how and when to invest their limited energy resources before (strategic) and during (tactical) races are thought to be crucial for success in short-track speed skating (Hext, Heller, Kelley, & Goodwill, Citation2017; Muehlbauer & Schindler, Citation2011). This regulation of exercise intensity is known as pacing (Abbiss & Laursen, Citation2008).
In recent years, several research groups have emphasised the importance of athlete-environment interactions for understanding pacing behaviour, i.e. the outcome of the strategic and tactical decision-making process (Hettinga, Konings, & Pepping, Citation2017; Konings & Hettinga, Citation2018c; Renfree & Casado, Citation2018; Renfree, Martin, Micklewright, & St Clair Gibson, Citation2014; Smits, Pepping, & Hettinga, Citation2014). In this perspective, pacing is conceptualised as a continuous decision-making process that is affected by and responds to the environment (Hettinga et al., Citation2017; Konings & Hettinga, Citation2018c; Renfree & Casado, Citation2018; Smits et al., Citation2014). Accordingly, athletes’ decisions regarding how to expend energy over a race are based on internal factors such as their physiological capacity in relation to external factors that characterise the performance environment. Indeed, research has shown that external factors such as the number of competitors in a race, the competition’s stage, the competition’s importance, and preceding race efforts alter elite short-track speed skaters’ pacing behaviour (Konings & Hettinga, Citation2018b, Citation2018d).
Arguably the most important athlete-environment interactions for understanding pacing behaviour in short-track speed skating are those between athlete and opponent (Hettinga et al., Citation2017; Konings & Hettinga, Citation2018c). Konings and Hettinga (Citation2018a) showed that the high variability observed in between-race finishing times is primarily due to athletes altering their pacing behaviour to that of other opponents, particularly during the race’s early stages. Moreover, drafting possibilities, competing for the optimum line, avoiding collisions, minimising fall risk, and overtaking represent other athlete-opponent interactions that may cause an athlete to modify their pace in short-track speed skating (Konings, Noorbergen, Parry, & Hettinga, Citation2016; Noorbergen, Konings, Micklewright, Elferink-Gemser, & Hettinga, Citation2016). For this reason, previous research has investigated tactical positioning – i.e. athletes ranking within the race (1st, 2nd, 3rd, 4th, etc.) – to help contextualise pacing behaviour (Konings et al., Citation2016; Noorbergen et al., Citation2016), explore how it can be learned (Menting, Konings, Elferink-Gemser, & Hettinga, Citation2019), and as a subject in its own right (Haug, Drinkwater, Mitchell, & Chapman, Citation2015; Maw, Proctor, Vredenburg, & Ehlers, Citation2006; Muehlbauer & Schindler, Citation2011).
The most popular approach for investigating tactical positioning is to use Kendall’s Tau-b, τb, to measure the similarity of athletes’ intermediate and final rankings at the race start and end of each lap (Haug et al., Citation2015; Konings et al., Citation2016; Maw et al., Citation2006; Menting et al., Citation2019; Muehlbauer & Schindler, Citation2011; Noorbergen et al., Citation2016). Kendall’s τb is a correlation statistic for ordinal data that considers the ranking of observations rather than the value (Kendall, Citation1938). Researchers and practitioners use the Kendall’s τb values to quantify the tactical importance of athlete ranking at discrete points in the race. This approach has shown that the race start is crucial, and possibly even decisive, for success in the 500 m (Haug et al., Citation2015; Maw et al., Citation2006; Muehlbauer & Schindler, Citation2011; Noorbergen et al., Citation2016) and identified the point in the race where athlete ranking has a strong similarity with final ranking in the 1,000 m and 1,500 m events (Konings et al., Citation2016; Noorbergen et al., Citation2016). This information can be used by coaches and athletes to enhance their strategic and tactical preparation for the decision-making process involved in short-track speed skating (Konings et al., Citation2016; Noorbergen et al., Citation2016).
Without underestimating the insights that this approach has provided, the approach ignores a critical aspect of athlete-environment interactions: the independence of races, as athlete rankings from different races across competitions and seasons are combined. For example, consider two four-athlete races. The current approach groups the eight athletes to produce a single point estimate of a lap’s tactical importance, even though the athletes in the first race did not interact with the athletes in the second race (and vice-versa). If we are to frame pacing as a continuous decision-making process that is affected by and responds to the environment, these race-specific athlete-opponent interactions are crucial for understanding tactical positioning and, ultimately, pacing behaviour.
For these reasons, this study examined the utility of race-specific athlete-opponent interactions for investigating tactical positioning in short-track speed skating. More specifically, we compared two different approaches for exploring the phenomenon. The first approach – without race-specific athlete-opponent interactions – ignored race-specific athlete-opponent interactions and represented the current analysis approach. The second approach – with race-specific athlete-opponent interactions – accounted for race-specific athlete-opponent interactions and represented a novel approach devised for this study. Both approaches were applied to a dataset of 1,000 m races recorded at elite short-track speed skating competitions.
Method
This study was approved by the Research Ethics Committee at Sheffield Hallam University, UK.
Dataset
Our dataset consisted of 4,056 1,000 m races (men, n = 2,316; women, n = 1,740), from 62 competitions (44 World Cups, 8 European Championships, 8 World Championships, and 2 Winter Olympic Games), over an 8-season period (2010/11–2017/18). For each race, the dataset contained all competitors’ starting position, intermediate rankings (i.e. their ranking at the end of Laps 1–8), and final rankings (i.e. their ranking at the end of Lap 9). The dataset coded starting positions from 1 (innermost track position) to 4 (outermost track position) and intermediate/ final rankings from 1 (leading athlete) to 4 (last athlete). Please note the deliberate distinction in terminology between start position and intermediate/ final rankings: at the race start, all athletes have the same ranking but different spatial positions as they are distributed across a start line perpendicular to the direction of the track.
Before analysing the dataset, we excluded races with falls (n = 879), disqualifications (n = 893), missing values (n = 2), tied intermediate rankings (n = 4), and races where the number of athletes competing was not equal to the event’s modal value of four athletes (n = 1,854). These strict inclusion criteria were in line with previous short-track speed skating research (Konings et al., Citation2016; Noorbergen et al., Citation2016). The final dataset included 1,549 of the 4,056 races (38.2%; men, n = 847; women, n = 702).
Data analysis
To analyse tactical positioning without race-specific athlete-opponent interactions, we replicated the method outlined in Konings et al. (Citation2016) and Noorbergen et al. (Citation2016). This method estimates the tactical importance of athlete ranking for each lap (and the race start) by measuring the similarity of athletes’ intermediate and final rankings using Kendall’s τb. For example, to calculate the tactical importance of athlete ranking at the end of Lap 4, we measured the similarity between athlete rankings at the end of Lap 4 and athlete rankings at the end of Lap 9 for all races in the dataset (n = 6,196 athlete performances). A Kendall’s τb = 1 represents a perfect agreement between intermediate and final rankings, and a Kendall’s τb = -1 represents a perfect disagreement. In accordance with Konings et al. (Citation2016) and Noorbergen et al. (Citation2016), we interpreted the Kendall’s τb values as none/ low (τb < 0.5), moderate (0.5 ≤ τb < 0.7), and high (τb ≥ 0.7).
To analyse tactical positioning with race-specific athlete-opponent interactions, we measured the similarity between intermediate and final rankings for each race in the dataset using Kendall’s τb. For example, Kendall’s τb = 0.67 when comparing the final rankings of 1st-2nd-3rd-4th to intermediate rankings of 2nd-1st-3rd-4th (where the race winner was ranked second at the end of the intermediate lap). We used these race-specific Kendall’s τb values in two subsequent analyses.
First, we formed discrete, empirical distributions of the similarity between intermediate and final rankings (Lap 9) for the race start and Laps 1–8. Distributions were discrete because races with four athletes only present 24 unique permutations of rank order (e.g. 1st-2nd-3rd-4th, 1st-2nd-4th-3rd, 2nd-4th-1st-3rd, etc). These permutations lead to only seven unique Kendall’s τb values (with respect to the final rank ordering of 1st-2nd-3rd-4th): -1, -0.67, -0.33, 0, 0.33, 0.67, and 1. We calculated the modal value of the discrete, empirical distributions for the race start and Laps 1–8, to enable a direct comparison with the without race-specific athlete-opponent interactions approach.
Second, we generated a sequential sequence of tactical positioning for each race in the dataset, of the form . For example, a sequence (−1, −1, −1, −1, −1, −1, −1, −1, −1) represents a race where the starting position, and intermediate rankings at the end of Laps 1–8, were the reverse of the final rankings. Using these generated sequences, we calculated the number of unique tactical positioning sequences in the dataset and each sequence’s absolute and relative support. A sequence’s absolute support denotes the number of times the sequence occurs, and a sequence’s relative support is the absolute support divided by the total number of sequences (Fournier-Viger, Lin, Kiran, Koh, & Thomas, Citation2017). For example, an absolute support of 500 would indicate that 500 races had the same tactical positioning race sequence, which represents a relative support of 32.3% in this dataset. To summarise the typical occurrence of a tactical positioning race sequence, we calculated the minimum, lower quartile, median, upper quartile, and maximum absolute and relative support.
Results
Without race-specific athlete-opponent interactions
presents the point estimates and 95% confidence intervals of Kendall’s τb as a measure of tactical positioning importance for the race start and Laps 1–8. Similarity between intermediate and final rankings were categorised as none/ low (τb < 0.5) from the race start up to the end of Lap 5, moderate (0.5 ≤ τb < 0.7) at the end of Lap 6, and high (τb ≥ 0.7) at the end of Laps 7 and 8.
Table 1. Point estimates (and 95% confidence intervals) of tactical positioning importance calculated without race-specific athlete-opponent interactions.
With race-specific athlete-opponent interactions
shows the discrete empirical distributions of Kendall’s τb as a measure of tactical positioning importance. We observed races with each of the seven unique Kendall’s τb values up to the end of Lap 7, and races with five unique Kendall’s τb values at the end of Lap 8. Together, these observations represented 61 out of the 63 possible ways that we can characterise tactical positioning importance when applying this method to 1,000 m races with four athletes (i.e. 7 Kendall’s τb values x 9 discrete points in the race where start position or intermediate ranking is measured).
Figure 1. Evaluating tactical positioning using the with race-specific athlete-opponent interactions approach. (a) 2D histogram of the similarity between start position/ intermediate rankings (Laps 1–8) and final rankings (Lap 9). The density represents the proportion of races in the dataset, and the white dot denotes each lap’s modal Kendall’s τb value. (b) 1D histogram of Lap 2’s similarity between intermediate and final rankings.
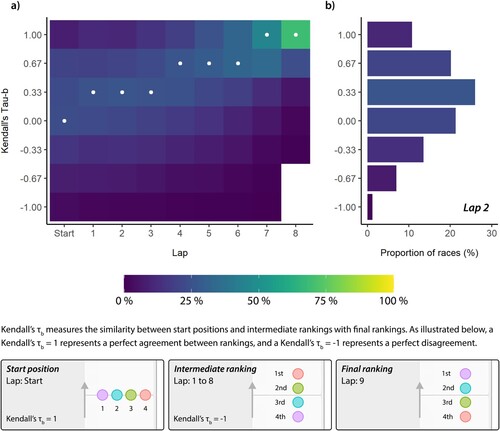
also illustrates the modal Kendall’s τb value for the race start and each lap. Here, the similarity between intermediate and final rankings were categorised as none/ low (τb < 0.5) from the race start up to the end of Lap 3, moderate (0.5 ≤ τb < 0.7) at the end of Laps 4–6, and high (τb ≥ 0.7) at the end of Laps 7 and 8. Note that the mode transitions from none/ low to moderate two laps earlier compared to the without race-specific athlete-opponent interactions approach.
Finally, we observed 1,269 unique sequences of tactical positioning from the 1,549 races analysed. Of these sequences, the most frequently recurring sequence of Kendall’s τb was (0.67, 1, 1, 1, 1, 1, 1, 1, 1). This sequence – which characterises a race where the athlete order remained the same from the end of Lap 1 to the race end – had an absolute support = 18 races and a relative support = 1.2%. The minimum, lower quartile, median, and upper quartile absolute support was one race (relative support = 0.06%). When excluding the race start, the most frequently recurring sequence was (1, 1, 1, 1, 1, 1, 1, 1). This sequence had an absolute support = 42 races and relative support = 2.7%.
Discussion
This study examined the utility of race-specific athlete-opponent interactions for investigating tactical positioning in short-track speed skating. More specifically, we compared two different approaches for exploring the phenomenon in the 1,000 m event. The first approach ignored race-specific athlete-opponent interactions and represented the current analysis approach. The second approach accounted for race-specific athlete-opponent interactions and represented a novel approach devised for this study. Our results showed that accounting for race-specific athlete-opponent interactions provided a higher measurement granularity (i.e. level of detail) for investigating tactical positioning in short-track speed skating. This increased granularity can facilitate a deeper understanding of tactical positioning behaviour, as we can explore the phenomenon using (1) theoretically-more-correct point estimates, (2) discrete, empirical distributions that enable more rigorous statistical analyses, and (3) sequential analyses that capture the progressive relationships between laps. For these reasons, we recommend that both researchers and practitioners account for race-specific athlete-opponent interactions when investigating tactical positioning in the future.
Investigating tactical positioning using point estimates
The most-popular approach for investigating tactical positioning in short-track speed skating is to produce point estimates that quantify the tactical importance of athlete ranking at discrete points in the race (Haug et al., Citation2015; Konings et al., Citation2016; Maw et al., Citation2006; Menting et al., Citation2019; Muehlbauer & Schindler, Citation2011; Noorbergen et al., Citation2016). This approach – which ignores race-specific athlete-opponent interactions – yields a single profile that (1) shows how the importance of tactical positioning develops over a race and (2) identifies the laps where there is a strong similarity between intermediate and final rankings. Coaches and athletes can use this information to enhance their preparation for the strategic and tactical decision-making process involved in short-track speed skating. For example, in the 1,000 m event previous research has shown that tactical positioning is crucial from Lap 6 onwards (Muehlbauer & Schindler, Citation2011; Noorbergen et al., Citation2016). Based on these results, Noorbergen et al. (Citation2016) advised athletes to conserve energy at the beginning of the race by occupying a ranking other than first, as drafting significantly reduces air frictional losses (Hoshikawa et al., Citation2005; Rundell, Citation1996). Then, with four laps remaining, athletes should attempt to occupy one of the foremost rankings due to the strong similarity with final ranking. Our without race-specific athlete-opponent interactions results support this strategy, as we also observed none/ low correlations between intermediate and final rankings until the end of Lap 6 ().
We can produce theoretically more correct point estimates by accounting for race-specific athlete-opponent interactions and reporting a measure of central tendency. When interpreting the modal Kendall’s τb values in accordance with Noorbergen et al. (Citation2016), our results would advise athletes to move to the front of the race two laps earlier than the without race-specific athlete-opponent interactions approach (). In this strategy, although an athlete would spend less time conserving energy by drafting, they would move to the front earlier in the race, when the pace is likely to be slower (Noorbergen et al., Citation2016). Overtaking at slower speeds might alleviate reluctance to use drafting as a strategy due to the difficulty of overtaking (Hoffman, Listemann, McManaman, & Rundell, Citation1998). Furthermore, coaches and athletes might perceive this strategy as less risk-averse – and therefore more suited to athletes with a higher perception of risk (Micklewright et al., Citation2015) – because moving to the front earlier mitigates the risk of falls associated with athlete collisions.
For both approaches, it is important to note that any tactical positioning advice derived from point estimates is only applicable to the “typical” race; the advice does not guarantee that a race will develop as the point estimates suggest, nor does it guarantee an athlete’s success if they follow the advice. Still, the results can enhance coaches’ and athletes’ strategic and tactical race preparation when these limitations are considered. Importantly for this study, we can produce theoretically-more-correct, point estimate profiles by accounting for race-specific athlete-opponent interactions. Furthermore, this approach provides further opportunities to explore tactical positioning in short-track speed skating.
Investigating tactical positioning using discrete, empirical distributions
A key feature of accounting for race-specific athlete-opponent interactions is the ability to investigate tactical positioning using discrete, empirical distributions rather than point estimates. These distributions provide a higher granularity of measurement for characterising tactical positioning behaviour in short-track speed skating. As demonstrated in , there are 63 different ways that we can characterise tactical positioning in a 1,000 m race with four athletes (i.e. 7 Kendall’s τb values x 9 discrete points in the race where start position or intermediate ranking is measured). In this study, we observed 61 of these ways. These observations highlight that tactical positioning is more complex than portrayed by approaches that produce point estimates of tactical positioning importance. It is crucial that any approach captures this complexity, as it broadens the strategic and tactical decisions available to coaches and athletes (Buekers, Montagne, & Ibáñez-Gijón, Citation2019).
Besides being better equipped to capture the complexity of tactical positioning, the discrete, empirical distributions also enable more rigorous analyses into the effect of athlete-environment interactions on tactical positioning in short-track speed skating. At present, studies only compare the magnitudes of Kendall’s τb point estimates because this is the dependent variable afforded by an approach that ignores race-specific athlete-opponent interactions (Maw et al., Citation2006; Menting et al., Citation2019; Muehlbauer & Schindler, Citation2011). For example, Muehlbauer and Schindler (Citation2011) reported that the similarity between starting and finishing position in the 1,000 m increased with qualifying round, as the Kendall’s τb values were lowest in the preliminaries (women τb = −0.03; men τb = −0.06) and highest in the finals (women τb = 0.37; men τb = 0.49). In contrast, studies investigating the effect of athlete-environment interactions on pacing behaviour use statistical techniques such as multivariate analysis of variance, as the dependent variable is lap time, of which there are thousands of observations (Konings & Hettinga, Citation2018b, Citation2018d). By accounting for race-specific athlete-opponent interactions and producing thousands of tactical positioning observations, we can undertake more rigorous statistical investigations into the effect of athlete-environment interactions on tactical positioning.
Investigating tactical positioning using sequential analysis
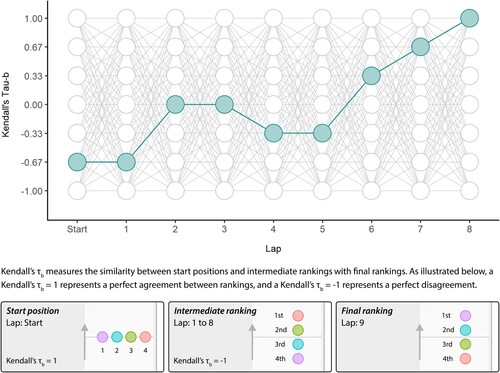
Another key feature of accounting for race-specific athlete-opponent interactions is that we can investigate tactical positioning using the sequential structure of the Lap-τb data, rather than treating laps as discrete events. Techniques that capture the relationships between discrete events can contribute to a deeper understanding of performance in sport (Borrie, Jonsson, & Magnusson, Citation2002). In our case, forming sequential sequences provided the highest measurement granularity for characterising tactical positioning behaviour. As illustrated in , there are 40,353,607 possible tactical positioning sequences in a 1,000 m race with four athletes. We observed 1,269 of these sequences from the 1,549 races analysed, with only 142 sequences occurring on more than one occasion. This large number of sequences (1) further highlights the complexity of tactical positioning in short-track speed skating, and (2) demonstrates the potential of race-specific athlete-opponent interactions for investigating the phenomenon. For example, future work could explore using these sequences to create a taxonomy of tactical positioning races. This taxonomy would enhance coaches’ and athletes’ preparation for the strategic and tactical decision-making process by providing a dictionary of tactical races that occur in short-track speed skating, rather than the one race produced by the current point estimate approach.
Figure 2. Tactical positioning sequences in a 1,000 m race with four athletes. Each node represents the similarity between start position/ intermediate rankings (Laps 1–8) and final rankings (Lap 9). Each edge represents how a node can transition to future and past laps. The highlighted nodes and edges illustrate an example sequence of (−0.67, −0.67, 0, 0, −0.33, −0.33, 0.33, 0.67, 1). This sequence is one of 40,353,607 possible tactical positioning sequences in this race scenario.
Furthermore, we can only truly observe how tactical positioning develops over a race when we treat laps as sequential sequences and not discrete events. demonstrates this by comparing two tactical positioning sequences to the with race-specific athlete-opponent interactions discrete, point estimates. a compares the point estimates to the most frequently occurring tactical positioning sequence. This sequence has an absolute support = 18 races (relative support = 1.2%). Although the point estimates represent the most-commonly occurring Kendall’s τb value for each lap, the tactical positioning strategy formed from this data differs considerably to the most frequently occurring sequence. That is, athletes should attempt to lead the race throughout as there is a strong similarity between intermediate and final rankings from the race start.
Figure 3. Effect of treating laps as discrete or sequential events. Comparison of with race-specific athlete-environment interactions discrete, point estimates, i.e. the modal similarity between start position/ intermediate rankings (Laps 1–8) and final rankings (Lap 9), with two observed tactical positioning sequences of the form . (a) the most commonly occurring sequence (absolute support = 18 races; relative support = 1.2%), and (b) an observed tactical positioning sequence (absolute support = 4 races; relative support = 0.3%). In both plots, the shaded region represents Kendall’s τb values where the start position/ intermediate rankings and final rankings are deemed to have a strong similarity.
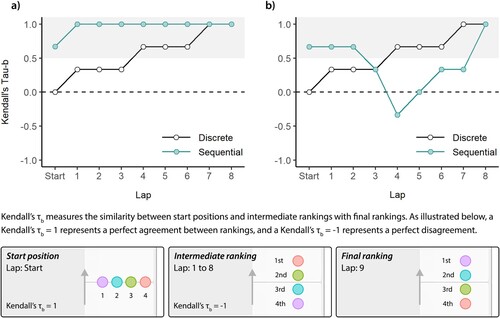
b compares the point estimates to a tactical positioning sequence with an absolute support = 4 races (relative support = 0.3%). When treating laps as discrete events, the similarity between intermediate and final rankings increases as the race progresses, with tactical positioning becoming crucial at the end of Lap 4. In contrast, tactical positioning is crucial until the end of Lap 3 in the sequential sequence, where it transitions back to none/ low Kendall’s τb values until the end of Lap 8. This regression shows that (1) the similarity between intermediate and final rankings does not always increase as the race progresses, and (2) tactical positioning is not always crucial at the end of Lap 4. This example supports our concerns about deriving tactical positioning advice from point estimates. Specifically, that the race may not develop as the point estimates suggest, nor does it guarantee an athlete’s success if they follow the advice. These insights are only available when accounting for race-specific athlete-opponent interactions and the sequential structure of the data.
Limitations
Although the primary aim of this study was to examine the utility of race-specific athlete-opponent interactions for investigating tactical positioning, our results provide alternative insights that coaches and athletes could use to enhance their strategic and tactical preparation for the decision-making process involved in short-track speed skating. For this reason, it is important to reiterate that any advice derived from our results does not guarantee that a race will develop as we have described, nor does it guarantee an athlete’s success if they follow the advice. Furthermore, our results only represent a race scenario with four athletes, no falls, and no disqualifications. Still, although the generalisability of our practical findings are limited to this single race scenario, this further demonstrates the complexity of tactical positioning in short-track speed skating. The 1,269 unique sequences that we observed representing only 38.2% of races in the original dataset. We would expect additional unique sequences when races with a different number of skaters (45.7%, n = 1,854), falls (21.7%, n = 879), and disqualifications (22.0%, n = 893) are analysed. Importantly, our proposed approach is scalable to analyse these race scenarios, in addition to other events (e.g. 500 m and 1,500 m), with the method’s measurement granularity being dependent on the number of athletes and laps in the race. For example, in a 500 m race with five athletes, there are 66 possible ways of characterising tactical positioning behaviour (11 Kendall’s τb values x 6 discrete points in the race where start position/ intermediate ranking is measured). Such a race scenario leads to 161,051 possible tactical positioning sequences.
Conclusion
Accounting for race-specific athlete-opponent interactions provide a higher measurement granularity (i.e. level of detail) for investigating tactical positioning in short-track speed skating. This increased granularity can facilitate a deeper understanding of tactical positioning behaviour, as we can explore the phenomenon using (1) theoretically-more-correct point estimates, (2) discrete, empirical distributions that enable more rigorous statistical analyses, and (3) sequential analyses that capture the progressive relationships between laps. For this reason, we recommend that researchers and practitioners account for race-specific athlete-opponent interactions in future investigations. Ultimately, the findings from such analyses will enhance analyst, coach, and athlete preparation for the strategic and tactical decision-making process that is essential for success in short-track speed skating.
Disclosure statement
No potential conflict of interest was reported by the author(s).
Correction Statement
This article has been republished with minor changes. These changes do not impact the academic content of the article.
Additional information
Funding
References
- Abbiss, C. R., & Laursen, P. B. (2008). Describing and understanding pacing strategies during athletic competition. Sports Medicine, 38(3), 239–252. doi:10.2165/00007256-200838030-00004
- Borrie, A., Jonsson, G. K., & Magnusson, M. S. (2002). Temporal pattern analysis and its applicability in sport: An explanation and exemplar data. Journal of Sports Sciences, 20(10), 845–852. doi:10.1080/026404102320675675
- Buekers, M., Montagne, G., & Ibáñez-Gijón, J. (2019). Strategy and tactics in sports from an ecological-dynamical-perspective: What is in there for coaches and players? Movement & Sport Sciences - Science & Motricité, doi:10.1051/sm/2019026
- Bullock, N., Martin, T. D., & Zhang, A. (2008). Performance analysis of world class short track speed skating: What does It take to win? International Journal of Performance Analysis in Sport, 8(1), 9–18. doi:10.1080/24748668.2008.11868418
- Fournier-Viger, P., Lin, J. C.-W., Kiran, R. U., Koh, Y. S., & Thomas, R. (2017). A survey of sequential pattern mining. Data Science and Pattern Recognition, 1(1), 54–77. doi:10.1007/978-3-030-04921-8_4
- Haug, W. B., Drinkwater, E. J., Mitchell, L. J., & Chapman, D. W. (2015). The relationship between start performance and race outcome in elite 500 m short-track speed skating. International Journal of Sports Physiology and Performance, 10(7), 902–906. doi:10.1123/ijspp.2014-0504
- Hettinga, F. J., Konings, M. J., & Pepping, G.-J. (2017). The science of racing against opponents: Affordance competition and the regulation of exercise intensity in head-to-head competition. Frontiers in Physiology, 8(February), 1–7. doi:10.3389/fphys.2017.00118
- Hext, A., Heller, B., Kelley, J. W., & Goodwill, S. R. (2017). Relay exchanges in elite short-track speed skating. European Journal of Sport Science, 17(5), 503–510.
- Hoffman, E., Listemann, E., McManaman, C., & Rundell, K. W. (1998). Short track speed skating: Analysis of drafting during world championship competition. Medicine and Science in Sports and Exercise, 30(Supplement 5), 310.
- Hoshikawa, H., Yoshino, T., Tamaki, K., Tomita, H., Kato, K., Ishihara, K., … Kawakami, T. (2005). The effects of drafting on blood lactate accumulation during short track speed skating. Proceedings of the 13th Annual Meeting of the Canadian Soceity for Exercise Physiology, 30(Supplement 1).
- ISU. (2021). Special regulations and rules short-track speed skating.
- Kendall, M. G. (1938). A new measure of rank correlation. Biometrika, 30(1/2), 81–93. doi:10.2307/2332226.
- Konings, M. J., & Hettinga, F. J. (2018a). Objectifying tactics: Athlete and race variability in elite short-track speed skating. International Journal of Sports Physiology and Performance, 13(2), 170–175. doi:10.1123/ijspp.2016-0779
- Konings, M. J., & Hettinga, F. J. (2018b). The impact of different competitive environments on pacing and performance. International Journal of Sports Physiology and Performance, 13(6), 701–708. doi:10.1123/ijspp.2017-0407
- Konings, M. J., & Hettinga, F. J. (2018c). Pacing decision making in sport and the effects of interpersonal competition: A critical review. Sports Medicine, 48(8), 1829–1843. doi:10.1007/s40279-018-0937-x
- Konings, M. J., & Hettinga, F. J. (2018d). The effect of preceding race efforts on pacing and short-track speed skating performance. International Journal of Sports Physiology and Performance, 13(8), 970–976. doi:10.1123/ijspp.2017-0637
- Konings, M. J., Noorbergen, O. S., Parry, D., & Hettinga, F. J. (2016). Pacing behavior and tactical positioning in 1500 m short-track speed skating. International Journal of Sports Physiology and Performance, 11(1), 122–129. doi:10.1123/ijspp.2015-0137
- Landry, T., Gagnon, L., & Laurendeau, D. (2013). A GIS-centric optical tracking system and lap simulator for short track speed skating. 2013 International Conference on Computer and Robot Vision. 2013. pp. 288–294, doi:10.1109/CRV.2013.11
- Maw, S., Proctor, L., Vredenburg, J., & Ehlers, P. (2006). Influence of starting position on finishing position in World Cup 500 m short-track speed skating. Journal of Sports Sciences, 24(12), 1239–1246. doi:10.1080/02640410500497733
- Menting, S. G. P., Konings, M. J., Elferink-Gemser, M. T., & Hettinga, F. J. (2019). Pacing behavior of elite youth athletes: Analyzing 1500 m short-track speed skating. International Journal of Sports Physiology and Performance, 14(2), 222–231. doi:10.1123/ijspp.2018-0285
- Micklewright, D., Parry, D., Robinson, T., Deacon, G., Renfree, A., Gibson, A. S. C., & Matthews, W. J. (2015). Risk perception influences athletic pacing strategy. Medicine and Science in Sports and Exercise, 47(5), 1026–1037. doi:10.1249/MSS.0000000000000500
- Muehlbauer, T., & Schindler, C. (2011). Relationship between starting and finishing position in short-track speed skating races. European Journal of Sport Science, 11(4), 225–230. doi:10.1080/17461391.2010.499968
- Noorbergen, O. S., Konings, M. J., Micklewright, D., Elferink-Gemser, M. T., & Hettinga, F. J. (2016). Pacing behavior and tactical positioning in 500- and 1000-m short-track speed skating. International Journal of Sports Physiology and Performance, 11(6), 742–748. doi:10.1123/ijspp.2015-0384
- Renfree, A., & Casado, A. (2018). Athletic races represent complex systems, and pacing behavior should be viewed as an emergent phenomenon. Frontiers in Physiology, 9(OCT), 1–6. doi:10.3389/fphys.2018.01432
- Renfree, A., Martin, L., Micklewright, D., & St Clair Gibson, A. (2014). Application of decision-making theory to the regulation of muscular work rate during self-paced competitive endurance activity. Sports Medicine, 44(2), 147–158. doi:10.1007/s40279-013-0107-0
- Rundell, K. W. (1996). Effects of drafting during short-track speed skating. Medicine and Science in Sports and Exercise, 28(6), 765–771. doi:10.1097/00005768-199606000-00016
- Smits, B. L. M., Pepping, G.-J., & Hettinga, F. J. (2014). Pacing and decision making in sport and exercise: The roles of perception and action in the regulation of exercise intensity. Sports Medicine, 44(6), 763–775. doi:10.1007/s40279-014-0163-0