
ABSTRACT
Part 1 of this genetic association series highlighted several genetic variants independently associated with elite status in rugby. However, it is highly likely that the genetic influence on elite status is polygenic due to the interaction of multiple genes. Therefore, the aim of the present study was to investigate whether polygenic profiles of elite rugby athletes differed from non-athletes utilising 13 genetic polymorphisms previously associated with tendon/ligament injury. Total genotype score (TGS) was calculated and multifactor dimensionality reduction (MDR) was used to calculate SNP-SNP epistasis interactions. Based on our elite rugby data from Part 1, mean TGS was significantly higher in elite rugby athletes (52.1 ± 10.7) than non-athletes (48.7 ± 10.8). There were more elite rugby athletes (54%) within the upper TGS quartile, and fewer (46%) within the lower quartile, compared to non-athletes (31% and 69%, respectively; P = 5·10−5), and the TGS was able to distinguish between elite rugby athletes and non-athletes (area under the curve = 0.59; 95% confidence interval 0.55-0.63; P = 9·10−7). Furthermore, MDR identified a three-SNP model of COL5A1 rs12722, COL5A1 rs3196378 and MIR608 rs4919510 that was best able to predict elite athlete status, with a greater frequency of the CC-CC-CC genotype combination in elite rugby athletes (9.8%) than non-athletes (5.3%). We propose that elite rugby athletes possess “preferable” musculoskeletal soft-tissue injury-associated polygenic profiles that have helped them achieve success in the high injury risk environment of rugby. These data may, in future, have implications for the individual management of musculoskeletal soft-tissue injury.
Highlights
Elite rugby athletes have preferable polygenic profiles to non-athletes in terms of genetic variants previously associated with musculoskeletal soft-tissue injury.
The total genotype score was able to distinguish between elite rugby athletes and non-athletes.
COL5A1 rs12722, COL5A1 rs3196378 and MIR608 rs4919510 produced the best model for predicting elite athlete status.
We propose that elite rugby athletes may have an inherited advantage to achieving elite status due to an increased resistance to soft-tissue injury.
Introduction
Part 1 of this genetic association series highlighted several genetic variants independently associated with elite status in rugby. The studied genetic variants were previously associated with soft-tissue injury risk and were deemed important to investigate due to rugby having one of the highest incidence of injury (83/1000 h Williams et al., Citation2013) compared to other team sports. This may in part be down to the increasing size and strength of the athletes (Sedeaud et al., Citation2013), which likely result in greater momentum during collisions, as well as accelerations and decelerations. The majority of injuries within rugby are to the tendon, ligament and muscle (Williams et al., Citation2013), with muscle/tendon (50%) and joint/ligament (32.7%) injuries accounting for >80% of all injuries (Schwellnus et al., Citation2014). More recent research that analysed match injury data across 16-seasons of the English Premiership found that sprains and ligament injuries had the highest incidence of injury and they also had the highest burden (22.6/1000 h and 30 days, respectively) (West et al., Citation2021). Injury incidence and severity appear to differ across rugby codes, with rugby league (RL) having approximately twice the incidence of rugby union (RU) (King et al., Citation2014). Additionally, injuries differ across RU playing position with backs having a higher incidence and severity compared to forwards (Fuller et al., Citation2015). Part 1 demonstrated differing genetic characteristics between elite rugby athletes and non-athletes across several genetic polymorphisms previously associated with soft-tissue injury. Therefore, investigating the polygenic components of these injuries including in the context of playing position which vary in terms of physiological demands, may increase knowledge of inter-individual variability of training load and match play exposure, which may enable a reduction in injury risk.
In a recent investigation utilising a twin study approach, anterior cruciate ligament (ACL) rupture was found to be ∼69% heritable (Magnusson et al., Citation2020). It is highly likely that this is polygenic in nature, rather than due to one genetic variant. Therefore, investigating the polygenic extent of a phenotype is a worthy proposition. Previous work has utilised the total genotype score (TGS) to indicate the magnitude of an individual’s genetic predisposition for disease risk and athletic performance (Eynon et al., Citation2011; Gómez-Gallego et al., Citation2010; Ruiz et al., Citation2009; Williams & Folland, Citation2008). The TGS model established by Williams and Folland (Citation2008) is a genetic algorithm that indicates the proportion of “preferable” genotypes possessed in relation to a specific phenotype. Individuals with higher TGS results are thought to possess the more optimal polygenic profile for the targeted phenotype. This approach can be applied to determine an individual’s genetic predisposition to elite athlete status or injury risk.
The potential polygenic nature of soft-tissue injury risk has been demonstrated previously by Raleigh et al. (Citation2009) who found an interaction between the MMP3 rs679620 and the COL5A1 rs12722 single nucleotide polymorphisms (SNPs) modified risk of Achilles tendinopathy. When the A and C alleles of MMP3 rs679620 and COL5A1 rs12722, respectively, were combined (allele combinations), they were associated with absence of Achilles tendinopathy (P = 0.002) (Raleigh et al., Citation2009). Similar research by Abrahams et al. (Citation2013) found that the combination of the CC genotype of MIR608 rs4919510 and the CA genotype of COL5A1 rs3196378 was overrepresented in an Achilles tendinopathy cohort compared to uninjured controls. Additional supporting evidence of a polygenic risk of injury has been found for Achilles tendon pathology involving the COL5A1 (Brown et al., Citation2017), MMP3 (Gibbon et al., Citation2017) and VEGFA (Rahim et al., Citation2016) genes, and for anterior cruciate ligament injury involving polymorphisms within the MMP1, MMP3, MMP10 and MMP12 genes, (Posthumus et al., Citation2012) and also COL5A1 (Stępień-Słodkowska et al., Citation2015). It therefore appears that a combination of “preferable” genetic variants might reduce the risk of musculoskeletal (MSK) soft-tissue injury.
Given the association of genetic markers with injury risk individually and in combination, it is plausible that elite rugby athletes may possess an inherited resistance against MSK soft-tissue injury, which has enabled them to achieve elite status despite exposure to the high-risk environment of elite rugby. Previous work by Heffernan et al. (Citation2017) found elite rugby athletes carried more of the protective C alleles of the COL5A1 rs12722 and rs3196378 polymorphisms than non-athletes and were more likely to possess the C-C inferred haplotype and the CC-CC SNP-SNP combination at those loci. Those data suggest an inherited resistance against MSK soft-tissue injury could increase the ability to withstand years of a high volume of intense training and match play, and thus contribute to the attainment of elite competitive status. Additionally, Part 1 identified several further MSK soft-tissue injury-associated genetic variants to also be associated with elite status in rugby. Consequently, the objective of the present study was to expand on the work presented in Part 1 and that of Heffernan et al. (Citation2017) by investigating if more complex polygenic profiles, indicative of tendon and ligament injury risk, differ between elite rugby athletes and a non-athlete population. It was hypothesised that elite rugby athletes would have a lower frequency of the potential injury risk allele/genotype combinations than non-athletes.
Method
Participants
This study was conducted in accordance with the STROBE guidelines for a case–control observational study (von Elm et al., Citation2007). Manchester Metropolitan University, the University of Glasgow and the University of Cape Town ethics committees granted approval of this study, which complies with the Declaration of Helsinki (Ethics code: 12.07.11 (i)). The participants were from the ongoing RugbyGene project which began in 2011, comprising elite Caucasian male rugby athletes (RA) (n = 663; mean (standard deviation) height 1.85 (0.07) m, mass 101 (12) kg, body mass index (BMI) 29.5 (2.2), age 29 (7) yr) including 62.2% British, 13.6% South African, 10.5% Irish, 8.7% Italian and 5% of other nationalities were recruited, having given written informed consent. Caucasian non-athletes (NA) had no competitive history in any sport (n = 909, 44% male, height 1.70 (0.10) m, mass 72 (13) kg, BMI 24.9 (3.1), age 41 (23) yr) included 94.8% British, 3.5% South African and 1.7% other nationalities. For TGS and SNP-SNP epistasis interaction analyses, 590 elite rugby athletes (height 1.86 (0.07) m, mass 100 (11) kg, body mass index (BMI) 28.9 (2.1), age 29 (7) yr) and 436 non-athletes (height 1.72 (0.9) m, mass 75 (11) kg, BMI 25.4 (3.0), age 42 (22) yr) were utilised as they contained full data sets for each polymorphism. Rugby players were considered elite if they had competed regularly (∼5 matches) since 1995 in the highest professional league in the UK, Ireland, or South Africa for RU and the highest professional league in the UK for RL. 49.1% of the RU athletes had competed at international level for a “high performance union” (Regulation 16, http://www.worldrugby.org), and 42% of RL athletes had competed at international level. It should be noted that for COL5A1 (rs12722) and COL5A1 (rs3196378) data for 540 elite male rugby athletes and 565 non-athletes were utilised previously by Heffernan et al. (Citation2017).
Procedures
The procedures are consistent with those reported in Part 1. Blood, buccal swab or saliva samples were attained via the following procedures. Blood was drawn from a superficial forearm vein into an EDTA tube, saliva samples were collected into Oragene DNA OG-500 collection tubes (DNA Genotek, Ottawa, Ontario, Canada) and sterile buccal swabs (Omni swab; Whatman, Springfield Mill, UK) were rubbed against the buccal mucosa of the cheek for ∼30 s.
DNA isolation was performed in the Manchester, Glasgow, and Cape Town laboratories. In Manchester and Glasgow, DNA isolation was performed with the QIAamp DNA Blood Mini kit and standard spin column protocol (Qiagen, West Sussex, UK). Briefly, 200 μL of whole blood/saliva, or one buccal swab, was lysed and incubated, the DNA washed, and the eluate containing isolated DNA stored at 4°C. In Cape Town, DNA was isolated from whole blood by a different protocol (Lahiri & Nurnberger, Citation1991). Briefly, 5 mL blood samples were lysed, washed, and incubated. Isolated DNA samples were stored at −20°C until further analysis.
Genotyping for COLGALT1 (rs8090), COL1A1 (rs1800012), COL3A1 (rs1800255), COL5A1 (rs12722), COL5A1 (rs3196378) KDR (rs1870377), MIR608 (rs4919510), MMP3 (rs679620, rs591058 and rs650108), NID1 (rs4660148), TIMP2 (rs4789932) and VEGFA (rs699947) was performed using two protocols. Protocol one: Approximately 40% of the DNA samples were genotyped via real-time PCR using a StepOnePlus (Applied Biosystems, Paisley, UK) as previously described (Heffernan et al., Citation2017), with adjustment of thermocycling conditions depending on reagents utilised. Protocol two: Approximately 60% of the DNA samples were genotyped by combining 2 μL GTXpress Master Mix (Applied Biosystems), 0.2 μL Fast GT Sample Loading Reagent (Fluidigm, Cambridge, UK), 0.2 μL H2O and 1.6 μL of purified DNA, for samples derived from blood and saliva. Furthermore, 1.78 μL assay (Applied Biosystems), 1.78 μL Assay Loading Reagent (Fluidigm) and 0.18 μL ROX reference dye (Invitrogen, Paisley, UK) were combined per assay inlet. An integrated fluid circuit controller RX (Fluidigm) was used to mix samples and assays using a Load Mix (166x) script. PCR was performed using a real-time FC1 Cycler (Fluidigm) GT 192X24 Fast v1 protocol. The 192X24 microchip plate was then placed into the EP1 Reader (Fluidigm) for end-point analysis. Duplicates of all samples were in 100% agreement for both protocols. For both protocols, the appropriate TaqMan assays were utilised (Applied Biosystems) and assay context sequences for each polymorphism are in the supplementary material.
RU forwards, backs and positional roles
To examine TGS results within the RU cohort, athletes were placed into subgroups according to their movement patterns. The two sub-groups were defined as RU forwards (props, hookers, locks, flankers, number eights) and RU backs (scrum halves, fly halves, centres, wings, full backs) (Cahill et al., Citation2013).
Calculation of TGS
The current literature regarding genetic associations with soft-tissue injury is equivocal, therefore three different TGS models were utilised for analysis; (1) TGS based on prior literature for genetic associations with MSK soft-tissue injury, utilising all 13 aforementioned polymorphisms (); (2) TGS based on elite rugby athlete frequency data from Part 1 regardless of prior literature, utilising all 13 aforementioned polymorphisms (Supplementary Material Table 1); and (3) TGS based on elite rugby athlete frequency data of the seven SNPs previously associated with elite status in rugby in Part 1 COLGALT1 (rs8090), COL3A1 (rs1800255), COL5A1 (rs12722 and rs3196378), MIR608 (rs4919510), MMP3 (rs591058) and NID1 (rs4660148) (Supplementary Material Table 2).
Table 1. Genotype score of each polymorphism based on literature (TGS Model 1), and genotype frequencies in elite rugby athletes and non-athletes from Part 1.
To quantify the combined influence of the candidate polymorphisms (, and Supplementary Material Tables 2 and 3) an additive TGS algorithm was utilised (Williams & Folland, Citation2008), based on the assumption of codominant effects of the alleles. The homozygote genotypes associated with lower soft-tissue injury risk and therefore considered “preferable” were allocated a “genotype score” of 2, heterozygote genotypes were scored 1 and the “non-preferable” homozygote genotypes were scored 0.
Prior literature based TGS Model 1 and elite data-based Model 2:
TGS algorithm: TGS = (100/26) * (COLGALT1rs8090 + COL1A1rs1800012 + COL3A1rs1800255 + COL5A1rs12722 + COL5A1rs3196378 + KDRrs1870377 + MIR608rs4919510 + MMP3rs679620 + MMP3rs591058 MMP3rs650108 + NID1rs4660148 + TIMP2rs4789932 + VEGFArs699947)
Previously associated elite status TGS Model 3:
TGS algorithm: TGS = (100/14) * (COLGALT1rs8090 + COL3A1rs1800255 + COL5A1rs12722 + COL5A1rs3196378 + MIR608rs4919510 + MMP3rs591058 + NID1rs4660148)
A TGS of 100 represents the “perfect” polygenic profile for soft-tissue injury risk and 0 represents the “worst” possible outcome for the candidate genes examined in this study.
Data analysis
TGS data for all groups was not normally distributed, therefore Mann–Whitney U tests were utilised to compare TGS differences between athlete groups and non-athletes. Means and extent of kurtosis were calculated to describe the distribution of TGS within groups. Pearson’s Chi-square (χ2) tests were used to compare the frequency of athletes and non-athletes in the top and bottom quartile of TGS scores. Bonferroni adjustment was utilised for each TGS approach where appropriate to control for false discovery. With 80% statistical power, analyses of all TGS models between all rugby athletes and non-athletes were able to detect a small effect size (w) of 0.12 and analysis between positional subgroups (RU forwards and RU backs) and non-athletes were able to detect a small effect size (w) of 0.15. We also evaluated the ability of the TGS to correctly distinguish elite athletes from non-athletes by receiver operating characteristic (ROC) curves, calculating the area under the curve (AUC) and 95% confidence intervals (95% CI). Multifactor dimensionality reduction (MDR) software (https://sourceforge.net/projects/mdr/) was used to calculate SNP-SNP epistasis interactions (Moore et al., Citation2006). Haplotypes were inferred using SNPStats (Solé et al., Citation2006). SPSS for Windows version 26 (SPSS, Chicago, IL) software was used for analysis. P values < 0.05 were considered statistically significant.
Results
TGS analyses
Athletes (all male) were taller, heavier and had higher BMI (P < 0.05) than the male non-athletes. For the TGS based on prior literature (Model 1), there were no differences in TGS between any rugby athlete group and NA (RA vs. NA, RU vs. NA, RL vs. NA, RU forwards vs. NA and RU backs vs. NA) (P ≥ 0.076, see Supplementary Material section 1). Mean (standard deviation) and kurtosis statistics are reported in supplementary Table 3, frequency distribution for RA and NA shown in (a). Similarly, when the numbers of athletes (including discrete groups) and NA in the upper and lower 25% of TGSs were compared, no significant differences were found. Accordingly, the TGS could not distinguish between elite rugby athletes and NA (AUC = 0.519, 95% CI = 0.48–0.55; P = 0.305), nor between NA and any other athlete group (see Supplementary Material section 1).
Figure 1. Frequency distribution of TGS based on: (a) prior literature as calculated from (Model 1) Mean (SE) kurtosis statistics in all rugby athletes were −0.063 (0.201) and non-athletes was −0.130 (0.233). (b) Elite rugby athlete data as calculated from Supplementary Material Table 1 (Model 2). Mean (SE) kurtosis statistic in all rugby athletes was −0.320 (0.201) and non-athletes was 0.096 (0.233). (c) SNPs previously associated with elite status in rugby as calculated from Supplementary Material Table 2 (Model 3)Mean (SE) kurtosis statistic in All rugby athletes was −0.161 (0.201) and non-athletes was 0.296 (0.233). Non-athletes (n = 436), All rugby athletes (n = 589).
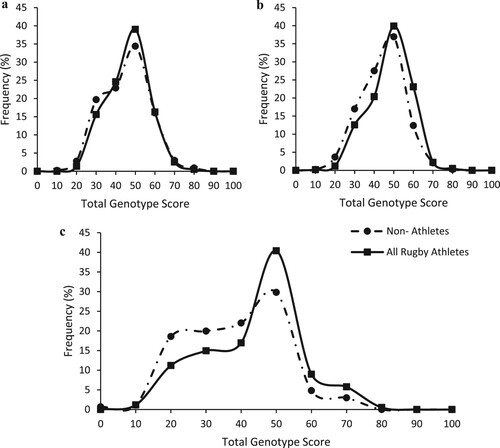
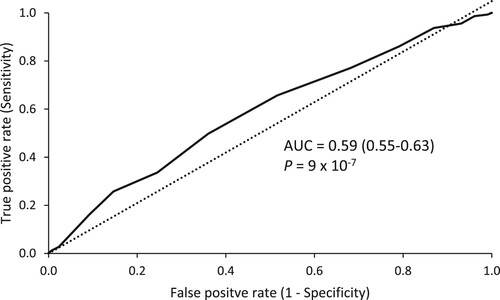
For the TGS based on our data in elite rugby athletes (Model 2), there was a significant difference between the TGS of RA compared to NA (P = 8 × 10⁻⁷), and this pattern was seen across all sub-groups compared to NA (RU vs. NA: P = 4 × 10⁻⁶, RL vs. NA: P = 0.002, RU forwards vs. NA: P = 1 × 10⁻⁵, RU backs vs NA: P = 0.002). Mean (standard deviation) and kurtosis statistics are reported in Supplementary Material Table 3 and frequency distribution for RA and NA shown in (b). When the top and bottom TGS quartiles were compared between athletes (including discrete groups) and non-athletes, athletes had a significantly higher frequency in the top 25% as well as a lower frequency within the bottom 25% TGS (Top 25%: RA = 54% vs. NA = 31%; Bottom 25%: RA = 46% vs. NA = 69%; χ2 = 16.4, P = 5 × 10⁻⁵). This persisted across all sub-groups compared to NA. Furthermore, the TGS could distinguish between elite rugby athletes and NA (AUC = 0.59; 95% CI: 0.55–0.63; P = 9 × 10⁻⁷, ) and this pattern occurred across all sub-groups compared to NA (see Supplementary Material section 1).
Figure 2. Receiver operating characteristic curve (ROC) summarising the ability of TGS to classify elite status in rugby from non-athletes AUC indicates the area under the curve (95% confidence intervals).
For the TGS based on previous associations with elite status (Model 3), there was a significant difference between the TGS of RA compared to NA (P = 8 × 10⁻¹⁰) and this pattern was seen across all sub-groups compared to NA (RU vs. NA: P = 2 × 10⁻⁹, RL vs. NA: P = 0.002, RU forwards vs. NA: P = 8 × 10⁻⁹, RU backs vs. NA: P = 5 × 10⁻⁵). Mean (standard deviation) and kurtosis statistics are reported in Supplementary Material Table 3 and frequency distribution for RA vs NA is shown in (c). When the frequency of athletes (including sub-groups) and NA in the top and bottom TGS quartiles were compared, athletes had a significantly higher frequency in the top 25% as well as a lower frequency within the bottom 25% (Top 25%: RA = 75% vs. NA = 50%; Bottom 25%: RA = 25% vs. NA = 50%; χ2 = 12.1, P = 0.001). This was also found across all rugby union sub-groups compared to NA. Consequently, the TGS could distinguish between elite rugby athletes and NA (AUC = 0.61; 95% CI: 0.58–0.65; P = 1 × 10⁻⁹) and this persisted across all sub-groups compared to NA (see Supplementary Material section 1).
Haplotype and SNP epistasis analysis
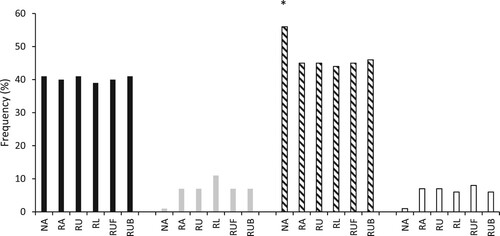
Multifactor dimensionality reduction analysis found the COL5A1 rs12722, COL5A1 rs3196378 and MIR608 rs4919510 polymorphisms produced the best model for predicting elite athlete status. There was a greater frequency of the CC-CC-CC genotype combination in RA (9.8%), RU (10.6%), RU backs (9.6%) and to the greatest extent RU forwards (11.3%; OR = 2.3; 95% CI = 1.3–3.9) than in NA (5.3%; all comparisons P < 0.001). Accordingly, the T-A inferred haplotype frequency constructed from COL5A1 rs12722 and COL5A1 rs3196378 was higher in NA than all athlete groups (P < 0.022, , highest OR for NA vs. RLA: OR = 1.69; 95% CI = 0.96–2.97; P < 0.012, lowest OR for NA vs. RU: OR 1.56; 95% CI = 0.89–2.73; P < 0.022). However, there were no differences between athlete and NA groups for the MMP3 T-G-A inferred haplotype frequency constructed from rs591058, rs650108 and rs679620 (P > 0.12).
Figure 3. Inferred haplotype frequencies derived from COL5A1 rs12722 and rs3196378. Black bars = C-C, grey bars = C-A, diagonal line bars = T-A, clear bars = T-C. *different from all other groups (P < 0.022).
Discussion
The present study investigated MSK soft-tissue injury-associated genetic variants combined in polygenic profiles for determining elite status in rugby. For the 13 polymorphisms used in TGS Model 2 based on elite rugby athlete data, differences were found between elite rugby athletes and non-athletes, persisting across all athlete sub-groups (RA vs. NA, RU vs. NA, RL vs. NA, RU forwards vs. NA and RU backs vs. NA), indicating that a likely inherited resistance to MSK soft-tissue injury may enable career success. Furthermore, when seven polymorphisms previously associated with elite status in rugby were combined (Model 3), differences were found in TGS between elite rugby athletes and non-athletes and this was consistent for all sub-groups. This demonstrates that a polygenic approach utilising only polymorphisms previously associated with elite status in a given sport may be more precise. Indeed, multifactor dimensionality reduction analysis found that a three-SNP model of COL5A1 rs12722, COL5A1 rs3196378 and MIR608 rs4919510 was most able to predict elite athlete status, with a greater frequency of the CC-CC-CC genotype combination in elite rugby athletes which persisted across all sub-groups.
The TGS model based on prior literature (Model 1) showed no difference between elite rugby athletes and non-athletes. These findings would suggest that elite rugby athletes do not carry “preferable” soft-tissue injury-associated polygenic profiles compared to non-athletes. A possible explanation is the equivocal evidence within the prior literature regarding the identified “risk” allele of each SNP. Of the 13 SNPs investigated, only three (COL1A1 rs1800012, COL3A1 rs1800255 and COL5A1 rs12722) have had their identified “risk” alleles replicated in a separate Caucasian cohort (reviewed in Brazier et al., Citation2019). Based on this TGS model, elite rugby athletes had a higher frequency (not all significant) of “protective” alleles for seven of the SNPs compared to non-athletes, while for the remaining six polymorphisms elite rugby athletes were found to have a higher frequency (not all significant) of the “risk” alleles. Evidently, using equivocal prior literature produced a TGS model with low discriminatory power. Hence, two further TGS models were employed within this study.
When the TGS algorithm was based on elite rugby athlete data (Model 2) from Part 1, there was a higher mean TGS in elite rugby athletes across all groups (RA, RU, RL, RU forwards and RU backs) than non-athletes. This aligns with previous research on elite athlete status reporting higher performance-associated TGSs in elite cyclists and track and field athletes (Eynon et al., Citation2011; Ruiz et al., Citation2009). Elite rugby athletes were chosen for this study due to their relatively consistent exposure to a high environmental soft-tissue injury risk compared to other sporting populations. However, the consistent higher mean TGS across rugby codes and playing positions compared to non-athletes suggests that variation in physical characteristics, environmental risks and training/match loads in elite rugby do not affect the genetic association with elite status. Indeed, this was more apparent when the top and bottom TGS quartiles were compared, with elite rugby athletes more common in the top quartile and less common in the bottom quartile, which persisted across all groups. This suggests the possibility of “preferable” polygenic MSK soft-tissue injury-associated profiles for achieving elite status in rugby. For six of the included SNPs within this study, elite rugby athletes had higher frequencies (not all significant) of the perceived “risk” allele. However, the evidence behind the “risk” alleles and their mechanisms is relatively inconclusive and still needs to be fully elucidated. As such, it could be that some of the variants we observed in elite rugby athletes may be of benefit to achieving elite athlete status via a mechanism other than injury protection.
The likelihood of an athlete carrying all the “preferable alleles” related to MSK soft-tissue injury risk decreases as the number of polymorphisms included in the TGS increases. Furthermore, it has previously been reported that the inclusion of non-associated SNPs in a TGS model can reduce its accuracy (Yvert et al., Oct Citation2016). Of the 13 SNPs investigated using the elite data-based TGS (Model 2), seven have been previously associated with elite status using our rugby athletes (Part 1). Hence, it is possible that the six non-associated polymorphisms included may have little or no influence on soft-tissue injury risk and/or ability to achieve elite athlete status in rugby. Therefore, a further TGS model to improve the accuracy was utilised including only SNPs previously associated with elite athlete status (Model 3). When the seven SNPs associated with elite athlete status (Part 1) were combined, rugby athletes had a higher mean TGS than non-athletes and this pattern continued across all sub-groups. Furthermore, the seven-SNP TGS (Model 3) provided a better discriminating accuracy for elite status than the 13-SNP Model 2 (AUC = 0.61; P = 1 × 10⁻⁹, AUC = 0.59; P = 9 × 10⁻⁷, respectively). Although Model 3 did provide a better discriminating accuracy, it should be noted that both TGS models (2 and 3) only demonstrated a moderate ability to discriminate between non-athletes and elite status.
We cannot exclude the possibility that the three different TGS models included polymorphisms that have no influence on MSK soft-tissue injury risk. Furthermore, all three TGS models gave equal weighting to all polymorphisms, as it was assumed allelic effects would be codominant and that each polymorphism contributed equally. It is unlikely that this is the case, as indicated by MDR analysis that identified a three-SNP model of COL5A1 rs12722, COL5A1 rs3196378 and MIR608 rs4919510 as best able to predict elite athlete status. Indeed, the CC-CC-CC genotype combination was more common in all athlete groups apart from RL, compared to non-athletes. Interactions between COL5A1 and MIR608 and risk of Achilles tendinopathy have previously been reported (Abrahams et al., Citation2013). Furthermore, the C alleles of COL5A1 rs12722 and COL5A1 rs3196378 have been identified as “protective” from Achilles tendinopathy and ligament injury (O’Connell et al., Citation2015; Posthumus, Citation2009; September et al., Citation2009), which suggests that the C allele may be beneficial in protecting against tendon and ligament injuries. Conversely, the CC genotype of MIR608 rs4919510 was found to be associated with Achilles tendinopathy (Abrahams et al., Citation2013), however these results have not been replicated. To date, how these polymorphisms might influence injury risk has not been demonstrated mechanistically. Nevertheless, it appears that a combination of COL5A1 rs12722, COL5A1 rs3196378 and MIR608 rs4919510 may be beneficial for rugby athletes to achieve elite status, possibly through a greater resistance to soft-tissue injury. This is further supported by the higher COL5A1 T-A inferred haplotype frequency constructed from rs12722 and COL5A1 rs3196378 in non-athletes than all athlete groups, with non-athletes having ∼60% higher odds of carrying T-A than athletes.
A limitation within this study is that only 13 polymorphisms were investigated, thus the addition of further polymorphisms related to potential soft-tissue injury risk should enhance discriminatory ability in future. An additional limitation is that the present study is focused on elite male rugby athletes, so these results might not be replicated in other populations and equivalent sport-specific investigations are encouraged. We also did not control for potential confounding factors such as age, height, BMI and sex (within non-athletes), as this study focused purely on genetics. Future studies investigating the combination of genetics and injury risk must control for these. Elite athletic traits are extremely complex involving numerous intrinsic and extrinsic factors. Thus, these data should be considered within that context, having focused specifically on a relatively small number of possible genetic variants.
Conclusion
We have presented the first polygenic models that discriminate between elite rugby athlete status and non-athletes based on polymorphisms previously associated with MSK soft-tissue injury risk. We observed that rugby athletes possess differing polygenic profiles to non-athletes which may have played a part in enabling them to attain elite status despite the high injury risk of training and competing in rugby. Future research should seek to replicate the present results in other cohorts and other sports, as well as identify additional polymorphisms that influence MSK soft-tissue injury risk because including them in a polygenic model will enhance discriminatory ability. Furthermore, analysing genetic data with injury data from rugby matches and training would enhance this area considerably. Understanding the genetics of MSK soft-tissue injury risk would be an important advance towards risk stratification in sport and a possible future use of polygenic profiles in screening and management of injury risk.
Supplemental Material
Download Zip (62.4 KB)Acknowledgements
The authors wish to thank all athletes, their respective scientific support staff and the control participants for their time and willingness to participate in the research.
Disclosure statement
No potential conflict of interest was reported by the author(s).
Additional information
Funding
References
- Abrahams, Y., Laguette, M. J., Prince, S., & Collins, M. (2013). Polymorphisms within the COL5A1 3′-UTR that alters mRNA structure and the MIR608 gene are associated with Achilles tendinopathy. Annals of Human Genetics, 77(3), 204–214. https://doi.org/10.1111/ahg.12013
- Altinisik, J., Meric, G., Erduran, M., Ates, O., Ulusal, A. E., & Akseki, D. (2015). The BstUI and DpnII variants of the COL5A1 gene are associated with tennis elbow. The American Journal of Sports Medicine, 43(7), 1784–1789. https://doi.org/10.1177/0363546515578661
- Brazier, J., Antrobus, M., & Stebbings, G. K. (2019). Tendon and ligament injuries in elite rugby: The potential genetic influence. Sports, 7(6), 138. https://doi.org/10.3390/sports7060138
- Brown, K. L., Seale, K. B., & El Khoury, L. Y. (2017). Polymorphisms within the COL5A1 gene and regulators of the extracellular matrix modify the risk of Achilles tendon pathology in a British case-control study. Journal of Sports Sciences, 35(15), 1475–1483. https://doi.org/10.1080/02640414.2016.1221524
- Cahill, N., Lamb, K., Worsfold, P., Headey, R., & Murray, S. (2013). The movement characteristics of English Premiership rugby union players. Journal of Sports Sciences, 31(3), 229–237. https://doi.org/10.1080/02640414.2012.727456
- El Khoury, L., Posthumus, M., Collins, M., Handley, C. J., Cook, J., & Raleigh, S. M. (2013). Polymorphic variation within the ADAMTS2, ADAMTS14, ADAMTS5, ADAM12 and TIMP2 genes and the risk of Achilles tendon pathology: A genetic association study. Journal of Science and Medicine in Sport, 16(6), 493–498. https://doi.org/10.1016/j.jsams.2013.02.006
- El Khoury, L., Ribbans, W. J., & Raleigh, S. M. (2016). MMP3 and TIMP2 gene variants as predisposing factors for Achilles tendon pathologies: Attempted replication study in a British case–control cohort. Meta Gene, 9, 52–55. https://doi.org/10.1016/j.mgene.2016.03.007
- Eynon, N., Ruiz, J. R., Meckel, Y., Morán, M., & Lucia, A. (2011). Mitochondrial biogenesis related endurance genotype score and sports performance in athletes. Mitochondrion, 11(1), 64–69. https://doi.org/10.1016/j.mito.2010.07.004
- Fuller, C. W., Taylor, A., Kemp, S. P. T., & Raftery, M. (2017). 2015: world Rugby injury surveillance study. British Journal of Sports Medicine, 51(1), 51–57. https://doi.org/10.1136/bjsports-2016-096275
- Gibbon, A., Hobbs, H., & van der Merwe, W. (2017). The MMP3 gene in musculoskeletal soft tissue injury risk profiling: A study in two independent sample groups. Journal of Sports Sciences, 35(7), 1–8. https://doi.org/10.1080/02640414.2016.1183806
- Gómez-Gallego, F., Ruiz, J. R., & Buxens, A. (2010). Are elite endurance athletes genetically predisposed to lower disease risk? Physiological Genomics, 41(1), 82–90. https://doi.org/10.1152/physiolgenomics.00183.2009
- Heffernan, S. M., Kilduff, L. P., & Erskine, R. M. (2017). COL5A1 gene variants previously associated with reduced soft tissue injury risk are associated with elite athlete status in rugby. BMC Genomics, 18(S8), 820. https://doi.org/10.1186/s12864-017-4187-3
- Khoschnau, S. (2008). Type I collagen alpha1 Sp1 polymorphism and the risk of cruciate ligament ruptures or shoulder dislocations. The American Journal of Sports Medicine, 36(12), 2432. https://doi.org/10.1177/0363546508320805
- Kim, S. K., Roos, T. R., & Roos, A. K. (2017). Genome-wide association screens for Achilles tendon and ACL tears and tendinopathy. PLoS One, 12(3), e0170422. https://doi.org/10.1371/journal.pone.0170422
- King, D., Gissane, C., Clark, T., & Marshall, S. (2014). The incidence of match and training injuries in rugby League: A pooled data analysis of published studies. International Journal of Sports Science and Coaching, 9(2), 417–431. https://doi.org/10.1260/1747-9541.9.2.417
- Lahiri, D. K., & Nurnberger, J. J. I. (1991). A rapid non-enzymatic method for the preparation of HMW DNA from blood for RFLP studies. Nucleic Acids Research, 19(19), 5444–5444. https://doi.org/10.1093/nar/19.19.5444
- Magnusson, K., Turkiewicz, A., Hughes, V., Frobell, R., & Englund, M. (2020). High genetic contribution to anterior cruciate ligament rupture: Heritability ∼69. British Journal of Sports Medicine, https://doi.org/10.1136/bjsports-2020-102392
- Mokone, G. G., Schwellnus, M. P., Noakes, T. D., & Collins, M. (2006). The COL5A1 gene and Achilles tendon pathology. Scandinavian Journal of Medicine and Science in Sports, 16(1), 19–26. https://doi.org/10.1111/j.1600-0838.2005.00439.x
- Moore, J. H., Gilbert, J. C., & Tsai, C.-T. (2006). A flexible computational framework for detecting, characterizing, and interpreting statistical patterns of epistasis in genetic studies of human disease susceptibility. Journal of Theoretical Biology, 241(2), 252–261. https://doi.org/10.1016/j.jtbi.2005.11.036
- O’Connell, K., Knight, H., & Ficek, K. (2015). Interactions between collagen gene variants and risk of anterior cruciate ligament rupture. European Journal of Sport Science, 15(4), 341–350. https://doi.org/10.1080/17461391.2014.936324
- Posthumus, M. (2009). The COL5A1 gene is associated with increased risk of anterior cruciate ligament ruptures in female participants. The American Journal of Sports Medicine, 37(11), 2234–2240. https://doi.org/10.1177/0363546509338266
- Posthumus, M., Collins, M., & van der Merwe, L. (2012). Matrix metalloproteinase genes on chromosome 11q22 and the risk of anterior cruciate ligament (ACL) rupture. Scandinavian Journal of Medicine & Science in Sports, 22(4), 523–533. https://doi.org/10.1111/j.1600-0838.2010.01270.x
- Rahim, M., El Khoury, L., & Raleigh, S. M. (2016). Human genetic variation, sport and exercise medicine, and Achilles tendinopathy:Role for angiogenesis-associated genes. OMICS: A Journal of Integrative Biology, 20(9), 520–527. https://doi.org/10.1089/omi.2016.0116
- Rahim, M., Gibbon, A., & Hobbs, H. (2014). The association of genes involved in the angiogenesis-associated signaling pathway with risk of anterior cruciate ligament rupture: Angiogenesis and ACL rupture risk. Journal of Orthopaedic Research, 32(12), 1612–1618. https://doi.org/10.1002/jor.22705
- Raleigh, S. M., Van Der Merwe, L., Ribbans, W. J., Smith, R. K. W., Schwellnus, M. P., & Collins, M. (2009). Variants within the MMP3 gene are associated with Achilles tendinopathy: Possible interaction with the COL5A1 gene. British Journal of Sports Medicine, 43(7), 514–520. https://doi.org/10.1136/bjsm.2008.053892
- Ruiz, J. R., GÃmez-Gallego, F. L., & Santiago, C. (2009). Is there an optimum endurance polygenic profile? The Journal of Physiology, 587(7), 1527–1534. https://doi.org/10.1113/jphysiol.2008.166645
- Schwellnus, M. P., Thomson, A., & Derman, W. (2014). More than 50% of players sustained a time-loss injury (>1 day of lost training or playing time) during the 2012 Super Rugby Union Tournament: A prospective cohort study of 17,340 player-hours. British Journal of Sports Medicine, 48(17), 1306–1315. https://doi.org/10.1136/bjsports-2014-093745
- Sedeaud, A., Vidalin, H., Tafflet, M., Marc, A., & Toussaint, J. F. (2013). Rugby morphologies: “bigger and taller”, reflects an early directional selection. Journal of Sport Medicine and Physical Fitness, 53(2), 185–191.
- September, A. V., Cook, J., Handley, C. J., Van Der Merwe, L., Schwellnus, M. P., & Collins, M. (2009). Variants within the COL5A1 gene are associated with Achilles tendinopathy in two populations. British Journal of Sports Medicine, 43(5), 357–365. https://doi.org/10.1136/bjsm.2008.048793
- Solé, X., Guinó, E., Valls, J., Iniesta, R., & Moreno, V. (2006). SNPStats: A web tool for the analysis of association studies. Bioinformatics, 22(15), 1928–1929. https://doi.org/10.1093/bioinformatics/btl268
- Stępien-Słodkowska, M., Ficek, K., & Eider, J. (2013). The +1245 g/t polymorphisms in the collagen type I alpha 1 (col1a1) gene in Polish skiers with anterior cruciate ligament injury. Biology of Sport, 30(1), 57. https://doi.org/10.5604/20831862.1029823
- Stępień-Słodkowska, M., Ficek, K., & Kaczmarczyk, M. (2015a). The variants within the COL5A1 gene are associated with reduced risk of anterior cruciate ligament injury in skiers. Journal of Human Kinetics, 45(1), 103–111. https://doi.org/10.1515/hukin-2015-0011
- Stępień-Słodkowska, M., Ficek, K., & Maciejewska-Karłowska, A. (2015b). Overrepresentation of the COL3A1 AA genotype in Polish skiers with anterior cruciate ligament injury. Biology of Sport, 32(2), 143–147. https://doi.org/10.5604/20831862.1144416
- von Elm, E., Altman, D. G., & Egger, M. (2007). The strengthening the reporting of observational studies in epidemiology (STROBE) statement: Guidelines for reporting observational studies. Preventive Medicine, 45(4), 247–251. https://doi.org/10.1016/j.ypmed.2007.08.012
- West, S. W., Starling, L., & Kemp, S. (2021). Trends in match injury risk in professional male rugby union: A 16-season review of 10 851 match injuries in the English premiership (2002–2019): The professional rugby injury surveillance project. British Journal of Sports Medicine, 55(12), 676-682. https://doi.org/10.1136/bjsports-2020-102529
- Williams, A. G., & Folland, J. P. (2008). Similarity of polygenic profiles limits the potential for elite human physical performance. The Journal of Physiology, 586(1), 113–121. https://doi.org/10.1113/jphysiol.2007.141887
- Williams, S., Trewartha, G., Kemp, S., & Stokes, K. (2013). A meta-analysis of injuries in senior men’s professional rugby union. Sports Medicine, 43(10), 1043–1055. https://doi.org/10.1007/s40279-013-0078-1
- Yvert, T., Miyamoto-Mikami, E., Murakami, H., Miyachi, M., Kawahara, T., & Fuku, N. (2016). Lack of replication of associations between multiple genetic polymorphisms and endurance athlete status in Japanese population. Physiological Reports, 4(20), e13003. https://doi.org/10.14814/phy2.13003