
ABSTRACT
This study investigated the impact of blood flow restriction (BFR) during treadmill walking on gait kinematics. Twenty-one participants completed one familiarisation and four experimental sessions, including two walking speeds (moderate [5.0 ± 0.3km·h−1] and fast [6.4 ± 0.4km·h−1]) and two occlusion conditions (BFR [60% of arterial occlusion pressure] and unrestricted). For each exercise intensity, the BFR session was performed first. Participants were instructed to walk as long as possible, with sessions capped at 20 min. Unrestricted sessions were time-matched, and the order of exercise intensity was randomised. Kinematics were collected over 10s every minute using retro-reflective markers affixed to specific body landmarks. Ratings of perceived exertion and discomfort were collected every two minutes. Blood samples were collected from the fingertip pre-exercise and the finger and toe post-exercise, and were analysed for lactate, electrolytes, and markers of cell-membrane damage. During the BFR sessions the cuffs remained inflated while the blood samples were collected. Fast-walk BFR sessions exhibited higher anterior trunk flexion (p = 0.001) and knee flexion during stance (p = 0.001) compared to all other sessions. Step width was increased during BFR sessions (p = 0.001), but no difference in step length (p = 0.300) or cadence (p = 0.922) were observed. The time required to elicit change in anterior trunk flexion and plantar-flexion angle at toe-off was shorter during BFR sessions (p = 0.024). The BFR sessions elicited the highest ratings of perceived exertion and discomfort, as well as blood lactate concentration (p ≤ 0.001). Application of BFR during moderate and fast treadmill walking modifies gait kinematics and exacerbates exercise-related sensations as well as blood lactate concentration.
Highlights
Applying blood flow restriction changes walking kinematics, causing an overall increase in anterior trunk flexion and knee flexion during stance while simultaneously reducing plantar-flexion angle at toe-off and ankle joint velocity.
Applying blood flow restriction exacerbate exercise-related sensations of exertion and discomfort.
Sample site does not influence the level of post-exercise blood lactate or markers of cell-membrane potential and damage.
Introduction
First popularised within resistance training, blood flow restriction (BFR) exercise involves the application of inflatable cuffs around the proximal end of the working limbs (Scott et al., Citation2015). This practice reduces arterial inflow while completely restricting venous outflow, creating a localised hypoxic environment (Loenneke et al., Citation2014). A benefit of BFR during resistance exercise is to reduce sessional mechanical work (Abe et al., Citation2006) without compromising muscular development (Scott et al., Citation2015). When BFR is applied during walking, similar increases in aerobic fitness (Park et al., Citation2010) and muscular strength (Abe et al., Citation2006) can be achieved at lower absolute exercise intensities compared with unrestricted walking. For these reasons, BFR-walking could potentially be a suitable exercise modality for load-compromised individuals, such as previously injured athletes, patients suffering from chronic musculoskeletal disorders or chronic gait dysfunction, to induce chronic adaptions typically associated with vigorous-intensity unrestricted aerobic exercise (Patterson et al., Citation2019).
Compared to unrestricted, the localised hypoxic environment mediated by BFR results in earlier force loss during resistance exercise (Husmann et al., Citation2018). When completing four sets [30, 15, 15, 15 repetitions] of leg extensions at 30% one repetition maximum, reductions in force production capacity developed from the first (90s occlusion) to the final (5 min total occlusion time) set (Husmann et al., Citation2018). While occlusion is typically limited to a few minutes during resistance exercise, BFR-walking can be prescribed continuously for up to 20 min (Patterson et al., Citation2019). Arguably, substantially longer occlusion periods may accentuate force loss experienced by the plantar flexors (i.e. gastrocnemius, triceps surae, and soleus muscles) during walking. To maintain walking speed, compensatory strategies may be employed, reallocating power generation to the knee and hip joints from the ankle to alter the relative contribution percentage of each joint (Huang et al., Citation2015). However, changes in walking technique have not been previously assessed during BFR-walking.
The exaggerated accumulation of systemic blood lactate during BFR exercise is well documented when compared to the unrestricted equivalent session (Miller et al., Citation2021). However, previous research has almost exclusively restricted their sampling to the systemic environment (Thomas et al., Citation2018). One potential concern with this sampling approach is that it may misrepresent the changes in not only lactate, but also markers of muscle breakdown and muscle membrane potential in the occluded environment prior to cuff deflation. Sampling from the systemic environment post-cuff deflation may allow for the dissipation of said products, which would not truly represent how the hypoxic environment impacts energy metabolism, muscle contractility and damage. Therefore, it may be important to obtain blood samples from the occluded environment before cuff deflation and compare them to blood sampled from the systemic environment. Similarly, perceptual responses to BFR exercise have almost exclusively concerned the whole body (Smith et al., Citation2022). Increases in exercise-related sensations during BFR-walking are specific to either the restricted or unrestricted segments, with higher levels of exertion and discomfort being reported within the occluded limb compared to the systemic environment (Walden et al., Citation2022). The consequences of a multileveled feeling of exertion and discomfort elicited by BFR on walking technique are also undetermined.
Therefore, the primary aim of this study was to assess the effects of moderate and fast BFR treadmill walking compared to the unrestricted equivalent on gait kinematics, with special consideration to ankle, knee and trunk angles. We hypothesised that applying BFR would alter gait kinematics, with earlier and larger biomechanical adjustments occurring at faster speeds. Our secondary aim was to determine how gait kinematics alter in relation to the concentration of post-exercise metabolite concentrations and the exercise-related sensations of exertion and discomfort. We hypothesised that BFR-mediated alterations in gait kinematics would be accompanied by higher levels of metabolites as well as ratings of perceived exertion and discomfort, at the faster speed in particular.
Methods
Participants
Twenty-one physically active adults (male n = 12 and female n = 9; age: 26 ± 4years; height: 174.3 ± 7.5 cm; weight: 73.7 ± 12.5 kg, BMI: 24.2 ± 2.9, physical activity participation: 388 ± 248 min·wk−1) volunteered. Participants were recruited if they were aged between 18 and 40 years, were able to walk unassisted, had no injuries that could be worsened by participating and had taken no substances (e.g. caffeine and alcohol 12hrs before each testing session) that could affect their perception of exertion and discomfort or improve their ability to complete the walking task. Participants provided signed informed consent. The study was approved by the Institutional Human Research Ethics Committee (2021/059).
Procedures
Familiarisation session
Arterial occlusion pressure (AOP) was determined in a supine position. A 10-cm wide cuff (Sports Rehab Tourniquet, QLD, Australia) was applied to the dominant leg, proximal to the knee as high on the thigh as possible and inflated until arterial blood flow was occluded. Total occlusion was determined when the visual and audible representation of a pulse at the posterior tibial artery couldn’t be detected via Doppler ultrasound (MD6 Doppler, Hokanson, WA, USA). The procedure was conducted three times, with 2 min between each. The three values were averaged and used as each participant’s AOP (Patterson et al., Citation2019). Walk-to-run transition speed was then determined on a treadmill (TMX55, Trackmaster, KS, USA), with participants blinded to the speed. All participants performed a 3 min warm-up at 3km·h−1 before the walk-to-run transition speed protocol began. Briefly, the treadmill’s speed was increased by 0.3km·h−1 every 30s and participants were instructed to transition from walking to jogging when they felt it more comfortable to jog (Nimbarte & Li, Citation2011). The procedure was repeated three times with a 3 min rest between each trial. The average of the three trials represented each participant’s walk-to-run transition speed (7.0 ± 0.6km·h−1).
Experimental sessions
Participants completed four separate experimental sessions, including walking with and without BFR at two intensities. They completed a BFR session first, followed by the speed-matched unrestricted session. The second BFR session was then completed, followed by its speed-matched unrestricted session. The order of intensity was randomised using a Latin squared approach. Sessions were separated by an average of 7 ± 1 days, and each participant completed their sessions at the same time of day (±2hrs). Participants were asked to avoid strenuous exercise and replicate their dietary and fluid intake for 24hrs before all experimental sessions.
On arrival, participants sat quietly for 5 min, before a 200μl capillary blood sample was collected from their fingertip into a heparinised tube (Microvette, Sarstedt, Germany). They were then affixed with retro-reflective markers on various anatomical landmarks according to a previously developed custom marker set (Campbell et al., Citation2009; Chin et al., Citation2010; Dempsey, Citation2007). Calibration movements included a static capture with the participant standing in the anatomical position, three bodyweight squats and lower limb swings (anterior/posterior leg swing, abduction/adduction leg swing and circular motion).
Participants rested in a standing position for 5 min before completing a 3 min warm-up at 50% (3.5 ± 0.3km·h−1) walk-to-run transition speed. When performing a BFR session, the cuffs were affixed post-warm-up while the participants were standing on the treadmill’s rails and inflated 10s before beginning the trial. Walking speed was set at 70% (5.0 ± 0.3km·h−1 [moderate]) and 90% (6.4 ± 0.4km·h−1 [fast]) of each participants walk-to-run transition speed. During BFR sessions, participants were instructed to walk for as long as possible. Trials were terminated if participants decided they could continue no longer or if they reached the cut-off time (20 min) (Patterson et al., Citation2019). On completion of the exercise, participants moved immediately to a blood station set up directly next to the treadmill. 200μl capillary blood samples were taken from the finger and big toe simultaneously. During the BFR sessions, the cuffs remained inflated while the samples were collected. Participants were blinded to the elapsed and cut-off time. Total exercise time for the unrestricted sessions matched the corresponding BFR session. Participants needed to walk for at least 5 min for their data to be included in the statistical analyses as this represents the current minimum prescription time (Patterson et al., Citation2019).
Measures
Kinematics
While walking, marker trajectories were tracked using a 12-camera motion capture system (Oqus3 + cameras [Qualisys AB, Gothenburg, Sweden], Qualisys Track Manager Software) at 150hz. Participants were blinded to the moments of data sampling (Morin et al., Citation2009). Sampling occurred during the last 10s of each minute. Data processing was conducted within Visual 3D (Version5, C-Motion, Germantown, USA). Marker trajectories were filtered with a 15 Hz 4th order low pass Butterworth filter. Functional calibration was used to locate knee flexion-extension axis and hip joint centres (Schwartz & Rozumalski, Citation2005). Joint angles were calculated using a standard joint coordinate system (Schwartz & Rozumalski, Citation2005; Wu et al., Citation2002). Heel contact and toe-off moments were automatically identified using the process described by Zeni et al. (Citation2008). The following data were extracted: maximal anterior and lateral trunk flexion per stride, plantar-flexion angle at toe-off, angular velocity of the ankle joint during push-off, knee flexion angle during stance, step length and width, and cadence. All variables were averaged for each complete step within the 10s capture (moderate: 20 ± 0.12 steps; fast: 22 ± 0.03 steps).
Plasma Electrolyte and metabolite markers
Blood samples were centrifuged (1500 centrifugal force; 10 min) immediately post-session, and the plasma was stored in the freezer at −80°C until batch analyses. Plasma samples were then analysed for lactate, electrolytes the denote membrane potential (sodium, chloride, potassium) and markers of cell-membrane damage (lactate dehydrogenase [LDH], Creatine Kinase [CK]) using a COBAS analyser (COBAS Integra 400 plus; Roche Diagnostics Ltd., Switzerland).
Perceptual responses
Participants rated their whole-body exertion (RPE) and discomfort within the lower limbs (RPD) using modified Borg CR10 scales every two minutes (Williams, Citation2017). The RPE measure was defined as how hard the participant felt their entire body working to keep up the treadmill’s pace. Alternatively, the RPD measure focused on discomfort experienced within the legs due to the exercise’s intensity and cuff pressure (Steele et al., Citation2016). Participants were familiarised with perceptual scales and what each measured during the familiarisation session. Participants were reintroduced to these measures at the beginning of each experimental session. All scales were anchored from 0 (rest/no discomfort) to 10 (maximal exertion/discomfort an individual had experienced during aerobic exercise).
Data and statistical analysis
All data analyses were carried out using Rstudio with the lme4 (Bates et al., Citation2014) package and data visualisation with ggplot2 (Wickham, Citation2011). All data are expressed as mean ± 95% confidence intervals. As not all participants were able to complete the entire exercise duration, when models were constructed to analyse across time, the walking trials were split into increments of 10%. For the participants unable to complete the entire walking duration, each collection point was allocated a percentage that represented the amount of session elapsed, with data then assigned to the nearest percentage timepoint. Test assumptions for all data were checked visually using histogram plots. Holm–Bonferroni method post hoc analyses were performed across all linear mixed models if significant main effects or interactions were observed. The level of statistical significance was set at p ≤ 0.05. Cohen’s dz effect sizes and percentage differences were calculated.
When investigating the kinematic data, no detectable violations were observed during visual inspection of the histogram plots. The analyses of the kinematic data were split into two parts. Firstly, the percentage of elapsed time when a significant kinematics change occurred was identified for each participant using a linear mix model where time, condition and walking speed were set as fixed effects and session order controlled as a random effect. This process was repeated for all extracted measures, excluding cadence. Change was identified when two consecutive time points were significantly lower (p ≤ 0.05) than the participants’ initial time point for the specific measure. The first of the two consecutive times was labelled as the point of change. The time points were then calculated into a percentage of total time. A second linear mixed model compared the change point data across the four sessions, with speed and condition assigned as fixed effects and participant and session order controlled as random effects. Secondly, individuals’ first and final captures were compared to investigate the sessional change across each measure. A linear mixed model was utilised with time, condition and walking speed identified as fixed effects and participant and session order controlled as a random effect.
The metabolic data were compared across the three collection points using a linear mixed model. A positive skew was identified for the measurement of lactate dehydrogenase. It was identified that a significant difference was apparent between sampling days. Therefore, the linear mixed model for all metabolic data was made up of fixed effects (condition and walking speed), random effects (participant and session order), as well as sampling day and pre and post as covariates. When exploring the subjective measures, all displayed a positive skew. To account for the skewness of the within-session measures, time, condition, and walking speed were controlled individually within the mixed linear model with session order and participant set as random effects.
Results
The average walking time for moderate-walking sessions was 19 ± 3 min, with 18 of the 21 participants reaching the 20 min cut-off point and three completing on average 12 ± 4 min. During the fast-walking sessions, the average walking time was 16 ± 7 min, with 15 of the 21 participants reaching the 20 min cut-off point and five completing on average 6 ± 4 min. Three participants’ fast-walking data were excluded as they did not complete 5 min.
Percentage of session elapsed when kinematic changes occurred are shown in . A main effect of condition (p = 0.011) and speed (p = 0.002) were identified for anterior trunk flexion. Post hoc analysis indicates that BFR sessions elicited change earlier than their unrestricted equivalent (+18.2%, p = 0.024, dz = 0.43). Additionally, fast-walk elicited change earlier than moderate-walk sessions (+36.0%, p < 0.001, dz = 0.96). A main effect of condition (p = 0.007) was identified for plantar-flexion angle at toe-off. Post hoc analysis indicates that BFR elicited change earlier than unrestricted (+18.1%, p = 0.001, dz = 0.59).
Table 1. Percentage of session elapsed when a significant change occurred in walking technique.
The changes in walking kinematics are displayed in . When investigating total change, walking speed × condition and time × condition interactions were observed for anterior trunk flexion (p < 0.001), knee flexion angle during stance (p < 0.001), plantar-flexion angle (p ≤ 0.042), and ankle joint velocity (p ≤ 0.005). Post hoc analysis indicated that anterior trunk flexion was higher during fast-walk BFR sessions at the first (+30.1%, p = 0.001, dz ≥ 0.34) and last (+37.0%, p = 0.001, dz ≥ 0.39) minute when compared to all other sessions. Anterior trunk flexion increased from first to last minute during all sessions (≥37.7%, p ≤ 0.001, dz ≥ 0.79). During stance, the supporting limb exhibited higher knee flexion within the fast-walk BFR session at the first (≥6.6%, p ≤ 0.013, dz ≥ 0.34) compared to all other sessions and the last (≥16.8%, p ≤ 0.001, dz ≥ 0.62) minute compared to both unrestricted sessions. Knee flexion in the supporting limb increased from the first to the last minute in all sessions (≥5.1%, p ≤ 0.01, dz ≥ 0.69), except the unrestricted fast-walk. Plantar-flexion angle and ankle joint velocity were lower at the first minutes during fast-walk BFR (−10.0%, p < 0.001, dz = 0.59; 3.8%, p < 0.001, dz = 0.57; respectively) compared to the unrestricted equivalent.
Figure 1. Change in walking kinematics across each walking session. (A) Anterior Trunk Flexion, (B) Lateral Trunk Flexion, (C) Plantar-Flexion Angle at Toe Off, (D) Ankle Velocity, (E) Knee Flexion During Stance, (F) Step Length, (G) Step Width, and (H) Cadence. ○ Moderate Walking, ● Moderate Walking + BFR, □ Fast Walking, ▪ Fast walking + BFR Data are presented as mean with corresponding 95% confidence intervals displayed. All data allocated a percentage representing the amount of session elapsed when collected before being assigned to the nearest 10 percent timepoint.
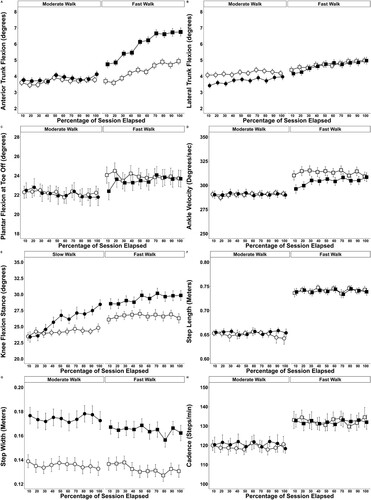
A speed × time interaction was observed for trunk lateral flexion (p = 0.03). Post hoc analysis identified fast-walk sessions exhibited increased lateral trunk flexion than moderate-walking sessions at the last minute (+23.0%, p < 0.026, dz = 0.58). A main effect of condition (p < 0.001) was observed for step width. Post hoc analysis identified that step width was wider during BFR compared to the unrestricted (+26.7%, dz = 1.17, p < 0.001).
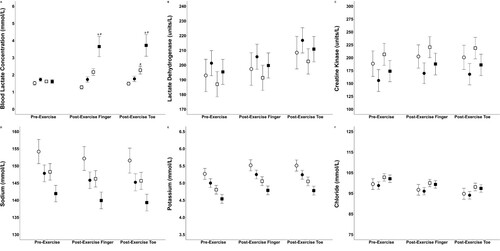
The concentration of blood lactate, electrolytes associated with cell membrane potential and enzymes that denote cell membrane breakdown are visually displayed on . Speed × time (p < 0.001), condition × time (p = 0.018), and speed × condition (p < 0.032) interactions were observed for lactate accumulation. Post hoc analysis indicated that lactate concentrations were higher at both post-exercise collection sites during fast-walk BFR sessions (finger: + 37.1%, p = 0.004, dz = 0.60; toe: + 38.0%, p = 0.019, dz = 0.62) when compared all other sessions. Fast-walk BFR sessions were higher at both post-exercise collections sites (finger: + 61.4%, p < 0.001, dz = 0.89; toe: + 63.7%, p < 0.001, dz = 0.93) compared to pre-exercise. A main effect of collection site was observed for potassium (p = 0.005), chloride (p = 0.004) and LDH (p = 0.012). Post hoc analysis indicated that potassium was higher at both post-exercise collection sites compared to pre-exercise (finger: + 5.2%, dz = 0.36; toe: + 5.0%, dz = 0.41). Chloride was lower at the post-exercise toe (−4.6%, dz = 0.32) compared to the pre-exercise collection site. LDH was higher at the post-exercise toe (+7.7%, dz = 0.24) compared to the pre-exercise collection site. A main effect of condition was observed for sodium (p = 0.012), potassium (p = 0.007) and CK (p = 0.003). Post hoc analysis indicated that all measures were higher during unrestricted compared to BFR sessions (sodium: + 1.9%, dz = 0.21, p = 0.012; potassium: + 1.0%, dz = 0.08, p = 0.007; CK: + 14.7%, dz = 0.22, p = 0.003).
Figure 2. Markers of anaerobic metabolism, membrane potential and breakdown are represented by (A) Blood lactate Concentration, (B) Lactate Dehydrogenase, (C) Creatine Kinase, (D) Sodium, (E) Potassium, and (F) Chloride. ○ Moderate Walking, ● Moderate Walking + BFR, □ Fast Walking, ▪ Fast walking + BFR Data are presented as collection point means with corresponding 95% confidence intervals are displayed. a Significantly different to all sessions, # Significantly different to pre-exercise.
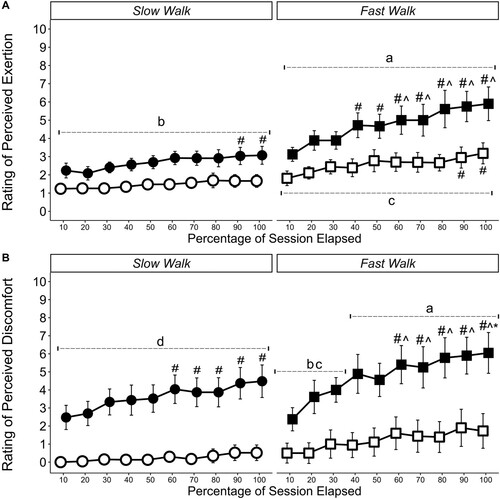
Subjective measures of RPE and RPD are displayed in . Time × condition and time × walking speed interactions were identified for RPE (p < 0.001) and RPD (p < 0.001). Post hoc analysis indicated that RPE reported during fast-walk BFR was higher than all other sessions across each time point (≥33.1%, p ≤ 0.001, dz ≥ 1.51) and moderate -walk BFR sessions were also higher than the unrestricted equivalent at all time points (≥55.4%, p ≤ 0.001, dz ≥ 1.58). When investigating RPD, the moderate and fast walk BFR sessions were higher than the unrestricted sessions at all time points (≥98.6%, p ≤ 0.001, dz ≥ 1.11).
Figure 3. Ratings of (A) Perceived Exertion and (B) Perceived Discomfort. ○ Moderate Walking, ● Moderate Walking + BFR, □ Fast Walking, ▪ Fast walking + BFR Data are presented as time point means with corresponding 95% confidence intervals are displayed. The scale ranged from 0 (rest/no discomfort) to 10 (maximal exertion or discomfort an individual had experienced during aerobic exercise). a Significantly different to all sessions b Significantly different to the unrestricted equivalent session, c Significantly different to unrestricted moderate walk, d Significantly different to both unrestricted sessions # Significantly different to 10 percent time point, ^ Significantly different to 30 percent time point, * Significantly different to 50 percent time point.
Discussion
The primary aim of this study was to identify whether moderate or fast BFR-walking would alter ankle, knee and trunk angles compared to the unrestricted session at the same speed. The main observations were i) changes in anterior trunk flexion and plantar-flexion angle at toe-off occurred earlier during BFR sessions, ii) anterior trunk flexion was higher during the fast-walk BFR session compared to all other sessions, iii) knee flexion angle during stance and step width were larger at the final collection point during BFR sessions. The secondary aim of this study was to determine changes in the concentration of post-exercise metabolite concentrations and the exercise-related sensations of exertion and discomfort. The main observations were i) blood lactate concentration was higher at the finger and toe post-fast-walk BFR compared to the unrestricted sessions, ii) under the current circumstances, BFR didn’t increase markers of muscle breakdown or indicators of compromised membrane potential, and iii) BFR sessions elicited higher ratings of exertion and discomfort. In line with our primary hypothesis, our results first indicate that BFR-walking alters an individual’s gait kinematics. Although the exact causes of reported kinematic changes couldn’t be ascertained, a combination of acute physiological, metabolic, and perceptual responses induced by BFR likely played a role.
The application of BFR resulted in earlier adjustments in gait kinematics, most notably in anterior trunk flexion and plantar-flexion angle at toe-off. However, BFR did not influence step length or cadence. The reduction in plantar-flexion angle is potentially associated with the reported increase in local blood lactate concentration during BFR. Although the acidity created by the abundance of positively charged ions does not directly cause a reduction in muscle contractility, it does reduce the affinity of calcium ions to the sarcoplasmic reticulum calcium ion pumps and the actin–myosin contractile apparatus (Allen et al., Citation2008). The decrease in calcium ion affinity deteriorates contractile speed and power of the plantar-flexors (Allen et al., Citation2008; Cairns, Citation2006). A reduction in force at the ankle, denoted by the decrease in plantar-flexion angle, would require force redistribution to the knee and hip (Huang et al., Citation2015). Force redistribution is also indirectly supported by our observation of an immediate increase in anterior tilt of the torso during BFR sessions. The maintenance of step length and cadence throughout the exercise periods may limit stance time variability, allowing for lower variation in step-to-step elastic energy storage within the Achilles tendon (Brennan et al., Citation2017). The consistent loading of the Achilles tendon combined with the passive movement of the ankle joint by the treadmill belt may help offset reductions in range of motion and ankle joint velocity in order to prevent force loss. This may explain why the reduction of plantar-flexion angle at toe-off appeared later during the BFR sessions compared to anterior trunk flexion, as well as the maintenance of plantar-flexion angle and ankle joint velocity during BFR sessions.
An increase in knee flexion angle during stance and step width within the BFR sessions suggests participants implemented compensatory strategies that prioritised balance (Helbostad et al., Citation2007). When fatigued, lowering centre of mass and increasing base of support area can help to prioritise balance (Helbostad et al., Citation2007) and postural stability (Rosker et al., Citation2011). The BFR sessions induced increased step width immediately and this remained unchanged throughout. Therefore, the kinematic change was likely caused by the presence of the cuffs and not necessarily a compensatory strategy. However, the reported increase in knee flexion angle during stance is a mechanism that, when controlled, lowers centre of mass and increases postural stability (Rosker et al., Citation2011). Similar results have been observed during unrestricted fixed-paced walking with participants wearing specialised boots restricting ankle range of motion, mimicking fatigue (Huang et al., Citation2015). If uncontrolled, increased knee flexion during stance would indicate that muscles distal to the restriction point are experiencing fatigue (Husmann et al., Citation2018), reducing their ability to control eccentric loads during early stance. A reduction in eccentric muscular control of the quadriceps would diminish one’s ability to control the braking forces absorbed through the leading limb during the loading phase as the centre of mass passes over (Donelan et al., Citation2002). Therefore, the BFR-mediated increase in knee flexion angle during stance may be more indicative of muscular fatigue development rather than a compensatory strategy to increase balance and stability.
As expected, higher RPE and RPD values were reported during BFR sessions, regardless of exercise intensity. In line with these findings, we previously reported increases in RPE and RPD for participants walking at moderate and fast walking speeds with BFR compared to the unrestricted equivalent (Walden et al., Citation2022). Concerning walking technique, increases in muscle discomfort have been reported to significantly alter gait kinematics (Tsatalas et al., Citation2013). For example, Tsatalas et al. (Citation2013) conducted unrestricted walking trials pre and post a muscle damaging protocol (5 sets of 15 maximal eccentric actions of the knee flexors and extensors). From the observed adjustments in hip and knee kinematics, authors concluded that participants were attempting to alleviate muscular discomfort. Similarly, increases in anterior trunk flexion and reductions in plantar-flexion angle at toe-off were observed within the current study as perceived discomfort increased. The simultaneous alterations in both variables could suggest that participants were trying to identify the most comfortable walking strategy. Altogether, modifications in gait kinematics elicited by the application of BFR could be due to a combination of the physiological and metabolic stimulus and the exercise sensations experienced by the individual, without possible distinction between the three, at least under present circumstances.
Limitations and future perspectives
The calculation of arterial occlusion pressure in the supine position could be seen as a potential limitation of this study. However, measurements were consistent for all participants, and followed recurrent recommendations (Patterson et al., Citation2019) for the individualised percentage of maximum pressure used during the BFR-walking sessions. In addition, the use of static BFR cuffs may have contributed to the levels of discomfort reported. Future research should determine whether dynamic cuffs elicit similar levels of discomfort and subsequent changes in walking kinematics.
Conclusion
BFR-walking at moderate-to-fast speeds alters gait kinematics. Additionally, the faster walking speeds cause earlier measurable changes in walking technique. Adjustments in gait kinematics during the BFR sessions were accompanied by exaggerated perceptual responses, which were also positively influenced as walking speed increased. Fast BFR-walking also induced the largest response in post-exercise metabolite concentration, although sample site didn’t influence these responses.
Acknowledgments
The authors would like to thank the participants for volunteering their time to take part in the study. The authors would also like to thank Cassidy Newman for assisting with the data collection sessions and Dr Mitchell Forrest for assisting with the biomechanical data extraction. The Australian Government Research Training Program Scheme funds Thomas Walden’s PhD program.
Disclosure statement
No potential conflict of interest was reported by the author(s).
Additional information
Funding
References
- Abe, T., Kearns, C. F., & Sato, Y. (2006). Muscle size and strength are increased following walk training with restricted venous blood flow from the leg muscle, Kaatsu-walk training. Journal of Applied Physiology, 100(5), 1460–1466. https://doi.org/10.1152/japplphysiol.01267.2005
- Allen, D. G., Lamb, G. D., & Westerblad, H. (2008). Skeletal muscle fatigue: Cellular mechanisms. Physiological Reviews, 88(1), 287–332. https://doi.org/10.1152/physrev.00015.2007
- Bates, D., Mächler, M., Bolker, B., & Walker, S. (2014). Fitting linear mixed-effects models using lme4. arXiv preprint arXiv:1406.5823. https://doi.org/10.48550/arXiv.1406.5823
- Brennan, S. F., Cresswell, A. G., Farris, D. J., & Lichtwark, G. A. (2017). The effect of cadence on the muscle-tendon mechanics of the gastrocnemius muscle during walking. Scandinavian Journal of Medicine & Science in Sports, 27(3), 289–298. https://doi.org/10.1111/sms.12656
- Cairns, S. P. (2006). Lactic acid and exercise performance. Sports Medicine, 36(4), 279–291. https://doi.org/10.2165/00007256-200636040-00001
- Campbell, A. C., Alderson, J. A., Lloyd, D. G., & Elliott, B. C. (2009). Effects of different technical coordinate system definitions on the three dimensional representation of the glenohumeral joint centre. Medical & Biological Engineering & Computing, 47(5), 543. https://doi.org/10.1007/s11517-009-0467-7
- Chin, A., Lloyd, D., Alderson, J., Elliott, B., & Mills, P. (2010). A marker-based mean finite helical axis model to determine elbow rotation axes and kinematics in vivo. Journal of Applied Biomechanics, 26(3), 305–315. https://doi.org/10.1123/jab.26.3.305
- Dempsey, A. R. (2007). The effect of technique change on knee loads during sidestep cutting. Medicine & Science in Sports & Exercise, 39(10), 1765–1773. https://doi.org/10.1249/mss.0b013e31812f56d1
- Donelan, J. M., Kram, R., & Kuo, A. D. (2002). Simultaneous positive and negative external mechanical work in human walking. Journal of Biomechanics, 35(1), 117–124. https://doi.org/10.1016/S0021-9290(01)00169-5
- Helbostad, J. L., Leirfall, S., Moe-Nilssen, R., & Sletvold, O. (2007). Physical fatigue affects gait characteristics in older persons. The Journals of Gerontology Series A: Biological Sciences and Medical Sciences, 62(9), 1010–1015. https://doi.org/10.1093/gerona/62.9.1010
- Huang, T.-W. P., Shorter, K. A., Adamczyk, P. G., & Kuo, A. D. (2015). Mechanical and energetic consequences of reduced ankle plantar-flexion in human walking. Journal of Experimental Biology, 218(22), 3541–3550. https://doi.org/10.1242/jeb.113910
- Husmann, F., Mittlmeier, T., Bruhn, S., Zschorlich, V., & Behrens, M. (2018). Impact of blood flow restriction exercise on muscle fatigue development and recovery. Medicine & Science in Sports & Exercise, 50(3), 436–446. https://doi.org/10.1249/MSS.0000000000001475
- Loenneke, J. P., Thiebaud, R. S., Abe, T., & Bemben, M. G. (2014). Blood flow restriction pressure recommendations: The hormesis hypothesis. Medical Hypotheses, 82(5), 623–626. https://doi.org/10.1016/j.mehy.2014.02.023
- Miller, B. C., Tirko, A. W., Shipe, J. M., Sumeriski, O. R., & Moran, K. (2021). The systemic effects of blood flow restriction training: A systematic review. International Journal of Sports Physical Therapy, 16(4), 978. https://doi.org/10.26603/001c.25791
- Morin, J.-B., Samozino, P., & Peyrot, N. (2009). Running pattern changes depending on the level of subjects’ awareness of the measurements performed: A “sampling effect” in human locomotion experiments? Gait & Posture, 30(4), 507–510. https://doi.org/10.1016/j.gaitpost.2009.07.123
- Nimbarte, A., & Li, L. (2011). Effect of added weights on the characteristics of vertical ground reaction force during walk-to-run gait transition. Human Movement, 12(1), 81–87. https://doi.org/10.2478/v10038-010-0028-9
- Park, S., Kim, J. K., Choi, H. M., Kim, H. G., Beekley, M. D., & Nho, H. (2010). Increase in maximal oxygen uptake following 2-week walk training with blood flow occlusion in athletes. European Journal of Applied Physiology, 109(4), 591–600. https://doi.org/10.1007/s00421-010-1377-y
- Patterson, S. D., Hughes, L., Warmington, S., Burr, J., Scott, B. R., Owens, J., Abe, T., Nielsen, J. L., Libardi, C. A., Laurentino, G., & Neto, G. R. (2019). Blood flow restriction exercise: Considerations of methodology, application, and safety. Frontiers in Physiology, 10, 533. https://doi.org/10.3389/fphys.2019.00533
- Rosker, J., Markovic, G., & Sarabon, N. (2011). Effects of vertical center of mass redistribution on body sway parameters during quiet standing. Gait & Posture, 33(3), 452–456. https://doi.org/10.1016/j.gaitpost.2010.12.023
- Schwartz, M. H., & Rozumalski, A. (2005). A new method for estimating joint parameters from motion data. Journal of Biomechanics, 38(1), 107–116. doi:https://doi.org/10.1016/j.jbiomech.2004.03.009
- Scott, B. R., Loenneke, J. P., Slattery, K. M., & Dascombe, B. J. (2015). Exercise with blood flow restriction: An updated evidence-based approach for enhanced muscular development. Sports Medicine, 45(3), 313–325. https://doi.org/10.1007/s40279-014-0288-1
- Smith, N. D. W., Girard, O., Scott, B. R., & Peiffer, J. J. (2022). Blood flow restriction during self-paced aerobic intervals reduces mechanical and cardiovascular demands without modifying neuromuscular fatigue. European Journal of Sport Science, ahead-of-print(ahead-of-print), 1–11. https://doi.org/10.1080/17461391.2022.2062056
- Steele, J., Fisher, J., McKinnon, S., & McKinnon, P. (2016). Differentiation between perceived effort and discomfort during resistance training in older adults: Reliability of trainee ratings of effort and discomfort, and reliability and validity of trainer ratings of trainee effort. Journal of Trainology, 6(1), 1–8. https://doi.org/10.17338/trainology.6.1_1
- Thomas, H. J., Scott, B. R., & Peiffer, J. J. (2018). Acute physiological responses to low-intensity blood flow restriction cycling. Journal of Science and Medicine in Sport, 21(9), 969–974. https://doi.org/10.1016/j.jsams.2018.01.013
- Tsatalas, T., Giakas, G., Spyropoulos, G., Sideris, V., Kotzamanidis, C., & Koutedakis, Y. (2013). Walking kinematics and kinetics following eccentric exercise-induced muscle damage. Journal of Electromyography and Kinesiology, 23(5), 1229–1236. https://doi.org/10.1016/j.jelekin.2013.04.008
- Walden, T. P., Girard, O., Scott, B. R., Jonson, A. M., & Peiffer, J. J. (2022). Low- to moderate-intensity blood flow restricted walking is not an acute equivalent for unrestricted jogging in young active adults. European Journal of Sport Science, 1–10. https://doi.org/10.1080/17461391.2022.2107436
- Wickham, H. (2011). Wiley interdisciplinary reviews. Computational Statistics, 3, 180–185. https://doi.org/10.1002/wics.147
- Williams, N. (2017). The borg rating of perceived exertion (RPE) scale. Occupational Medicine, 67(5), 404–405. https://doi.org/10.1093/occmed/kqx063
- Wu, G., Siegler, S., Allard, P., Kirtley, C., Leardini, A., Rosenbaum, D., Whittle, M., D D’Lima, D., Cristofolini, L., Witte, H., & Schmid, O. (2002). ISB recommendation on definitions of joint coordinate system of various joints for the reporting of human joint motion—part I: Ankle, hip, and spine. Journal of Biomechanics, 35(4), 543–548. https://doi.org/10.1016/S0021-9290(01)00222-6
- Zeni, J. A., Richards, J. G., & Higginson, J. S. (2008). Two simple methods for determining gait events during treadmill and overground walking using kinematic data. Gait & Posture, 27(4), 710–714. https://doi.org/10.1016/j.gaitpost.2007.07.007