
ABSTRACT
The physical demands of soccer match-play have typically been assessed using a low-resolution whole match approach ignoring whether the ball is in or out of play (BIP/BOP) and during these periods which team has possession. This study investigated the effect of fundamental match structure variables (BIP/BOP, in/out of possession) on the physical demands, and especially intensity, of elite match-play. For 1083 matches from a major European league, whole match duration, and player physical tracking data, were divided into BIP/BOP, and in/out of possession periods throughout the match, using on-ball event data. These distinct phases were used to derive absolute (m) and rate (m·min−1) of distance covered in total and within six speed categories during BIP/BOP and in/out possession. The rate of distance covered, an index of physical intensity, was >2-fold greater during BIP vs BOP. Whole match total distance covered was confounded by BIP time and poorly associated with physical intensity during BIP (r = 0.36). Whole match rates of distance covered substantially underestimated those during BIP, particularly for higher running speeds (∼−62%). Ball possession markedly effected physical intensity, with the rates of distance covered running (+31%), at high-speed (+30%) and in total (+7%) greater out than in possession. Whole match physical metrics underestimated the physical intensity during BIP, and thus the rate(s) of distance covered during BIP are recommended for accurate measurement of physical intensity in elite soccer. The greater demands of being out of possession support a possession-based tactical approach to minimise fatigue and its negative consequences.
Highlights
This large-scale study utilising >1000 elite level competitive matches found profound differences in rate of distance covered between periods of BIP vs BOP, being 2-fold higher overall and 8- to 33-fold higher for the rates of distance covered within running, high-speed and sprinting speed categories.
Consequently, commonly used whole match physical metrics, that incorporate both BIP and BOP, such as distances covered but even rates of distance covered, were not valid indices of physical intensity (rate of distance covered) during BIP.
Thus a more valid and direct approach to quantifying physical intensity during elite soccer match-play as the rate of distance covered during BIP is proposed.
Utilising a unique within-match analysis the effect of possession (i.e. in vs out) revealed that teams covered ≥30% more running and high-speed distance while out than in possession during BIP.
Introduction
An evidence-based framework for soccer performance requires a detailed understanding of the structure of the game and how the physical demands may be influenced by match structure. Two critical match structure variables are whether the ball is in or out of play, and which team has possession. Whilst there has been some previous research on these match structure variables (Mernagh et al., Citation2021; Riboli et al., Citation2021; Wass et al., Citation2020), neither of these variables have been fully described during elite soccer match-play and how they influence the physical demands, and especially intensity, remains opaque.
For ≥40 years the “traditional” method of quantifying match physical demands has simply involved reporting the total distance covered (TDC), as well as the distances covered within specific speed categories during the whole match (Bradley & Ade, Citation2018; Di Salvo et al., Citation2009; Mohr et al., Citation2003). However, the duration of a soccer match (whole match time, WMtime) consists of alternating ball-in-play (BIP) and ball-out-of-play (BOP) periods, due to an average 108 stoppages per match (Siegle & Lames, Citation2012). Previous studies have reported an average BIP time of ∼54 min (Linke et al., Citation2018b; Lago-Peñas et al., Citation2012; Riboli et al., Citation2021), during which the physical demands may be relatively high due to continuous moderate to high-intensity movement. However this also means that ∼40% of WMtime, is comprised of BOP time when the physical demands may be relatively low, as some common stoppages (e.g. throw-ins) involve minor player repositioning, and others can be prolonged (i.e. >60 s for some free kicks) (Siegle & Lames, Citation2012) involving little movement. Considering the known variability in the number and duration of stoppages per match (Siegle & Lames, Citation2012) there may also be substantial variability in the amount of BOP and BIP time between matches, which may influence and potentially confound comparisons of whole match distances between matches (i.e. differences in player physical data could be due to match structure rather than purely a reflection of the physical demands when the ball is in play), however this has yet to be examined.
Importantly, quantifying match-play physical demands during WMtime, which includes this substantial proportion of low-intensity BOP time, likely underestimates the intensity of distance covered when the ball is in play. Therefore it may be logical to assess the intensity, or rate, of distance covered during BIP (also referred to as Effective Playing Time), an approach which is starting to be utilised in elite soccer research (Altmann et al., Citation2023; Castellano et al., Citation2011, Citation2022; Lago-Peñas et al., Citation2012; Linke et al., Citation2018b; Lorenzo-Martinez et al., Citation2021; Rey et al., Citation2020; Riboli et al., Citation2021). Considering the rate of TDC during BIP compared to WMtime, two small preliminary studies (of ≤8 team performances) found higher intensity/rates during BIP (Mernagh et al., Citation2021; Wass et al., Citation2020). However, a comprehensive analysis of the distances covered in absolute terms (m) and as a rate (m·minˉ¹) during WMtime, BIP and BOP has not been completed in elite soccer, either for specific speed categories that shows the intensity distribution of the distance covered, or in total. Such analysis may determine if expressing match-play physical demands during WMtime substantially underestimates the physical intensity during BIP, and therefore may lack validity compared to quantifying intensity as the rate(s) of distance covered during BIP.
The effect of ball possession on the physical metrics remains the subject of extensive debate. The relationship between ball possession and match distance covered has received scientific attention, but the effect on physical intensity less so (Castellano et al., Citation2022). Most research has found minimal association between overall distance covered and possession, albeit based on a small number of matches (≤55 matches) (Bradley et al., Citation2013b; da Mota et al., Citation2016; Morgans et al., Citation2014). This seems to be at odds with coaching dogma that being out of possession is more physically demanding as teams press their opponents; leading to greater fatigue with implications for injury risk, individual player mistakes and physical performance, whereas teams in possession are encouraged to “let the ball do the work”. In support of this coaching view a recent larger between-teams study reported a lower rate of distance covered for high vs low possession teams (Lorenzo-Martinez et al., Citation2021). Moreover, the equivocal findings in the research literature may be due to the between-teams approach that has typically been used, whereby match physical metrics of high- and low-possession teams have been compared (Bradley et al., Citation2013b; Lorenzo-Martinez et al., Citation2021; da Mota et al., Citation2016). This between-teams comparison may be confounded by several other between-team differences, such as team success, team technical ability and team fitness, all of which could also influence a team’s physical metrics and obscure any influence of possession. A within-match analysis comparing the same team’s physical metrics, and particularly intensity, whilst in and out of possession within the same match may provide a cleaner comparison and more effectively isolate the effect of possession on match physical demands. The greater sensitivity of a within-match comparison may therefore reveal if being out of possession is in fact more physically demanding and quantify any potential differences, however to our knowledge this approach has not been investigated.
The aim of this study was to document match structure variables, BIP/BOP and in/out of possession, in order to investigate their effect on the physical demands within the same match utilising a large sample of elite soccer matches. It was hypothesised that: firstly, the TDC during WMtime would be confounded by the variability in BIP time; secondly, due to the lower physical intensity of BOP vs BIP (i.e. rates of distance covered), summated whole match measures of intensity would substantially underestimate those during BIP; and lastly the rate of distance covered, especially within higher speed categories, would be greater whilst each team was out compared to in possession during the same match, due to increased physical intensity associated with attempts to regain possession.
Methods
Data sample
In total, 1083 matches were analysed from four seasons (2016/2017 n = 201, 2017/2018 n = 301, 2018/2019 n = 299 and 2019/2020 n = 282) of a major European league. Matches without available tracking data (n = 158) or with a player dismissal (n = 279) were excluded. On-ball event data were manually coded at 25 Hz for technical events (e.g. pass, shot, free-kick) and the player interacting with the ball and collected by Stats Perform LLC (Stats Perform, Chicago, US). The inter-operator reliability of the company’s ball event data collection system has been verified (Liu et al., Citation2013). Individual player tracking data were collected by a real-time optical tracking system (Stats Perform’s SportVU version 2.12.0, three-camera BASLER acA2500-14gc, 2560*1500 pixels HD system, 16 frames per second), which provides x- and y-coordinates for all players and the ball, which are subsequently used to calculate player distances and speeds. This system has previously been validated for tracking player movement compared to a gold-standard system (VICON) (root mean square measurement error: 56 ± 16 cm) (Linke et al., Citation2018a). Raw data were processed by Stats Perform and provided at a sampling frequency of 10 Hz. Ethical approval was granted by the University’s ethics review sub-committee.
Data preparation and variables
Whole match time was the sum of duration from initial kick-off to the final whistle and was divided into periods of BIP or BOP. Each BIP period was the duration from when the ball was actively put into play (e.g. kick-off or set-piece being taken) until the ball exited the pitch, or referee stopped play. In contrast, each BOP period began when either the ball left the pitch or referee stopped play, until play restarted. During all individual BIP and BOP periods each team was coded as either “in” or “out” of possession, excluding sequences ≤3s as they typically consisted of events where no team had clear possession (e.g. tackles and blocks) (Jones et al., Citation2004).
Stats Perform tracking data were used to derive the following physical metrics: distance covered standing (<0.16 m·s−1), walking (0.16–1.97 m·s−1), jogging (1.97–3.97 m·s−1), running (3.97–5.47 m·s−1), high-speed (5.47−7.0 m·s−1), sprinting (≥7.0 m·s−1) and TDC. Given their positional specificity, goalkeepers were excluded from the analysis and physical metrics were calculated per outfield player. All physical metrics were expressed in absolute terms (m) and as a rate (m·min−1) relative to WMtime, BIP, BOP and whether the team was in or out of possession during BIP and BOP. Match physical demands during WMtime, BIP and BOP time were calculated on a match basis, i.e. the physical metrics of all outfield players for each team, irrespective of individual player identities and substitutions, were summed and divided by 20 (number of players on the pitch). Alternatively, match physical demands relative to ball possession were calculated on an individual team basis, i.e. the physical demands of all players for each team, irrespective of individual player identities and substitutions, were summed and divided by 10 (number of players per team).
Statistical analysis
The Shapiro–Wilk test was used to assess data normality and revealed the majority of variables were non-normally distributed, therefore non-parametric tests were applied to provide a consistent approach. The Kruskal–Wallis and Dunn’s post hoc tests were used to compare: differences in match physical demands between WMtime, BIP and BOP time, as well as between in and out of possession. All data are presented as mean ± standard deviation. To determine between-match variability in match structure variables the coefficient of variation was calculated as the standard deviation divided by the mean and then multiplied by 100. Bivariate relationships were assessed with Spearman’s rho correlation analysis, with coefficients categorised as “weak” (r ≤ 0.40), “moderate” (r = 0.40–0.60), “strong” (r = 0.60–0.80) or “very strong” (r = 0.80–1.0) (Taylor, Citation1990). All statistical analyses were conducted using IBM SPSS Statistics for Mac OS X, version 27.0 (IBM Corp., Armonk, N.Y., USA) and statistical significance was set at p < 0.05.
Results
Ball-in-play, ball-out-play and ball possession
Whole match time was 95:36 ± 2:12 min:s (range: 90:0–108:42 min:s) which consisted of BIP time of 57:18 ± 4:12 min:s (range: 43:42–69:36 min:s, see Supplementary Material 1) or 59.9 ± 4.8% of WMtime, as well as BOP time of 38:30 ± 5:00 min:s (range: 22:42–59:24 min:s), or 40.1 ± 4.8% of WMtime. Thus, while the between-match variability in WMtime was relatively low (CV 2.3%) the variability in BIP time was >3 times greater (CV 7.3%) and the variability in BOP time >5 times greater (CV 13.0%).
During a match, there were 103.0 ± 12.1 (range 66–146, CV 11.7%) individual BIP periods of 34.0 ± 6.1 s (range 1–496 s, CV 17.6%), while there were 101.0 ± 12.2 (range 67–147, CV 11.8%) BOP periods of 22.6 ± 16.9 s (range 1–527 s, CV 87.1%). Per match each team had possession of the ball for a total of 28:39 ± 5:34 min:s (range: 13:55–50:24 min:s, CV 19.7%) with each team having 107 ± 11 (range: 76–143, CV 10.0%) individual possessions of 16.0 ± 13.9 s (range: 3–214 s, CV 13.9%).
Match physical metrics
Distance covered during whole match, ball-in-play and ball-out-play time
Players on average covered a total distance of 10,960 ± 371 m during WMtime, with 8292 ± 558 m (76% of whole match distance) covered during BIP time and 2669 ± 367 m (24% of whole match distance) covered during BOP time (; (a)). During BOP a high proportion of the distance covered was walking (67.2 ± 3.1%; (b)), and this was greater than during either BIP (23.6 ± 1.8%; p < 0.001) or WMtime (34.2 ± 2.0%; p < 0.001). Whereas during BIP the proportion of distance covered within all speed categories above walking was significantly greater than either BOP or WMtime i.e. jogging (BIP 45.4 ± 1.3%, BOP 25.5 ± 2.4%, WMtime 40.5 ± 1.4%; All p < 0.001), running (BIP 20.6 ± 1.3%, BOP 1.0 ± 0.1%, WMtime 16.8 ± 1.1%; All p < 0.001), high-speed (BIP 8.2 ± 0.8%, BOP 1.1 ± 0.3%, WMtime 6.4 ± 0.6%; All p < 0.001) and sprinting (BIP 2.3 ± 0.4%, BOP 0.2 ± 0.1%, WMtime 1.7 ± 0.3%; All p < 0.001).
Figure 1. (a) Absolute distance covered within different speed categories during whole match time, ball-in-play (BIP) and ball-out-play (BOP) time, (b) Distance covered within different speed categories as a percentage of total distance covered during whole match time, ball-in-play and ball-out-play time and (c) Within each speed category, the percentage of whole match distance covered during either ball-in-play or ball-out-play time. Data are the mean of 2166 team performances (expressed as the average per outfield player) during 1083 matches.
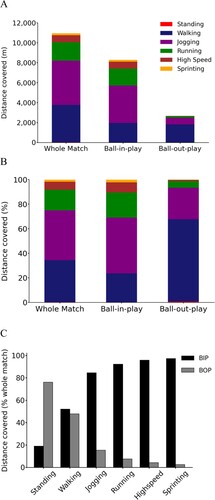
Table 1. Physical metrics during the whole match, ball-in-play and ball-out-play time, expressed in absolute terms (m) and rate of distance covered (m·min−1) for specific speed categories and the total of all speed categories.
The proportion of whole match distance covered during either BIP or BOP showed a highly skewed interaction with the speed category ((c)). The distance covered standing was mainly during BOP (80% during BOP) but walking distance was relatively similar for BIP and BOP (52% during BIP) and distances covered were increasingly skewed in favour of BIP as the speed category increased (jogging 82%; running 92%; high-speed 96%; sprinting 97%, all during BIP).
BIP time had a significant, weak positive correlation (r = 0.39, p < 0.001) with TDC during WMtime (see Supplementary Material 2A). This weak correlation was likely due to opposing relationships of BIP time with TDC during BIP time, a strong positive correlation (r = 0.80, p < 0.001; see Supplementary Material 2B), and TDC during BOP time, an equally strong negative correlation (r = −0.81, p < 0.001; see Supplementary Material 2C). Thus, the duration of BIP time explained over half of the variance in the distances covered during BIP (R2 = 0.64) and BOP (R2 = 0.65) time, as well as a small proportion of the variability in whole match distance (R2 = 0.15). The distances covered within the different speed categories during WMtime were also related to BIP time, but typically with weaker correlations than for TDC (distance covered: walking r = −0.19; running r = 0.23; high-speed r = 0.09; sprinting r = −0.08; All p < 0.01), the exception being jogging (r = 0.52, p < 0.001).
Rate of distance covered during the whole match, BIP and BOP time
During BOP there was a 52% lower rate of TDC than during BIP (69 ± 5 vs. 146 ± 7 m·min−1, p < 0.001; (a)). Also during BIP there were substantially higher rates of distance covered during jogging (3-fold), running (8-fold), high-speed (15-fold) and sprinting (33-fold), but a lower rate of distance covered walking (9–35%) compared to BOP which diluted whole match measurements.
Figure 2. (a) Rate of distance covered within different speed categories during whole match time, ball-in-play and ball-out-play time, (b) Rate of distance covered during the whole match within different speed categories, percentage difference compared to the rate of distance covered during ball-in-play (whole match rates > ball-in-play rates, positive values; whole match rates < ball-in-play rates, negative values). Date are the mean of 2166 team performances (expressed as the average per outfield player) during 1083 matches.
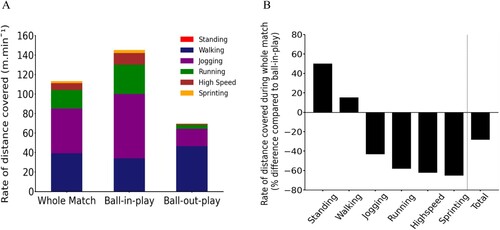
Consequently, commonly used whole match metrics that aggregate BIP and BOP had a rate of TDC that was 22% lower than during BIP (114 ± 4 vs. 146 ± 7 m·min−1, p < 0.001), and thus gave a substantial underestimate compared to BIP ((b)). There were even larger differences between WMtime and BIP for the rate of distance covered running (WMtime −58%; 19 ± 2 vs. 30 ± 3 m·min−1, p < 0.001), high-speed (−62%; 12 ± 2 vs. 7 ± 0.8 m·min−1, p < 0.001) and sprinting (−65%; 3.3 ± 0.7 vs. 2 ± 0.2 m·min−1, p < 0.001). Collectively, these results demonstrate that the intensity of distance covered in higher and lower speed categories are substantially under- and over-estimated, respectively, when measured during WMtime rather than BIP.
Do whole match distances reflect the intensity of match-play (i.e. rate of distance covered during ball-in-play)?
The TDC during WMtime was weakly associated with the rate of TDC during BIP time, with only ∼13%, shared variance (r = 0.36, p < 0.001; see Supplementary Material 3). For each speed category the distance covered during WMtime was also related to, and had shared variance with, the rate of distance covered during BIP, as speed increased: 26% shared variance walking (r = 0.51, p < 0.001), 19% jogging (r = 0.43, p < 0.001), 49% running (r = 0.70, p < 0.001), 61% high-speed (r = 0.78, p < 0.001) and 81% sprinting (r = 0.90, p < 0.001).
Ball possession status and rate of distance covered during both ball-in-play and ball-out-play
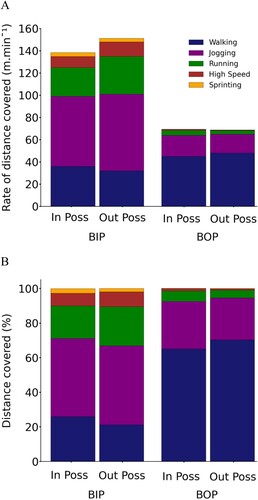
To avoid the confounding effect of the between-match variability in the duration of BIP and BOP time on the distances covered in and out of possession, only the rates of distance covered are presented for these variables (see Supplementary Material 4). During BIP possession had a small significant effect on the rate of TDC, being 7% higher when teams were out rather than in possession (151 ± 6 vs 140 ± 5 m·min−1, p < 0.001; (a)). Considering the speed categories, the greatest differences between the rates of distance covered in and out possession during BIP were for jogging (+10%; 63 ± 4 vs 69 ± 4 m·min−1, p < 0.001), high-speed (+30%; 10.5 ± 1.3 vs 13.6 ± 1.8 m·min−1, p < 0.001) and running (+31%; 26 ± 3 vs 34 ± 3 m·min−1, p < 0.001). In contrast, the rate of distance covered was higher in than out of possession during BIP for sprinting (+3%; 3.4 ± 0.7 vs 3.3 ± 0.7 m·min−1, p < 0.05) and walking (+11%; 36 ± 2 vs 32 ± 2 m·min−1, p < 0.001). Similarly, there was a greater proportion of distance covered walking (25.9 ± 2.1 vs 21.2 ± 1.9%, p < 0.001; (b)) and sprinting (2.6 ± 0.5 vs 2.0 ± 0.4%, p < 0.001) in compared to out of possession, but lower proportion of running (18.78 ± 1.3 vs 22.52 ± 1.6%, p < 0.001) and high-speed (7.34 ± 0.8 vs 8.61 ± 1.0%, p < 0.001) when in possession. During BOP, possession had minor effects on the rate and proportion of distances covered.
Figure 3. (a) Rate of distance covered within different speed categories when in and out of possession during both ball-in-play (BIP) and ball-out-play (BOP) time, and (b) Distance covered within different speed categories as a percentage of total distance covered when in and out of possession during both ball-in-play and ball-out-play time. Standing values were consistently negligible and thus were excluded from the rate of TDC. Data are the mean of 2166 team performances (calculated as the average per outfield player) during 1083 matches. Abbreviations: In Poss = in possession; Out Poss = out of possession.
Discussion
The aim of this study was to document critical match structure variables, specifically BIP/BOP time and ball possession, in order to investigate their effect on match physical demands in elite professional soccer using a comprehensive analysis of >1000 matches. Firstly, the rate of distance covered was >2-fold greater during BIP vs BOP. Consequently, as hypothesised the physical intensity during WMtime substantially underestimated the rate of distance covered during BIP, particularly at higher speeds (running, high-speed and sprinting −58 to −65%). Secondly, the traditional measure of TDC during WMtime was: (i) confounded by the match-to-match variability in BIP time in accordance with our first hypothesis, although this was a relatively modest effect with BIP time explaining ∼15% of the between-match variability in TDC; (ii) weakly correlated, and thus a poor reflection, of the rate of distance covered during BIP. These findings illustrate that traditional, but low-resolution whole match physical metrics (e.g. TDC), are not a valid index of physical intensity during BIP and therefore direct measurement of rate(s) of distance covered during BIP appear to provide a more valid index of physical intensity during match-play. Lastly, the rate of TDC was greater out than in possession (+7%) during BIP, with substantially higher rates of running (+31%) and high-speed (+30%), but less walking (−11%) when out of possession. This confirms the view of some coaches that being out of possession is more physically demanding than being in possession, with implications for team tactics, coaching and managing players (workload, injury risk, etc.).
Match structure
This study found average BIP and BOP times of ∼57 and 39 min, respectively, constituting 60% and 40% of the whole match. Previous studies reported a similar BIP time of ∼54 min or ∼60% of WMtime in elite soccer matches (Lago-Peñas et al., Citation2012; Linke et al., Citation2018b; Riboli et al., Citation2021). We also found BIP time demonstrated moderate between match variability (CV 7.3%, range: 44–70 min), likely due to variability in the number (CV 12%) and especially the duration (CV 87%) of stoppages between matches. This contrasts with previous research that suggested BIP time remains relatively stable across a limited number of matches (Castellano et al., Citation2011).
Possession analysis revealed that each team had 107 individual possessions lasting on average ∼16s, equivalent to ∼29 min of ball possession per match. A previous study utilising a much smaller sample reported 148 individual possessions (per team; Jones et al., Citation2004) ∼38% more than this study, perhaps in part because they observed a longer BIP time of 68 min in contrast to the current and recent investigations (Lago-Peñas et al., Citation2012; Linke et al., Citation2018b; Riboli et al., Citation2021; Wass et al., Citation2020).
Match physical metrics during ball-in-play, ball-out-play and whole match
The variability in BIP time between matches had a confounding influence upon the TDC during the whole match, as well as within each speed category, although these effects were relatively modest, e.g. BIP time explained ∼15% of the variability in TDC during whole match. Thus, an original finding of this study was that match structure affected these traditional physical metrics, indicating that they are not purely a reflection of the physical effort and/or fitness of a player, but in part due to the underlying structure of any given match.
Of the 10,960 m covered on average per player during a whole match, 76% (8292 m) was during BIP time (59% of WMtime), whilst 24% (2669 m) was during BOP time (41% of WMtime). Thus, the rate of distance covered during BIP time was >2 times greater compared to BOP. Whilst some previous research has documented the physical metrics during BIP (also known as effective playing time) (Riboli et al., Citation2021; Altmann et al., Citation2023; Castellano et al., Citation2011, Citation2022; Lago-Peñas et al., Citation2012; Linke et al., Citation2018b; Lorenzo-Martinez et al., Citation2021; Mernagh et al., Citation2021; Rey et al., Citation2020), only two small previous studies compared BIP and BOP, also finding a discrepancy with the rate of TDC 4–10 times higher during BIP than BOP (Mernagh et al., Citation2021; Wass et al., Citation2020). Therefore, the rate of distance covered appears to be substantially greater during BIP than BOP and ∼2-fold higher during elite-level competition. These differences inevitably meant that the rate of TDC during WMtime was substantially lower than during BIP (−22%, 114 vs 146 m·min−1) i.e. lower physical intensity during BOP dilutes whole match measures of physical intensity. This lower rate of distance covered during WMtime vs BIP was highly evident at moderate to high speeds (jogging −43%; running −58%; high-speed −62%; sprinting −65%). Furthermore, the TDC during whole match only explained 13% of the variability in the rate of TDC during BIP, i.e. TDC during whole match doesn’t accurately reflect physical intensity during BIP. Collectively, these findings suggest that whilst traditional whole match physical metrics may reflect the overall volume of physical work completed, they don’t accurately reflect the physical intensity during BIP, as the rate of distance covered during BIP was weakly related to whole match distances and severely underestimated by whole match rates. To this end, when coaches and practitioners are quantifying team and player physical metrics during competitive match-play (and training sessions), for a more valid measurement of physical intensity, rate(s) of distance covered during BIP is recommended to provide a more specific and direct measure when the ball is actually in play.
Across the speed categories, BIP and BOP also showed a marked difference in the distribution of distance covered. Specifically, the TDC during BOP was predominantly walking (67% vs. 24% during BIP), whereas during BIP a greater proportion of the TDC was at high-intensity e.g. running, high-speed and sprinting (31% vs. 7% during BOP). Consequently, the proportion of distance covered during BIP/BOP was dependent upon the speed category, ranging from 80% of standing distance covered during BOP to 97% of sprinting distance covered during BIP. Accordingly, during BIP there were substantially greater rates of distance covered at higher speeds (running 8-fold; high-speed 15-fold; sprinting 33-fold) compared to BOP. The small amount of higher speed distance covered during BOP has previously been observed (Bradley et al., Citation2013a) and is likely attributed to specific technical-tactical actions (e.g. sprinting before a set-piece is taken) (Faude et al., Citation2012) but are clearly minor compared to the extensive distances covered at higher speeds during BIP.
Collectively, these findings have implications for team and player physical preparation, for example, during training sessions the physical demands are typically analysed on a drill-by-drill basis and exclude any inactive training time (e.g. coach instructions and drinks breaks; Gabbett, Citation2015) however the physical intensity of these training drills are typically compared to whole match physical metrics (which includes BOP time) (Whitehead et al., Citation2018). As the current study has demonstrated, whole match physical metrics underestimate match physical intensity and may not be a valid benchmark of BIP-specific training intensities. Alternatively, quantifying match physical demands as a rate during BIP provides an accurate index of match-play physical intensity and will allow for appropriate training load prescription, e.g. design of specific training drills that accurately replicate match physical intensity, ensuring that players are conditioned to cope with the actual match physical demands. Furthermore, and from a player load monitoring and fatigue perspective, it is critical that the physical information used accurately reflects the intensity of work completed, and quantifying match physical intensity during BIP may enable practitioners to better prescribe optimal recovery/rest according to the intensity of the match.
In addition, previous research has predominantly suggested that whole match physical metrics, typically distances, have limited/minimal influence on overall team performance at the elite level (Carling, Citation2013; Oliva-Lozano et al., Citation2023), particularly in comparison to the importance of a players technical ability. However, calculating the physical metrics as a rate during BIP which accurately captures the physical intensity of match-play, may be more strongly associated with team performance than the traditional low-resolution, aggregate whole match distances and warrants further investigation.
The influence of ball possession on match physical metrics
Overall, the rate of TDC was modestly higher (+7.8%) while teams were out vs in possession during BIP. However, the rates of distance covered running (+31%) and at high-speed (+30%) were substantially greater, whilst the rate of distance covered walking (−11%) and sprinting (−3%) were lower out than in possession. Previous studies using a between-teams comparison have reported equivocal findings for the effect of ball possession on match physical demands (Bradley et al., Citation2013b; Lorenzo-Martinez et al., Citation2021; da Mota et al., Citation2016), however the within-match analysis employed in this study provided a direct comparison of physical metrics in vs out of possession from the same team playing in the same match before averaging across all the team performances, therefore removing the effects of other confounding variables. Nonetheless the findings of this study are broadly in agreement with the largest between-teams study that reported high-possession teams cover less distance than low-possession teams (Lorenzo-Martinez et al., Citation2021). In the current within-team study, teams covered considerably greater running and high-speed distances (+30 to 31%) whilst out compared to in possession. These findings suggest that time in possession may reduce the physical intensity of overall match play and especially the amount of high-speed running. Given the greater physical demands of being out of possession now shown by within (current study) and between team’s approaches (Lorenzo-Martinez et al., Citation2021), the physical conditioning of players should be carefully tailored to sufficiently prepare players for the elevated physical demands of out of possession periods. Furthermore, for typically low-possession teams a greater emphasis on out-of-possession drills which prioritise physical fitness (e.g. closing down, high pressing) could be beneficial. The current findings also support the tactical approach of high-intensity pressing, with the requisite fitness that demands, in order to regain possession quickly and minimise the overall physical demands of match play by maximising possession. In fact greater possession and the associated lower physical intensity may lead to less fatigue and facilitate teams having a greater physical intensity when out of possession i.e. the amount of possession and physical intensity when out of possession may be mutually reinforcing. In summary, these findings reinforce the benefits of maintaining possession or developing an effective strategy against high-possession opponents, in order to minimise the physical demands and avoid fatiguing at a faster rate than the opposition, with multiple negative sequalae including increased injury risk, likelihood of mistakes and reduced physical performance. Future research may consider examining how the physical intensity of match-play (i.e. rate of distance covered during BIP) while in/out of possession changes according to a team’s tactical approach (e.g. possession-based, counterattacking, direct-play), in order to optimally prepare players for expected workloads and help avoid fatigue or injury.
There are some limitations of this study. First, the accuracy of optical tracking systems to capture player displacement and thus distances and rates can vary, depending on the number of cameras used, their positions and camera specifications/settings. Second, whilst to date there is no evidence for differences in match structure variables or physical metrics between competitive leagues, the findings may have some specificity to the league analysed. Third, whilst any matches involving red cards were excluded, in a few instances a team may still have been temporarily or permanently reduced to fewer than 10 outfield players (i.e. player injuries when no more substitutions were available). However, these particular instances are rare, and it is unlikely that they would have any significant effect on the results and key findings.
Whilst beyond the scope of this study it is well known that soccer match-play is highly contextual and several factors such as match period, match location, match scoreline, opposition quality and playing position could effect the match structure variables (BIP/BOP and ball possession) and physical metrics considered in the current study. For example, the decline in physical metrics throughout a match that exists for distances and rates of distance covered (Bradley & Noakes, Citation2013; Mohr et al., Citation2003) calculated relative to whole match time (i.e. including BIP and BOP periods) has been found to be partially or fully due to the increasing proportion of BOP time (i.e. increased interruptions/stoppages towards the end of matches) with a smaller decline (Linke et al., Citation2018b), or no change (Rey et al., Citation2020), in the rate of distance covered when calculated during BIP time. In other words, the reduction in physical intensity appears to have been overemphasised due to the changing match structure, which further reinforces the notion that the rate of distance covered during BIP is a more valid measure of physical intensity. Furthermore, match location (home/away) has been shown to have an effect on average ball possession (Bradley et al., Citation2010), absolute distances covered (Castellano et al., Citation2011) and rates of distance covered at higher speeds (>21 km/h) (Castellano et al., Citation2022) during BIP. Playing position is known to have a marked effect on match physical metrics (Lago-Peñas & Lago-Ballesteros, Citation2011), whilst all players within a match are clearly subject to the same match structure, it is possible that the effects of BIP/BOP or in/out of possession could be more pronounced for some positions (e.g. fullbacks) than others. Finally, quality of opposition (Lago-Peñas & Lago-Ballesteros, Citation2011; Ponce-Bordón et al., Citation2022) and match result (win/draw/lose) (Castellano et al., Citation2022) also appear to influence match physical metrics. In summary, to date some evidence suggests that contextual variables influence match structure or physical metrics, with these effects typically studied in isolation, whereas the effect of contextual variables on the interaction of match structure and physical metrics remains largely unknown. Therefore future research may determine if the interaction of match structure and physical metrics, as described in the current investigation, is also influenced by contextual factors.
In conclusion, this is the first large-scale study to quantify the effect of ball in/out of play, as well as ball possession utilising a novel within-match approach, on the physical metrics across all speed categories during elite soccer match-play. The rate of distance covered was >2-fold greater during BIP vs BOP, and thus “traditional” low-resolution methods of quantifying the physical metrics during the whole match substantially underestimated or poorly reflected match physical intensity. Based on these findings it is recommended that analysts and coaches adopt a more valid and direct approach to quantifying physical intensity as the rate of distance covered during BIP. Furthermore, this study used a novel and cleaner within-match analysis, which revealed that teams covered ≥30% more running and high-speed distance while out than in possession during BIP. This finding has implications for match preparation (i.e. a team’s tactical approach) in order to minimise fatigue and its negative consequences (risk of injury and individual player mistakes, reduced physical performance).
Supplemental Material
Download PDF (180.4 KB)Acknowledgements
The authors would like to thank Stats Perform for providing both the on-ball event and optical tracking data that was analysed in this study.
Disclosure statement
No potential conflict of interest was reported by the author(s).
Additional information
Funding
References
- Altmann, S., Forcher, L., Woll, A., & Härtel, S. (2023). Effective playing time affects physical match performance in soccer: An analysis according to playing position. Biology of Sport, 40(4), 967–973. https://doi.org/10.5114/2023.123320
- Bradley, P. S., & Ade, J. D. (2018). Are current physical match performance metrics in elite soccer fit for purpose or is the adoption of an integrated approach needed? International Journal of Sports Physiology and Performance, 13(5), 656–664. https://doi.org/10.1123/ijspp.2017-0433
- Bradley, P. S., Carling, C., Diaz, A. G., Hood, P., Barnes, C., Ade, J., Boddy, M., Krustrup, P., & Mohr, M. (2013a). Match performance and physical capacity of players in the top three competitive standards of English professional soccer. Human Movement Science, 32(4), 808–821. https://doi.org/10.1016/j.humov.2013.06.002
- Bradley, P. S., Di Mascio, M., Peart, D., Olsen, P., & Sheldon, B. (2010). High-intensity activity profiles of elite soccer players at different performance levels. Journal of Strength and Conditioning Research, 24(9), 2343–2351. https://doi.org/10.1519/JSC.0b013e3181aeb1b3
- Bradley, P. S., Lago-Peñas, C., Rey, E., & Gomez Diaz, A. (2013b). The effect of high and low percentage ball possession on physical and technical profiles in English FA Premier League soccer matches. Journal of Sports Sciences, 31(12), 1261–1270. https://doi.org/10.1080/02640414.2013.786185
- Bradley, P. S., & Noakes, T. D. (2013). Match running performance fluctuations in elite soccer: Indicative of fatigue, pacing or situational influences? Journal of Sports Sciences, 31(15), 1627–1638. http://doi.org/10.1080/02640414.2013.796062
- Carling, C. (2013). Interpreting physical performance in professional soccer match-play: Should we be more pragmatic in our approach? Sports Medicine, 43(8), 655–663. https://doi.org/10.1007/s40279-013-0055-8
- Castellano, J., Blanco-Villaseñor, A., & Alvarez, D. (2011). Contextual variables and time-motion analysis in soccer. International Journal of Sports Medicine, 32(06), 415–421. https://doi.org/10.1055/s-0031-1271771
- Castellano, J., Errekagorri, I., Los Arcos A., Casamichana, D., Martín-Garcia, A., Clemente, F., López-Del Campo, R., Resta, R., & Echeazarra, I. (2022). Tell me how and where you play football and I’ll tell you how much you have to run. Biology of Sport, 39(3), 607–614. https://doi.org/10.5114/biolsport.2022.106155
- da Mota, G. R., Thiengo, C. R., Gimenes, S. V., & Bradley, P. S. (2016). The effects of ball possession status on physical and technical indicators during the 2014 FIFA World Cup Finals. Journal of Sports Sciences, 34(6), 493–500. https://doi.org/10.1080/02640414.2015.1114660
- Di Salvo, V., Gregson, W., Atkinson, G., Tordoff, P., & Drust, B. (2009). Analysis of high intensity activity in Premier League soccer. International Journal of Sports Medicine, 30(03|3), 205–212. https://doi.org/10.1055/s-0028-1105950
- Faude, O., Koch, T., & Meyer, T. (2012). Straight sprinting is the most frequent action in goal situations in professional football. Journal of Sports Sciences, 30(7), 625–631. https://doi.org/10.1080/02640414.2012.665940
- Gabbett, T. J. (2015). Influence of ball-in-play time on the activity profiles of rugby league match-play. Journal of Strength and Conditioning Research, 29(3), 716–721. https://doi.org/10.1519/JSC.0000000000000446
- Jones, P. D., James, N., & Mellalieu, S. D. (2004). Possession as a performance indicator in soccer. International Journal of Performance Analysis in Sport, 4(1), 98–102. https://doi.org/10.1080/24748668.2004.11868295
- Lago-Peñas, C., & Lago-Ballesteros, J. (2011). Game location and team quality effects on performance profiles in professional soccer. Journal of Sports Science & Medicine, 10(3), 465. https://www.ncbi.nih.gov/pmc/articles/PMC3737821/
- Lago-Peñas, C., Rey, E., & Lago-Ballesteros, J. (2012). The influence of effective playing time on physical demands of elite soccer players. The Open Sports Sciences Journal, 5(1), 188–192. https://doi.org/10.2174/1875399X01205010188
- Linke, D., Link, D., & Lames, M. (2018a). Validation of electronic performance and tracking systems EPTS under field conditions. Plos One, 13(7), e0199519. https://doi.org/10.1371/journal.pone.0199519
- Linke, D., Link, D., Weber, H., & Lames, M. (2018b). Decline in match running performance in football is affected by an increase in game interruptions. Journal of Sports Science & Medicine, 17, 662. https://www.ncbi.nlm.nih.gov/pmc/articles/PMC6243615/
- Liu, H., Hopkins, W., Gómez, A. M., & Molinuevo, S. J. (2013). Inter-operator reliability of live football match statistics from OPTA Sportsdata. International Journal of Performance Analysis in Sport, 13(3), 803–821. https://doi.org/10.1080/24748668.2013.11868690
- Lorenzo-Martinez, M., Kalén, A., Rey, E., López-Del Campo, R., Resta, R., & Lago-Peñas, C. (2021). Do elite soccer players cover less distance when their team spent more time in possession of the ball? Science and Medicine in Football, 5(4), 310–316. https://doi.org/10.1080/24733938.2020.1853211
- Mernagh, D., Weldon, A., Wass, J., Phillips, J., Parmar, N., Waldron, M., & Turner, A. (2021). A comparison of match demands using ball-in-play versus whole match data in professional soccer players of the English Championship. Sports, 9(6), 76. https://doi.org/10.3390/sports9060076
- Mohr, M., Krustrup, P., & Bangsbo, J. (2003). Match performance of high-standard soccer players with special reference to development of fatigue. Journal of Sports Sciences, 21(7), 519–528. https://doi.org/10.1080/0264041031000071182
- Morgans, R., Adams, D., Mullen, R., & Williams, M. D. (2014). Changes in physical performance variables in an English Championship League team across the competitive season: The effect of possession. International Journal of Performance Analysis in Sport, 14(2), 493–503. https://doi.org/10.1080/24748668.2014.11868738
- Oliva-Lozano, J. M., Martínez-Puertas, H., Fortes, V., Campo, L.-D., Resta, R., Muyor, R., & M, J. (2023). Is there any relationship between match running, technical-tactical performance, and team success in professional soccer? A longitudinal study in the first and second divisions of LaLiga. Biology of Sport, 40(2), https://doi.org/10.5114/biolsport.2023.118021
- Ponce-Bordón, J. C., Nobari, H., Lobo-Triviño, D., García-Calvo, T., Vicente-Giménez, J., López del Campo, R., Resta, R., & Fernández-Navarro, J. (2022). Match movement profiles differences in Spanish soccer competitive leagues according to opposition’s team ranking: A comparison study. Applied Sciences, 12(24), 12635. https://doi.org/10.3390/app122412635
- Rey, E., Kalén, A., Lorenzo-Martínez, M., López-Del Campo, R., Nevado-Garrosa, F., & Lago-Peñas, C. (2020). Elite soccer players do not cover less distance in the second half of the matches when game interruptions are considered. Journal of Strength and Conditioning Research. https://doi.org/10.1519/JSC.0000000000003935
- Riboli, A., Semeria, M., Coratella, G., & Esposito, F. (2021). Effect of formation, ball in play and ball possession on peak demands in elite soccer. Biology of Sport, 38(2), 195. https://doi.org/10.5114/biolsport.2020.98450
- Siegle, M., & Lames, M. (2012). Game interruptions in elite soccer. Journal of Sports Sciences, 30(7), 619–624. https://doi.org/10.1080/02640414.2012.667877
- Taylor, R. (1990). Interpretation of the correlation coefficient: A basic review. Journal of Diagnostic Medical Sonography, 6(1), 35–39. https://doi.org/10.1177/875647939000600106
- Wass, J., Mernagh, D., Pollard, B., Stewart, P., Fox, W., Parmar, N., Jones, B., Kilduff, L., & Turner, A. N. (2020). A comparison of match demands using ball-in-play vs. whole match data in elite male youth soccer players. Science and Medicine in Football, 4(2), 142–147. https://doi.org/10.1080/24733938.2019.1682183
- Whitehead, S., Till, K., Weaving, D., & Jones, B. (2018). The use of microtechnology to quantify the peak match demands of the football codes: A systematic review. Sports Medicine, 48(11), 2549–2575. https://doi.org/10.1007/s40279-018-0965-6