
ABSTRACT
Charitable giving represents a unique cooperative characteristic of humans. In today’s environment with social media, our charitable decisions seem to be influenced by social information such as a project’s popularity. Here we report three experiments that examined people’s reactions to social information about a charitable endeavor and their psychophysiological underpinnings. Participants were first solicited to make donations to either the Africa or Syria project of UNICEF. Then participants were provided an opportunity to learn social information (i.e., how much each project had raised from previous participants) and change their decision if desired. Contrary to expectation, participants who learned that their initial preferences were consistent with the majority of previous participants’ choices exhibited a sizable tendency to switch to the less popular project in their final choices. This anti-conformity pattern was robust across the three experiments. Eye-tracking data (gaze bias and pupil dilation) indicated that these “Changers” were more physiologically aroused and formed more differential valuations between the two charity projects, compared to “Keepers” who retained their initial preferences after viewing the social information. These results suggest that social information about relative popularity may evoke empathic concern for the worse-off target, in line with the human tendency to avoid unequal distributions.
Introduction
Charitable giving is a widespread and unique characteristic of human cooperation, by which we help not only familiar but also unknown or unrelated others who are unlikely to reciprocate (Bowles & Gintis, Citation2011; Trivers & Coultas, Citation1971). According to the World Giving Index (Charities Aid Foundation, Citation2018), one fifth of the population in around 100 developing and developed countries donated some money to charity projects in 2017. Despite the ubiquity and importance of these activities, our understanding about the psychophysiological processes underlying charitable giving remains insufficient.
In our daily lives, people often encounter calls for charitable giving at religious centers, retail establishments, and more recently on the Internet. For example, on “crowdfunding” websites (e.g., StartSomeGood, Razoo), potential donors can access information about numerous ongoing charity projects. Without specialized knowledge and skills, as well as sufficient time and motivation, it is too demanding for an individual to evaluate all of the projects in detail and choose the “best” one in terms of merit, need, and other key dimensions. In such cases, a typical heuristic is to use social information about which projects others have supported (Festinger, Citation1954).
However, most previous research on the use of social information in charitable giving has focused on situations in which a single target is highlighted, and potential donors are informed about others’ support for the project (Andreoni, Citation1998; Dellavigna, List, & Malmendier, Citation2012; Shang & Croson, Citation2009; Soetevent, Citation2005; Vesterlund, Citation2003). Although important in their own right, findings from these previous studies may not be applicable to the rapidly-spreading phenomenon of charitable giving on the Internet, where donation calls for many projects are listed simultaneously. Here we address this situation more directly, exploring how social information (i.e., a project’s relative popularity among preceding donors as often seen on crowdfunding sites) affects real charity decisions.
How might people use social information when they choose among several viable options? We will discuss two potential psychological forces in charitable giving that may have opposite impacts on people’s choices.
Social psychological research has repeatedly shown that the preceding majority exerts strong social influence on subsequent choices (Asch, Citation1951; Sherif & Murphy, Citation1936). People often consider the majority view to reflect some physical and/or social reality (“informational influence”: Deutsch & Gerard, Citation1955). They also conform to the majority position to avoid possible embarrassment or social sanction for holding a divergent position (“normative influence”; see Cialdini & Goldstein, Citation2004; Kameda, Wisdom, Toyokawa, & Inukai, Citation2012 for review). According to these observations, people may simply follow the majority view, supporting the already-popular project in charitable donations as well (see Salganik, Dodds, & Watts, Citation2006 for examples in consumer choices).
However, in charitable giving, it is also conceivable that people may decide to intentionally deviate from the majority choice to help the less-popular “underdog” among the projects. Previous research showed that people have a robust tendency to react negatively to inequitable distribution between themselves and others (e.g., Fehr & Schmidt, Citation1999). It is also known that such an inequity aversion extends to a third-party situation, where people choose distributions strictly for others unrelated to themselves (Hsu, Anen, & Quartz, Citation2008; Kameda et al., Citation2016; Zhong, Chark, Hsu, & Chew, Citation2016). Given that people are often concerned with the most unfortunate other in social distribution (Kameda et al., Citation2016), empathy for another’s misfortune might drive people to support the less popular project in charitable giving.
In reality, majority influence and inequity aversion may not be mutually exclusive when an individual makes a charitable decision. When learning social information, people may experience psychological conflicts about whether to follow the implicit norm endorsed by the majority or to deviate from the majority in order to reduce the inequity against the underdog. Thus, the question of how people use social information for choosing charity recipients and how they may resolve the potential conflicts is empirically open. Here, we report a series of experiments using behavioral and eye-tracking measures to address this question. In Experiment 1, we first asked participants to make donation decisions individually and then provided social information about the choices of preceding donors. Upon the receipt of this social information, participants could keep or change their initial choice for their final decision. Donations were later sent to the recipients of participants’ final decisions through UNICEF. Experiment 2 was designed to replicate the key behavioral finding in Experiment 1 using a larger sample with sufficient statistical power. Experiment 3 examined psychophysiological processes associated with the behavioral pattern using an eye tracker. In particular, we measured eye movement (Mullet & Stewart, Citation2016; Orquin & Mueller Loose, Citation2013) and pupil dilation (Bradley, Miccoli, Erscrig & Lang, Citation2008; Murphy, O’Connell, O’Sullivan, Robertson, & Balsters, Citation2014) to shed light on the psychological conflicts that participants might experience after learning the social information.
Experiment 1
Method
Participants
One hundred and thirty-two (77 male, 55 female; Mage ± SDage = 20.9 ± 0.6) students at the University of Tokyo and Taisho University in Japan participated in the study. The study was approved by the ethical committee of the Department of Social Psychology of the University of Tokyo. All participants gave written informed consent.
Procedure
Students who had just completed other psychological experiments were approached by an experimenter. The experimenter explained that his laboratory was cooperating with charity projects of the Japan Committee for UNICEF, and solicited them to take part in a short survey as volunteers without compensation. If the students agreed, they were placed into private cubicles with a computer terminal. All the instructions thereafter were given on the monitor.
Participants were first presented with images and descriptions of the ongoing UNICEF charity projects for Africa and Syria (see Supplementary Figure 1) on the computer screen. They were asked to subjectively rate each project’s deservingness of support on a 7-point scale ()). Participants were then informed that the experimenter’s laboratory would match any donation for the UNICEF projects on a one to one basis, and were asked if they would be willing to make a donation to one of the projects. It was emphasized that the decision to donate was completely voluntary and that they could leave the laboratory at this point.
Figure 1. Task flow in Experiment 1. (a) Participants were first asked to rate each project’s deservingness of support on a 7-point scale. (b) Participants who decided to donate were individually asked to choose either the Africa project or the Syria project for donation and indicate how much money they were willing to contribute (from 10 yen to 1000 yen in 10 yen increments). (c) After the individual decision, participants were provided with social information showing the amount of money donated to each charity project by preceding anonymous participants. In the Majority condition, the display indicated that the charity project chosen by the participant had raised more money than the other project (left). In the Minority condition, the display indicated that the project chosen by the participant had raised less money than the other project (right). The accumulated amounts were fixed across the two conditions and for all participants. A participant’s initial decision was displayed at the bottom of the screen (this example illustrates a case in which the participant initially decided to donate 100 yen to the Africa project). (d) Then participants were asked to confirm their decisions, deciding whether to keep or change their initial decisions about which project to support and how much to donate.
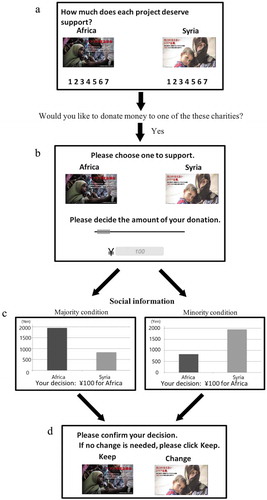
Participants who decided to stay were asked to choose either the Africa project or the Syria project for donation and then indicate how much money they were willing to contribute, from 10 yen to 1000 yen in 10 yen increments ()).
After the individual decision, participants were provided with social information showing the sum of money donated to each charity project by preceding anonymous participants. Here we had two conditions for social information. In the Majority condition, the charity project that the participant chose had raised more money than the other project () left). In the Minority condition, the project chosen by the participant had raised less money than the other project () right). We also had a Control condition in which no social information was available to participants. Because we did not want to use deception, we arranged social information to reflect participants’ actual donations in particular sessions. Specifically, we ran the Control condition before the Majority and Minority conditions, and then selected several sessions so that the sum of the donations for Africa and Syria matched the patterns as displayed in ). Accordingly, the figures participants actually saw during the experiment had a caption such as “the sum of donations from participants in sessions on February 12th – 14th.”
Participants were then asked to confirm their decisions ()). Here participants were able to either maintain or change their initial decisions about which project to support and how much to donate. Participants then answered a short questionnaire, put the donated money in a box, were thanked and left the laboratory. After the entire experiment was completed, we made donations to the respective UNICEF projects according to the above procedure (18,590 yen [= 180 US dollars] for Africa and 19,160 yen [= 190 US dollars] for Syria).
Results
Distribution of donations
More than 90% of the students approached by the experimenter agreed to participate in the survey. Among 132 participants in the survey, 71 participants (54%) agreed to donate either to the Africa or to the Syria project; the remaining 61 (46%) participants left the laboratory after they finished rating the deservingness of each project.
) displays distribution of donations. The average initial donation was 130 yen (participants who did not agree to donate and left the laboratory were included as 0 yen contributors). The right skewness of distribution of the donated amounts parallels the results of previous studies on charitable giving (e.g., Hare, Camerer, Knoepfle, O’Doherty, & Rangel, Citation2010).
Figure 2. (a) Frequency of donations in Experiment 1. Participants who did not agree to donate were plotted as 0 contributors. (b) Mean donation amounts for the two charities among 71 participants who agreed to contribute to the UNICEF projects. Error bars indicate standard error.
Among the 71 participants who agreed to donate, the proportion of donors to the Africa project (54%) in the initial decision was not statistically distinguishable from that of the Syria project (46%), p = .635 by binomial test. There was also no significant difference in the donated amounts between the two projects (): MAfrica = 214.2 yen and MSyria = 273.0 yen), Welch’s t(62.84) = 1.346, p = .183, 95% CI = [−28.511, 146.15].
How did social information affect participants’ choices?
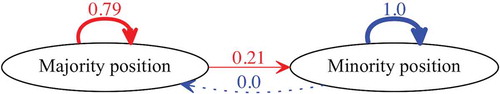
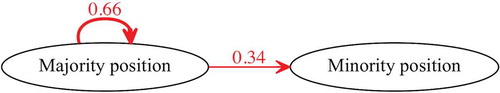
displays proportions of participants who kept or changed their initial decisions after the social information. The proportions were significantly different between the two conditions (p = .028 by Fisher’s exact test). While none of the 22 participants (0%) in the Minority condition changed their initial minority position, 6 out of 28 participants (21%) in the Majority condition changed their initial majority position to support the “less popular” minority project (the switching ratio was slightly higher among female participants [27%] than among male participants [15%]). Given that participants in the Control condition who were not provided social information rarely changed their initial choices (1 out of 21 participants: 5%), the less popular (minority) project among the preceding donors exerted more gravity in participants’ final choices, whether it was for Africa or Syria (p = .648 by Fisher’s exact test), than the majority project.
Figure 3. Proportions of participants who kept or changed their initial decisions after viewing the social information in Experiment 1. While none of the 22 participants (0%) in the Minority condition changed their initial minority position (shown in blue), 6 out of the 28 participants (21%) in the Majority condition changed their initial majority position to the minority position (red). This pattern held whether the initial choice was the Africa project or the Syria project.
Using a multiple logistic regression model, we examined the effects of several predictors of participants’ eventual choices in the Majority condition (i.e., whether to keep or change their initial choices) after learning the social information. The absolute differences of the deservingness ratings [see )] between the two charity projects (Mkeeper = 0.73, Mchanger = 0.50) had no significant effect, β = 0.875, SE = 0.958, Z = 0.913, p = .361. Thus, it was not the case that only those who equally rated the deservingness of the two charity projects changed their initial choices. Likewise, neither the initial donation amounts (Mkeeper = 245.5 yen, Mchanger = 285.0 yen: β = −0.002, SE = 0.003, Z = −0.799, p = .424) nor the response time in the initial decision (Mkeeper = 8.97 s, Mchanger = 9.11 s: β = 0.07, SE = 0.109, Z = 0.642, p = .521) had a significant effect on participants’ eventual choices. Taken together, these results indicated that participants’ decisions to keep or change their choices in the majority condition were not determined by differences in their initial commitment to the chosen project. The mean response time for making final decisions after learning the social information was also statistically indistinguishable between Keepers (M = 22.07 s) and Changers (M = 17.07 s), Welch’s t (3.46) = −1.296, p = .275, 95% CI = [−16.414, 6.407].
Discussion
We observed a significant asymmetry between the Majority and Minority conditions in participants’ choices after viewing social information. When participants believed that their own choices were consistent with the majority’s choice, 21% of them changed their choices to the less popular project, but all of the participants in the Minority condition retained their minority choice. Considering the robust phenomenon of majority-influence in social decision making (Hastie & Kameda, Citation2005; Kameda, Tsukasaki, Hastie, & Berg, Citation2011), the anti-conformity pattern here is the opposite of the typical social influence observed in many attitudinal judgments (Cialdini & Goldstein, Citation2004; Salganik et al., Citation2006).
We reason that this seemingly counterintuitive pattern may be due to inequity aversion (Fehr & Schmidt, Citation1999). Inequity aversion refers to the robust tendency to react negatively to unequal distribution of resources between recipients, and is known to operate in allocation between self and other (Fehr & Schmidt, Citation1999), as well as allocation strictly among others (Hsu et al., Citation2008; Kameda et al., Citation2016; Zhong et al., Citation2016). Notice that, in the Majority condition, changing one’s position to the less popular, minority position would be expected to decrease the inequity in donations (i.e., difference in cumulative amounts) between the two projects. On the other hand, in the Minority condition, changing one’s initial position toward the majority project would increase the inequity. Consistent with this reasoning, 4 out of 6 participants (67%) who changed their initial choices in the Majority condition explicitly mentioned empathic concern toward the less-popular project as the reason for the change in the post-session questionnaire, whereas it was mentioned by only 1 out of 22 participants (5%) who kept their initial choices, p = .003, by Fisher’s exact test (see Supplementary Table 1 for details). Furthermore, the mean rating of the usefulness of social information was marginally lower in the Minority condition (M = 2.54) than in the Majority condition (M = 3.43), Welch’s t (47.844) = 1.726, p = .091, 95% CI = [−0.145, 1.912].
Although these patterns are potentially important, the sample size of Experiment 1 may have been too small to achieve sufficient statistical power. We thus conducted Experiment 2 to see if the key behavioral findings from Experiment 1 were replicable with a larger sample size. There was a high dropout rate for participants (46%) in Experiment 1, reflecting the requirement for participants to volunteer to donate their own money following the recruitment. Given that the high dropout rate severely limited the size of the effective sample for which the majority/minority manipulation was applicable, we decided to employ a vignette design for Experiment 2, where participants stated their intentions for charitable giving in a hypothetical scenario.
Experiment 2
Method
Participants
The sample size of Experiment 2 was determined by a power analysis using the effect size obtained from Experiment 1. Because we found a moderate effect size (Cohen’s w = 0.319) for the Keeper/Changer frequencies in the Majority, Minority and Control conditions of Experiment 1, the minimum sample size to detect the effect with 80% power (using a significance level of 0.05) was 95.
Ninety-nine (35 male, 64 female; Mage ± SDage = 19.71 ± 1.52) students at the University of Tokyo and Taisho University in Japan participated in the study. The study was approved by the ethical committee of the Department of Social Psychology of the University of Tokyo. All participants gave written informed consent.
Procedure
Student volunteers participated in the experiment individually via Qualtrics survey software (Qualtrics Labs, Provo, US). The basic design and procedure of Experiment 2 were identical to those of Experiment 1, except that all participants were asked about their intentions for charitable giving in a hypothetical scenario (i.e., “if you donated 100 yen [comparable to the average donation in Experiment 1] to either the Africa or the Syria project, which project would you choose?”) and rated the deservingness of each project (see )) at both the beginning and the end of the experiment. Social information provided to participants after their initial choices in the Majority and Minority conditions was identical to that used in Experiment 1. Participants were explicitly told that the social information showed the sum of money donated to each charity project by anonymous participants in a preceding related study.
Results
How did social information affect participants’ choices?
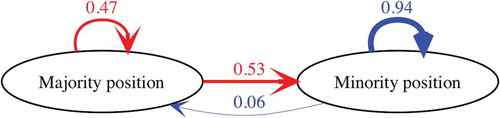
displays proportions of participants who kept or changed their initial decisions after viewing the social information in the Majority and Minority conditions. While only 2 out of 33 participants (6%) in the Minority condition changed their initial minority position, 18 out of 34 participants (53%) in the Majority condition changed their initial majority position to support the “less popular” project (p < .0001 by Fisher’s exact test). The switching ratio was slightly higher among female participants (57%) than among male participants (45%). Only 1 out of 32 participants (3%) in the Control condition changed their initial decisions. The proportions were significantly different between the three conditions (χ2(2) = 31.278, p < .0001, Cohen’s w = 0.562). These results replicated the choice patterns in Experiment 1.
Figure 4. Proportions of participants who kept or changed their initial decisions after the social information in Experiment 2. While only 2 out of the 33 participants (6%) in the Minority condition changed their initial minority position (shown in blue), 18 out of the 34 participants (53%) in the Majority condition changed their initial majority position to the minority position (red). This pattern was consisted with the results of Experiment 1 (see ).
As in Experiment 1, the initial decision (i.e., Africa or Syria) did not affect participants’ choices about whether to keep or change their initial decisions after learning the social information in the Majority condition (Fisher’s exact test, p = .46). Likewise, a multiple logistic regression analysis revealed that neither response times for making initial decisions (Mkeeper = 18.44 s, Mchanger = 17.43 s: β = −0.007, SE = 0.031, Z = −0.229, p = .819) nor the absolute differences of the initial deservingness ratings between the two charity projects (Mkeeper = 0.75, Mchanger = 0.78: β = −0.012, SE = 0.374, Z = −0.033, p = .974) predicted participants’ eventual decisions in the Majority condition.
Subjective responses after learning the social information
As in Experiment 1, the modal subjective reason (10 out of 18, or: 56%) that Changers in the Majority condition provided for their final decisions was empathic concern toward the less-popular project, whereas this response was not given by any of the 16 Keepers (Fisher’s exact test, p = .0003; Supplementary Table 1). Likewise, after learning the social information, Changers in the Majority condition tended to differentiate deservingness ratings between the two charity projects (M = 0.78) more than Keepers (M = 0), Welch’s t (31.021) = 1.985, p = .056, 95% CI = [−0.021, 1.577]). The mean rating of the usefulness of social information was also marginally lower in the Minority condition (M = 3.30) than in the Majority condition (M = 4.12), Welch’s t (63.34) = 1.69, p = .096, 95% CI = [−0.149, 1.778]). Response times for making final choices after learning the social information were statistically indistinguishable between Keepers (M = 23.55 s) and Changers (M = 28.03 s), Welch’s t (27.304) = 0.976, p = .338, 95% CI = [−4.937, 13.908]. These results were consistent with the results in Experiment 1.
Discussion
The key results of Experiment 1 were all replicated in Experiment 2 with sufficient sample size (as determined by a power analysis using the effect size from Experiment 1). Although hypothetical-response experiments have obvious limitations compared to behavioral experiments (but see Hainmueller, Hangartner, & Yamamoto, Citation2015), participants’ intentions about whether to keep or change initial choices after learning the social information and their reasoning for the final decisions were highly coherent between the two experiments. The overall results indicated that participants who endorsed the minority position after viewing the social information may have been concerned with the inequity between the two projects and more committed to their final choices than those who endorsed the majority position.
Previous research using behavioral games has shown that emotion-related brain regions such as the anterior insula, amygdala, and anterior cingulate cortex are associated with participants’ aversion to inequity between self and other (Haruno & Frith, Citation2010; Yu, Calder, & Mobbs, Citation2014; see also Gu, Hof, Friston, & Fan, Citation2013 for review). Activity in the anterior insula is also modulated by the degree of distributive inequity among others (Hsu et al., Citation2008; Zhong et al., Citation2016). Given these findings, emotions associated with inequity aversion may underlie the common behavioral pattern displayed in Experiments 1 and 2.
To examine this possibility more directly, we conducted Experiment 3. In Experiment 3, we focused on the Majority condition only, in which participants were informed that their initial positions were consistent with the majority view of the preceding participants. Our purpose here was to replicate the key behavioral pattern from Experiments 1 and 2 (the intentional switching to the minority position in the Majority condition) and to shed light on the psychophysiological processes that underlie this behavior.
Experiment 3
In Experiment 3, while participants made decisions we used an eye tracker to measure their gaze pattern and pupil diameter.
Gaze pattern reveals how participants allocate attention among choice options. Previous research has shown that participants direct their gaze more selectively to the eventually-chosen option in many decision contexts, such as when choosing favorite faces (Shimojo, Simion, Shimojo, & Scheier, Citation2003), selecting a route in a maze (Wiener, Hölscher, Büchner, & Konieczny, Citation2012), or judging oldness of photographs (Glaholt & Reingold, Citation2009). Gaze bias is considered to reflect differential valuations about choice alternatives, i.e., how distinct the chosen option is from the other option on the decision-related criterion (Fiedler & Glöckner, Citation2012; Glaholt & Reingold, Citation2011; Mullet & Stewart, Citation2016; Orquin & Mueller Loose, Citation2013; Schotter, Berry, McKenzie, & Rayner, Citation2010).
Pupil dilation (increase in diameter) has been shown to reflect physiological arousal. Previous research indicates that pupil dilation is correlated with skin-conductance change when viewing emotionally arousing images (Bradley et al., Citation2008), and neural activation in the anterior insula, anterior cingulate cortex (Paulus et al., Citation2015) and the locus coeruleus-norepinephrine system (LC-NE: Murphy et al., Citation2014; see Eckstein, Guerra-Carrillo, Miller Singley, & Bunge, Citation2017 for review). The LC-NE system plays a role in arousal mechanisms (Sara & Bouret, Citation2012). We thus compared pupil dilation between Keepers and Changers to see how emotional arousal may underlie their decisions after viewing social information.
Method
Participants
One hundred and forty-nine participants (85 male, 64 female; Mage ± SDage = 19.4 ± 1.3) were recruited from the subject pool at Hokkaido University in Japan. The study was approved by the Institutional Review Board of the Center for Experimental Research in Social Sciences at Hokkaido University. All participants gave written informed consent.
Procedure
Like Experiment 1, Experiment 3 examined participants’ actual charitable decisions. Students who had just finished other psychological experiments were solicited by an experimenter to take part in a short survey concerning the UNICEF charity projects for Africa and Syria as volunteers and potential donors. After the experiment was complete, we matched participants’ donations and contributed the money to the respective projects through UNICEF (22,520 yen [= 220 US dollars] for Africa and 17,300 yen [= 170 US dollars] for Syria).
The procedure of Experiment 3 was identical to that of Experiment 1, except that all participants were assigned to the Majority condition, and an eye tracker was used. Participants’ eye movements and pupil sizes were recorded at 60 Hz using an EyeTribe eye tracker (The Eye Tribe, Copenhagen, Denmark). All stimuli were presented on a 12-inch Microsoft Surface Pro 3 screen at 1280 × 740 pixel resolution. Participants were seated with their head resting on a chin rest 60 cm from the screen, and were asked not to move their head from the chin rest to ensure accurate measurements. Calibration was performed using a nine-point calibration procedure by Eye Tribe UI Version 0.9.56 (The Eye Tribe, Copenhagen, Denmark).
Stimuli
To simplify eye tracking, we used images of the two charity projects without text and kept the room illuminated at 300 lux during the experiment. To avoid differences in extraneous stimuli features (e.g., color or contrast), the images and background were set in gray scale with equal average luminance over all pixels. Each stimulus screen was preceded by a fixation cross lasting for 10 seconds to measure a baseline for each participant’s pupil size. The positions of the two charity projects on the stimulus screens were counterbalanced across participants.
Data preparation for eye-tracking
We followed the Tobii User’s Manual Version 3.2 to analyze raw gaze data (Tobii Technology AB, Stockholm, Sweden). We used the moving-average method to reduce noise, and a window-size parameter of 3. In order to detect fixations, saccades, and blinks, we used the default setting of “I-VT fixation filter” described in the Tobii manual. Four participants were excluded from the analysis because of excessive head movement, leaving us with 145 participants in total (83 male, 62 female; Mage ± SDage = 19.4 ± 1.3).
Results and discussion
Behavioral choices
Distribution of donations
We first examined basic statistics from Experiment 3 to assure comparability with Experiment 1. In Experiment 3, 83 (57%) of 145 participants in the survey agreed to donate either to the Africa or the Syria project, and the average donation (including those who did not agree to donate as 0 contributors) was 116 yen. The distribution of donations in Experiment 3 (Supplementary Figure 2) was not statistically different from that of Experiment 1, k = 0.069, p = .882 by Kolmogorov-Smirnov test. Participants’ initial support of the two projects was also similar to that in Experiment 1, with 59% for Africa and 41% for Syria (Fisher’s exact test, p = .517). Thus, the two data sets were comparable in terms of basic features.
Effects of social information on participants’ choices
displays proportions of participants who kept or changed their initial decisions after being informed that their choices were consistent with the majority view among preceding participants. Similar to Experiments 1 and 2, 28 out of 83 participants (34%) changed their initial majority position to support the less popular (minority) project in their final choices (the switching ratio was higher among female participants [47%] than among male participants [22%], p = .02 by Fisher’s exact test). This pattern was commonly observed whether the participant’s initial choice was Africa or Syria (p = .105 by Fisher’s exact test).
Figure 5. Proportions of participants who kept or changed their initial decisions after the social information in Experiment 3. Twenty-eight out of 83 participants (34%) changed their initial majority position to support the less popular project. Note that all participants in Experiment 3 were assigned to the Majority condition.
A multiple logistic regression analysis also confirmed that participants’ eventual choices after learning the social information were not predicted by the absolute differences in the initial deservingness between the two charity projects (Mkeeper = 0.62, Mchanger = 0.46: β = 0.147, SE = 0.288, Z = 0.509, p = .611), donation amounts (Mkeeper = 195.64 yen; Mchanger = 216.79 yen: β = −0.001, SE = 0.002, Z = −0.388, p = .698), or response times for initial decisions (Mkeeper = 8.23 s; Mchanger = 9.20 s: β = −0.014, SE = 0.04, Z = −0.348, p = .728). Response times for making final decisions were also statistically indistinguishable between Keepers (M = 14.00 s) and Changers (M = 13.57 s), Welch’s t (58.007) = −0.212, p = .833, 95% CI = [−4.523, 3.656].
Experiment 3 successfully replicated the key behavioral finding from Experiments 1 and 2, along with the other basic features. Having established the behavioral consistency between the three experiments, we next investigated the psychophysiological processes underlying the anti-conformity pattern using the eye-tracking data. In particular, we compared Keepers and Changers in their psychophysiological responses to see how emotional arousal and commitment may underlie their decisions in charitable giving.
Eye-tracking results
Gaze pattern
displays temporal changes in the average proportions of gaze fixation on the eventually-chosen option (as compared to the other option) among Keepers who retained their majority position and Changers who switched to the minority position (see Supplementary Figure 3 for the definition of screen areas). As described above, the average decision time was statistically indistinguishable between Keepers and Changers. Because there were large individual variations in decision times, we divided the decision time used by each participant to reach his/her final decision into quartiles, and calculated the proportion of gaze fixed on the eventually-chosen option in each quartile (see also Supplementary Figure 4 for another analysis).
Figure 6. Temporal changes in the average proportions of gaze fixation on the eventually-chosen option among Keepers (those who retained the majority position) and Changers (those who switched to the minority position) after learning that their individual choices were consistent with the majority view among preceding participants. We divided decision time (from onset of the choice screen to participant’s decision; see also the caption of Supplementary Figure 3) used by each participant to reach his/her final decision into quartiles. Error bars indicate standard error.
We analyzed the gaze data using a linear mixed model (LMM) as implemented in the R package ‘lme4ʹ (Bates, Mächler, Bolker, & Walker, Citation2015) and R version 3.4.2 (R Core Team, Citation2017) with fixed effects of group (Keeper = 0, Changer = 1), time (the former versus the latter half), and their interaction, and random effect of participant on the intercept. The LMM revealed a significant interaction effect between group and time (β = 0.232, SE = 0.096, Z = 2.427, p = .017), but the effects of group (β = −0.049, SE = 0.088, Z = −0.553, p = .581) and time (β = −0.009, SE = 0.058, Z = −0.148, p = .883) were not significant. These results indicate that the selective gaze bias to the eventually-chosen option was evident among Changers but not among Keepers, indicating that relative evaluation of the two options in final choices may have been more distinct in Changers than Keepers.
Pupil dilation
We defined pupil dilation by calculating the ratio of pupil diameter at each time point to the baseline. For each participant, the baseline was set as the average pupil diameter over a time window of the last 8 seconds on the preceding fixation-cross screen (the first 2 seconds were discarded to remove carryover effects from the earlier screen). Because participants made self-paced decisions in the current study, we chose the final 2 seconds just prior to confirming the final choice as the time window for analysis.
displays mean pupil dilation for Keepers and Changers. For the analysis, we divided the 2 seconds prior to the final choice into halves, computing mean pupil dilation during each second for each participant. We analyzed the pupil dilation data using a linear mixed model (LMM) with fixed effects of group (Keeper = 0, Changer = 1), time (the former versus the latter half), and their interaction, and random effect of participant on the intercept. The model indicated a significant effect of time, β = 0.044, SE = 0.021, Z = 2.081, p = .042, and the interaction, β = 0.065, SE = 0.026, Z = 2.461, p = .014. The effect of group was not significant, β = 0.013, SE = 0.022, Z = 0.609, p = .544. Pupil dilation prior to confirming the final choice was higher among Changers, suggesting that they were more aroused than Keepers.
Figure 7. Time course of pupil dilation during final 2 seconds just prior to confirmation of final choices among Keepers and Changers. The Y axis represents pupil dilation as a ratio of the baseline. The dotted line represents average pupil dilation among Keepers (those who retained the majority position), and the solid line represents that of Changers (those who switched to the minority position). Shaded regions represent standard error.
Dispositional empathy and attention to images in charitable giving
So far we have shown that, after viewing social information indicating that they belonged to the majority () left), Changers who switched to the minority position exhibited more physiological arousal () and (re-)evaluated the two projects more distinctly () than Keepers who retained the majority position. These results may also indicate that, compared to Keepers, Changers were not only emotionally more reactive to the social information, but also more empathic and sensitive to others’ misfortune in general. To address this point, we analyzed participants’ dispositional empathy and voluntary attention to images in charity, which are associated with affective neural responses in charitable giving (Genevsky, Vastfjall, Slovic, & Knutson, Citation2013).
Empathic concern
We measured dispositional empathy using the Interpersonal Reactivity Index (Davis, Citation1983), in which the participant is asked about tendencies to experience feelings of sympathy and compassion for unfortunate others in daily life on a 7-point scale (e.g., “I often have tender, concerned feelings for people less fortunate than me”). The empathic concern score was higher among Changers (Mchanger = 5.12) than Keepers (Mkeeper = 4.67), Welch’s t(64.477) = 2.589, p < .05 (Bonferroni corrected; see Supplementary Figure 5), 95% CI = [0.102, 0.793].
Attention to images
We also examined the degree to which eventual Keepers and Changers viewed the images while making initial choices before receiving social information (see Supplementary Figure 6 for the definition of screen areas). For each participant, we computed the proportion of fixation duration in the picture areas over that in the entire screen area. The proportions of picture viewing had a marginally significant effect on participants’ eventual choices, if added as a predictor in the multiple logistic regression analysis (β = 1.811, SE = 1.085, Z = 1.668, p = .095) along with the aforementioned predictors (i.e., the absolute differences in the initial deservingness between the two charity projects, β = −0.018, SE = 0.296, Z = −0.062, p = .95; donation amounts, β = 0.001, SE = 0.002, Z = 0.424, p = .672; and response times for initial decisions, β = 0.002, SE = 0.042, Z = 0.051, p = .959).
We also examined participants’ gaze alternation between the two images during initial decision-making. For each participant, we counted the frequency of fixations on the two pictures consecutively without fixating on other screen areas in between (e.g., an Africa-Syria-Africa fixation sequence counts as two alternations). Gaze alternation between the two images predicted participants’ eventual choices significantly (multiple logistic regression analysis, β = 0.487, SE = 0.219, Z = 2.217, p = .027) along with the aforementioned predictors (i.e., the absolute differences in the initial deservingness between the two charity projects, β = 0.024, SE = 0.3, Z = 0.081, p = .935; donation amounts, β = 0.0004, SE = 0.002, Z = 0.25, p = .803; and response times for initial decisions, β = −0.044, SE = 0.051, Z = −0.869, p = .385). Because its correlation with the proportion of picture viewing was high, r = 0.482, p < .0001, we decided not to include the two predictors simultaneously to avoid a multicollinearity in the model. These results indicate that, compared to eventual Keepers, eventual Changers had a greater tendency to focus on concrete images of the victims of famine or war when they made initial decisions for charitable giving.
General discussion
Charitable giving is a significant sector of the modern economy, and it critically depends on each individual’s willingness to help distant, unrelated others without expecting direct or immediate reciprocity from the recipients (Bowles & Gintis, Citation2011; Trivers & Coultas, Citation1971). For example, according to recent statistics (Giving USA, Citation2017), 72% of the $390 billion in donations in the US in 2016 came from individuals, while only 5% came from corporations. In this study, we examined how individual charitable giving decisions may be affected by social information. More specifically, we focused on how a “majority heuristic” (Festinger, Citation1954; Henrich & Boyd, Citation1998; Kameda & Nakanishi, Citation2002, Citation2003) may operate in charity situations, in which students who do not necessarily have the specialized knowledge or skills to evaluate the “true” qualities of various ongoing charity projects, make real donations from their own funds.
Contrary to the robust majority-influence found in many attitudinal (Cialdini & Goldstein, Citation2004; Kameda et al., Citation2012) and consumer decisions (Salganik et al., Citation2006), Experiment 1 revealed that no participant in the Minority condition conformed to the majority position, while 21% of the participants in the Majority condition switched to the less popular, minority position. This switching from the majority to the minority position (along with an almost complete absence of switching from the minority to the majority position) was replicated in Experiment 2, confirming the robustness of this phenomenon.
Experiment 3 was designed to shed light on psychophysiological processes that underlie the switching behavior using an eye tracker. Previous research showed that emotion-related brain regions such as the anterior insula and amygdala were associated with the degree of inequity aversion in behavioral choices (Haruno & Frith, Citation2010; Hsu et al., Citation2008; Yu et al., Citation2014; Zhong et al., Citation2016). We thus examined participants’ gaze pattern and pupil dilation during decision making to see how emotional arousal and commitment might relate to switching behavior. The results confirmed that Keepers, who retained the majority position, and Changers, who switched to the minority position, were markedly different on both of these measures.
Specifically, while Changers showed a typical gaze bias, directing their attention to the eventually-chosen option (Glaholt & Reingold, Citation2009; Wiener et al., Citation2012), the gaze pattern among Keepers was divided between the two options until the end (). Given that gaze bias reflects differentiation between options on the decision-related criterion (Fiedler & Glöckner, Citation2012; Glaholt & Reingold, Citation2011; Mullet & Stewart, Citation2016; Orquin & Mueller Loose, Citation2013; Schotter et al., Citation2010), Keepers seem to have remained ambivalent in their final decisions between the two charity projects, and thus did not take any action to change their decision. Time course of pupil dilation, which is related to neural activation in the locus coeruleus-norepinephrine system (Eckstein et al., Citation2017; Murphy et al., Citation2014), revealed a similar pattern (). Pupil dilation prior to confirming the final choice was higher among Changers, suggesting that they were more physiologically aroused than Keepers during decision making after learning the social information (Bradley et al., Citation2008; Paulus et al., Citation2015; Sara & Bouret, Citation2012). Such arousal may have made Changers more likely to form differential valuations between the two charity projects in their final choices (as inferred from subjective responses in Experiment 2) than Keepers (Kempf, Citation1999; Mano, Citation1997).
Interestingly, Changers directed more attention to concrete images as well, alternating their gazes more often between the two images when making initial decisions as compared to Keepers. Their dispositional empathic-concern scores (Davis, Citation1983) were also higher than those of Keepers. Taken together, these results suggest that empathic concerns about others’ misfortune play a key role for the support of the “underdog” in charitable giving. The inequity in donated amounts between the two charity projects may elevate emotional arousal for some participants enough to switch to the less popular, minority position (Changers), while others might remain ambivalent about their final choices, failing to resolve the psychological conflicts (Keepers).
As far as we know, this is the first study to report the underdog effect in charitable giving (especially the intentional switching from the majority to the minority position in response to social information). Given its novelty, however, it is important to consider possible limitations.
This study employed a charity situation based on the ongoing UNICEF projects for Africa and Syria. Obviously, the aim of these UNICEF projects is to help people suffering from large-scale violence, epidemics, famine, and natural disasters. It is likely that emotions play a large role in such cases. As demonstrated in the “identifiable victim effect” (Kogut & Ritov, Citation2005), the tangible and vivid images of another’s misfortune may well trigger empathic concern for the least fortunate, prompting donors to attend to inequity among recipients in cumulative amounts. However, this condition may not hold for other charitable causes. For example, in donations to religious organizations, people are likely to be committed to their own religions or in-groups (Everett, Faber, & Crockett, Citation2015). Also, when donating to scientific research, people may be less emotional and tend to support a “socially significant” research project, following the implicit majority norm. In such cases, responses to social information seem likely to depend on the type of charitable activity and the social context. The underdog effect as observed here may be most relevant to cases where donors can decide as neutral third parties, and emotional features associated with inequity are used to signal need. Future research addressing the boundary conditions for the underdog effect will be important for a better understanding of the impacts of social information in charitable giving.
Some cautions are also due in the interpretations of the pupil-dilation results in this study. Across the three experiments, the modal subjective reason that Changers provided for their final choices was sympathy for the less-supported “underdog” (Supplementary Table 1). We believe that our emotion-based interpretation of the underdog effect is generally in line with these subjective responses as well as other behavioral responses (e.g., greater focus on picture images among Changers). However, we must acknowledge that the pupil-dilation results per se are by no means conclusive for this interpretation (see Hess & Polt, Citation1964; Murphy, Vandekerckhove, & Nieuwenhuis, Citation2014; Urai, Braun & Doner, Citation2017 for other interpretations of the pupil signal). Future research addressing the involvement of emotion-related brain regions, such as anterior insula, amygdala, and anterior cingulate cortex, will be highly important to understand the neural underpinnings of the underdog effect more directly (e.g., Genevsky et al., Citation2013; Haruno & Frith, Citation2010; Hsu et al., Citation2008; Yu et al., Citation2014; Zhong et al., Citation2016).
It is also important to see how robust this phenomenon is across different cultures. The three experiments in this study were run at two different locations in Japan (Experiments 1 & 2 in Tokyo and Experiment 3 in Hokkaido). Some argue that the culture of Hokkaido, which was a frontier area until settlement started about 150 years ago, is individualistic, valuing autonomy and self-reliance more, as compared to the older regions of Japan including Tokyo (Kitayama, Ishii, Imada, Takemura, & Ramaswamy, Citation2006). Although we observed no such regional differences here, examining socio-cultural boundaries is critical to understanding how (possibly different) emotions may come into play in charitable giving. Humans are certainly equipped with empathic concerns for others’ misfortune (De Waal, Citation2010; Hsu et al., Citation2008; Kameda et al., Citation2016). However, the activation and expression of those altruistic capacities in helping may differ deeply between societies and cultures (Henrich et al., Citation2001), which constitutes a key dimension to understanding humans as a cooperative species (Bowles & Gintis, Citation2011).
SocialNeuroscience_20181128_SI.docx
Download MS Word (6.2 MB)Acknowledgments
We thank the faculty and staff of the Center for Experimental Research in Social Sciences at Hokkaido University, who kindly allowed us to use their laboratory resources. We also thank the Japan Committee for UNICEF for permission to use the pictures of the Africa and Syria charity projects in this article. This research was conducted independently and received no financial support from UNICEF.
Disclosure statement
The authors declared no conflicts of interest with respect to their authorship or the publication of this article.
Supplemental material
Supplemental data for this article can be accessed here.
Additional information
Funding
References
- Andreoni, J. (1998). Toward a theory of charitable fund‐raising. Journal of Political Economy, 106(6), 1186–1213.
- Asch, S. E. (1951). Effects of group pressure upon the modification and distortion of judgments. Pittsburgh, PA: Carnegie Press.
- Bates, D., Mächler, M., Bolker, B., & Walker, S. (2015). Fitting linear mixed-effects models using lme4. Journal of Statistical Software, 67(1), 1–48.
- Bowles, S., & Gintis, H. (2011). A cooperative species: human reciprocity and its evolution. Princeton, NJ: Princeton University Press.
- Bradley, M. B., Miccoli, L. M., Escrig, M. A., & Lang, P. J. (2008). The pupil as a measure of emotional arousal and autonomic activation. Psychophysiology, 45(4), 602–607.
- Charities Aid Foundation. (2018). The world giving index. Retrieved from https://www.cafonline.org/about-us/publications/2018-publications/caf-world-giving-index-2018
- Cialdini, R. B., & Goldstein, N. J. (2004). Social influence: Compliance and conformity. Annual Review of Psychology, 55(1), 591–621.
- Davis, M. H. (1983). Measuring individual differences in empathy: Evidence for a multidimensional approach. Journal of Personality and Social Psychology, 44(1), 113–126.
- De Waal, F. (2010). The Age of Empathy: Nature’s Lessons for a Kinder Society. New York, NY: Harmony Books.
- Dellavigna, S., List, J. A., & Malmendier, U. (2012). Testing for altruism and social pressure in charitable giving. Quarterly Journal of Economics, 127(1), 1–56.
- Deutsch, M., & Gerard, H. B. (1955). A study of normative and informational social influences upon individual judgment. The Journal of Abnormal and Social Psychology, 51(3), 629–636.
- Eckstein, M. K., Guerra-Carrillo, B., Miller Singley, A. T., & Bunge, S. A. (2017). Beyond eye gaze: What else can eyetracking reveal about cognition and cognitive development?. Developmental Cognitive Neuroscience, 25, 69–91.
- Everett, J. A. C., Faber, N. S., & Crockett, M. (2015). Preferences and beliefs in ingroup favoritism. Frontiers in Behavioral Neuroscience, 9, 15.
- Fehr, E., & Schmidt, K. (1999). A theory of fairness, competition and cooperation. Quarterly Journal of Economics, 114(3), 817–868.
- Festinger, L. (1954). A theory of social comparison processes. Human Relations, 7(2), 117–140.
- Fiedler, S., & Glöckner, A. (2012). The dynamics of decision making in risky choice: An eye-tracking analysis. Frontiers in Psychology, 3, 335.
- Genevsky, A., Vastfjall, D., Slovic, P., & Knutson, B. (2013). Neural underpinnings of the identifiable victim effect: Affect shifts preferences for giving. Journal of Neuroscience, 33(43), 17188–17196.
- Giving USA. (2017). The annual report on philanthropy for the year 2016. Retrieved from https://givingusa.org/tag/giving-usa-2017/
- Glaholt, M. G., & Reingold, E. M. (2009). The time course of gaze bias in visual decision tasks. Visual Cognition, 17(8), 1228–1243.
- Glaholt, M. G., & Reingold, E. M. (2011). Eye movement monitoring as a process tracing methodology in decision making research. Journal of Neuroscience, Psychology, and Economics, 4(2), 125–146.
- Gu, X., Hof, P. R., Friston, K. J., & Fan, J. (2013). Anterior insular cortex and emotional awareness. Journal of Comparative Neurology, 521(15), 3371–3388.
- Hainmueller, J., Hangartner, D., & Yamamoto, T. (2015). Validating vignette and conjoint survey experiments against real-world behavior. Proceedings of the National Academy of Sciences, 112(8), 2395–2400.
- Hare, T. A., Camerer, C. F., Knoepfle, D. T., O’Doherty, J. P., & Rangel, A. (2010). Value computations in ventral medial prefrontal cortex during charitable decision making incorporate input from regions involved in social cognition. Journal of Neuroscience, 30(2), 583–590.
- Haruno, M., & Frith, C. D. (2010). Activity in the amygdala elicited by unfair divisions predicts social value orientation. Nature Neuroscience, 13(2), 160–161.
- Hastie, R., & Kameda, T. (2005). The robust beauty of majority rules in group decisions. Psychological Review, 112(2), 494–508.
- Henrich, J., & Boyd, R. (1998). The evolution of conformist transmission and the emergence of between-group differences. Evolution and Human Behavior, 19(4), 215–241.
- Henrich, J., Boyd, R., Bowles, S., Camerer, C., Fehr, E., Gintis, H., & McElreath, R. (2001). In search of homo economicus: Behavioral experiments in 15 small-scale societies. The American Economic Review, 91(2), 73–78.
- Hess, E. H., & Polt, J. M. (1964). Pupil size in relation to mental activity during simple problem-solving. Science, 143(3611), 1190–1192.
- Hsu, M., Anen, C., & Quartz, S. R. (2008). The right and the good: Distributive justice and neural encoding of equity and efficiency. Science, 320(5879), 1092–1095.
- Kameda, T., Inukai, K., Higuchi, S., Ogawa, A., Kim, H., Matsuda, T., & Sakagami, M. (2016). Rawlsian maximin rule operates as a common cognitive anchor in distributive justice and risky decisions. Proceedings of the National Academy of Sciences, 113(42), 11817–11822.
- Kameda, T., & Nakanishi, D. (2002). Cost – Benefit analysis of social/cultural learning in a nonstationary uncertain environment: An evolutionary simulation and an experiment with human subjects. Evolution and Human Behavior, 23(5), 373–393.
- Kameda, T., & Nakanishi, D. (2003). Does social/cultural learning increase human adaptability? Rogers’s question revisited. Evolution and Human Behavior, 24(4), 242–260.
- Kameda, T., Tsukasaki, T., Hastie, R., & Berg, N. (2011). Democracy under uncertainty: The wisdom of crowds and the free-rider problem in group decision making. Psychological Review, 118(1), 76–96.
- Kameda, T., Wisdom, T., Toyokawa, W., & Inukai, K. (2012). Is consensus-seeking unique to humans? A selective review of animal group decision-making and its implications for (human) social psychology. Group Processes & Intergroup Relations, 15(5), 673–689.
- Kempf, D. S. (1999). Attitude formation from product trial: Distinct roles of cognition and affect for hedonic and functional products. Psychology and Marketing, 16(1), 35–50.
- Kitayama, S., Ishii, K., Imada, T., Takemura, K., & Ramaswamy, J. (2006). Voluntary settlement and the spirit of independence: Evidence from Japan’s “northern frontier.”. Journal of Personality and Social Psychology, 91(3), 369–384.
- Kogut, T., & Ritov, I. (2005). The “identified victim” effect: An identified group, or just a single individual? Journal of Behavioral Decision Making, 18(3), 157–167.
- Mano, H. (1997). Affect and persuasion: The influence of pleasantness and arousal on attitude formation and message elaboration. Psychology and Marketing, 14(4), 315–335.
- Mullet, T. L., & Stewart, N. (2016). Implications of visual attention phenomena for models of preferential choice. Decision, 3(4), 231–253.
- Murphy, P. R., O’Connell, R. G., O’Sullivan, M., Robertson, I. H., & Balsters, J. H. (2014). Pupil diameter covaries with BOLD activity in human locus coeruleus. Human Brain Mapping, 35(8), 4140–4154.
- Murphy, P. R., Vandekerckhove, J., & Nieuwenhuis, S. (2014). Pupil-linked arousal determines variability in perceptual decision making. PLoS Computational Biology, 10(9), e1003854.
- Orquin, J. L., & Mueller Loose, S. (2013). Attention and choice: A review on eye movements in decision making. Acta Psychologica, 144(1), 190–206.
- Paulus, F. M., Krach, S., Blanke, M., Roth, C., Belke, M., Sommer, J., & Knake, S. (2015). Fronto-insula network activity explains emotional dysfunctions in juvenile myoclonic epilepsy: Combined evidence from pupillometry and fMRI. Cortex, 65, 219–231.
- R Core Team. 2017. R: A Language and Environment for Statistical Computing. Vienna, Austria: R Foundation for Statistical Computing. Available online at http://www.R-project.org/.
- Salganik, M. J., Dodds, P. S., & Watts, D. J. (2006). Experimental study of inequality and unpredictability in an artificial cultural market. Science, 311(5762), 854–856.
- Sara, S. J., & Bouret, S. (2012). Orienting and reorienting: The locus coeruleus mediates cognition through arousal. Neuron, 76(1), 130–141.
- Schotter, E. R., Berry, R. W., McKenzie, C. R., & Rayner, K. (2010). Gaze bias: Selective encoding and liking effects. Visual Cognition, 18(8), 1113–1132.
- Shang, J., & Croson, R. (2009). A field experiment in charitable contribution: The impact of social information on the voluntary provision of public goods. The Economic Journal, 119(540), 1422–1439.
- Sherif, M., & Murphy, G. (1936). The psychology of social norms. NewYork, NY: Harper and Row.
- Shimojo, S., Simion, C., Shimojo, E., & Scheier, C. (2003). Gaze bias both reflects and influences preference. Nature Neuroscience, 6(12), 1317–1322.
- Soetevent, A. R. (2005). Anonymity in giving in a natural context - A field experiment in 30 churches. Journal of Public Economics, 89(11–12), 2301–2323.
- Trivers, R., & Coultas, J. C. (1971). The evolution of reciprocal altruism. The Quarterly Review of Biology, 46(1), 35–57.
- Urai, A. E., Braun, A., & Donner, T. H. (2017). Pupil-linked arousal is driven by decision uncertainty and alters serial choice bias. Nature Communications, 8, 14637.
- Vesterlund, L. (2003). The informational value of sequential fundraising. Journal of Public Economics, 87(3), 627–657.
- Wiener, J. M., Hölscher, C., Büchner, S., & Konieczny, L. (2012). Gaze behaviour during space perception and spatial decision making. Psychological Research, 76(6), 713–729.
- Yu, R., Calder, A. J., & Mobbs, D. (2014). Overlapping and distinct representations of advantageous and disadvantageous inequality. Human Brain Mapping, 35(7), 3290–3301.
- Zhong, S., Chark, R., Hsu, M., & Chew, S. H. (2016). Computational substrates of social norm enforcement by unaffected third parties. NeuroImage, 129, 95–104.