
ABSTRACT
The experience of power is typically associated with social disengagement, yet power has also been shown to facilitate configural visual encoding – a process that supports the initial perception of a human face. To investigate this apparent contradiction, we directly tested whether power influences the visual encoding of faces. Two experiments, using neural and psychophysical assessments, revealed that low power impeded both first-order configural processing (the encoding of a stimulus as a face, assessed by the N170 event-related potential) and second-order configural processing (the encoding of feature distances within configuration, assessed using the face inversion paradigm), relative to high-power and control conditions. Power did not significantly affect facial feature encoding. Results reveal an early and automatic effect of low power on face perception, characterized primarily by diminished face processing. These findings suggest a novel interplay between visual and cognitive processes in power’s influence on social behavior.
KEYWORDS:
Power has profound effects on human relationships, influencing how we judge and act toward others in a range of contexts (Guinote, Citation2017; Keltner et al., Citation2003; Magee & Galinsky, Citation2008). In direct social interactions, power has been shown to affect how people attend to others, their ability to take another’s perspective, and their tendency to feel empathy (Galinsky et al., Citation2006; Goodwin et al., Citation2000; Van Kleef et al., Citation2008). However, many social interactions begin with the perception of another person’s face, and given evidence that power also influences the visual processing of nonsocial objects (Guinote, Citation2007; Smith & Trope, Citation2006), we asked whether the social effects of power may extend to the initial encoding of a person’s face – that is, the initial recognition that an object is a fellow human being. Using neural and behavioral indices of configural face processing, the present research investigated the effect of manipulated feelings of high or low power on early face perception
Power effects of social and nonsocial perceptions
Existing theories of power and related empirical research suggest alternative hypotheses for its effect on visual face encoding. On one hand, compared with low power, high power has been associated with greater social distance (Magee & Smith, Citation2013) and decreased interpersonal attention and individuation (Goodwin et al., Citation2000), such that the powerful tend to view other, lower power people as less important, judging them more in terms of their social roles than as individuals. Such effects may function to maintain one’s power and promote one’s goals (Fiske, Citation1993; Schmid & Amodio, Citation2017). People experiencing high power, as opposed to low power, have also been shown to express greater prejudice and stereotyping (Goodwin et al., Citation2000; Guinote et al., Citation2010; Richeson & Ambady, Citation2003; Schmid & Amodio, Citation2017), engage less in social perspective taking (Galinsky et al., Citation2006), show less empathic concern and compassion for other people’s suffering (Van Kleef et al., Citation2008), and show greater dehumanization (Lammers & Stapel, Citation2011). Although there are exceptions, such as when prosociality supports one’s goals (e.g., Côté et al., Citation2011; Overbeck & Park, Citation2001, Citation2006), this literature generally finds that, compared with low power, high power undermines social engagement and thus suggests it would also impede the early encoding of a face.
On the other hand, however, research examining the effect of power on nonsocial visual perception may reveal a domain in which high power may enhance social processing relative to low power. In a series of studies by Smith and Trope (Citation2006), the experience of high power promoted the processing of superordinate/global (vs. subordinate/local) information, relative to low power. In another study, Guinote (Citation2007, Study, p. 3) presented participants with Navon (Navon, Citation1977) letters – large letters composed of several small letters – and showed that low-power participants were slower to read the large, globally-processed letters than the small, locally-processed letters, whereas high-power participants were relatively fast at reading both type of letters. In other words, the experience of high power enhanced the global processing of stimuli relative to low power, whereas power has a less pronounced effect, if any, on local information processing. Together, these findings suggest that at the perceptual level of processing, high power may enhance one’s ability to configurally encode objects, including human faces, relative to low power.
Importantly, however, few of the studies reported above included a control group, and thus they cannot specify whether an observed effect of power pattern represents the effect of high power or low power. Hence, in addition to our question of how power influences the visual processing of faces, the question of whether such effects are driven primarily by the experience of high or low power remains unresolved.
The visual processing of faces
Like the perception of nonsocial objects, the perception of a face involves both global and local forms of perceptual processing (e.g., Leder & Bruce, Citation1998; Lobmaier et al., Citation2008; Mondloch et al., Citation2002). This multi-step process includes the holistic encoding of a stimulus as a face (as opposed to another non-conspecific object), the distinction between different face identities, and the recognition of specific facial features. A global focus corresponds to first-order configural encoding – the detection of the canonical pattern of two eyes above a nose above a mouth – which is key to identifying a stimulus as a face. A global focus also corresponds to second-order configural encoding – the processing of distances between facial features – which enables classification of an individual’s facial identity. By contrast, a local processing focus corresponds to featural face encoding. Featural face encoding involves the processing of individual facial features, such as eyes, nose, and mouth.
In normal face perception, these components of face processing unfold concomitantly, rapidly, and automatically, upon viewing an individual’s face. Yet the relative influence of configural and featural encoding in face perception may have implications for social interactions. For example, a long tradition of research shows that face recognition is primarily based on a holistic, integrative processing of its elements (i.e., configural face processing), and that recognition is much more difficult when one must rely on featural processing (Tanaka & Farah, Citation1993; Tanaka & Sengco, Citation1997; Wang et al., Citation2012). Other research suggests that impaired configural processing of faces may contribute to the dehumanization and, in turn, mistreatment of a perceived individual (Fincher & Tetlock, Citation2016; Hugenberg et al., Citation2015; Krosch & Amodio, Citation2019; Ratner & Amodio, Citation2013). By uncovering power effects on face encoding, we may further elucidate how power influences social perception.
Although research has not yet directly investigated the influence of power on face encoding, clues to such an effect were suggested in findings of Schmid and Amodio (Citation2017) – a study examining the effect of power on the neural processing of Black and White faces as it related to prejudice and stereotyping. While not of interest to Schmid and Amodio (Citation2017), their results revealed a main effect of power on face encoding, such that high power evoked stronger N170 responses to faces (indicating greater first-order configural processing) than low power across stimulus conditions. This finding offers preliminary evidence that power may indeed promote configural face encoding; however, it is unclear whether this effect occurs outside the context of racial bias, and this prior experiment was not designed to discern effects of configural and featural encoding.
The present research
Based on past research showing that high power facilitates global information processing relative to low power (Guinote, Citation2007; Smith & Trope, Citation2006), we expected that power would modulate the configural processing of faces – both the neural processing of first-order configuration, as indexed by the N170 component of the ERP in Study 1, and second-order configurations, as indexed by the face inversion effect in Study 2. Because Guinote (Citation2007) found that high-power and low-power participants did not differ significantly in local information processing, we did not expect power to affect featural processing, which relates to a more local processing style. We included a power-neutral control group in our studies; its inclusion afforded the ability to test whether any effect of power was driven by the manipulation of high power, low power, or both. This research was approved by the university’s Institutional Review Board, and all measures, manipulations, and exclusions are disclosed herein.
Study 1
Study 1 examined the effect of power on configural face encoding (i.e., first-order configurations) – the process through which a stimulus is encoded as a face. To do so, we assessed the N170 component of the event-related potential (ERP) in response to faces among participants assigned to high power, low power, and control conditions.
The N170 is a negative-polarity signal occurring approximately 170 ms after face onset, which provides a neural index of the configural encoding of a face in visual perception (Bentin & Deouell, Citation2000; Caldara et al., Citation2003; Eimer, Citation2000; Rossion, Citation2014; Rossion et al., Citation1999; Rossion & Jacques, Citation2012). The N170 is typically strongest at right temporo-occipital scalp sites (Herrmann et al., Citation2005), with neural generators observed in the fusiform gyrus as well as both inferior and superior temporal cortex (Herrmann et al., Citation2005; Horovitz et al., Citation2004; Nguyen & Cunnington, Citation2014; Sadeh et al., Citation2010). The N170 is particularly responsive to faces, compared with non-face images (Bentin et al., Citation1996), and it reflects the global information processing of faces (Ince et al., Citation2016); specifically, the degree of first-order configural processing (Mercure et al., Citation2008). Visual processing, as indexed by the N170, has also been shown to be sensitive to task goals and individuals’ social goals in past research (Ofan et al., Citation2011, Citation2014; Senholzi & Ito, Citation2013), making this neural index especially relevant to test our competing predictions concerning social versus visual processing effects of power. Specifically, in this study, we tested whether high power (compared with low power) increased the configural processing of faces as indexed by heightened N170 responses to faces.
Method
Participants
G*power (Faul et al., Citation2007) indicated that, with the present three-condition between-subjects design, 159 participants were required to obtain an estimated medium sized effect, setting α-error probability at .05 and power at .80. Hence, we aimed for this goal and then recruited additional participants until the end of the semester, which yielded 166 participants in total. Participants were undergraduates at New York University (71% female; Meanage = 19.55, SDage = 1.54) who took part in the study for partial course credit.Footnote1
Procedure
Participants were prepared for electroencephalographic (EEG) recording. Following baseline EEG recordings, participants underwent the power manipulation (either high power, low power, or control, depending on their randomly assigned condition). Participants then performed an image categorization task, in which they classified pictures as faces or objects. Finally, participants completed a questionnaire assessing current feelings and individual differences unrelated to the present analysis.
Power manipulation
Power was manipulated by placing participants in power-related mind-sets with an imagination task while they held body postures matching the imagined scenario (adapted from Cesario & McDonald, Citation2013; see Schmid et al., Citation2018, for exact instructions). In the high-power condition, participants held expansive body postures while imagining being the boss at a firm and overseeing employees, as well as evaluating a subordinate. In the low-power condition, participants held constrictive body postures and imagined being evaluated by their boss or being a freshman in high school having other students around them who made fun of them. This imagination exercise has been successfully used before to manipulate power (e.g., as in Dubois et al., Citation2010; Schmid, Citation2018). As in prior work, the goal of combining the imagination exercise with congruent body postures was to strengthen the overall manipulation (Schmid et al., Citation2018).
Participants retained their pose during the stimulus categorization task. To facilitate the posing during the task, participants in the high-power and the control condition responded with the left and right shift keys, which allowed them keeping the arms on the armrest (high-power condition) or neutrally (control condition). Participants in the low-power condition used the v and b keys so that they could keep their elbows close to the torso and the hands close together.
Stimulus categorization task
Each trial began with the presentation of a fixation cross at the center of the screen (800 ms), followed by a target stimulus (1000 ms). Target stimuli were either faces or objects. Participants were asked to identify each stimulus as a face or object by keypress. Responses were recorded within a 1000 ms window; intertrial intervals were 1000 ms. A total of 80 trials were presented in two blocks; each block contained 20 face and 20 object trials. The categorization task was designed to be very simple and thus we did not expect any power condition effects on accuracy.
Face stimuli depicted male and female faces with neutral expressions, obtained from the UT Dallas Face database (Minear & Park, Citation2004). Face stimuli were presented as 250 × 350 pixel ovals that excluded hair and ears, on a 350 × 350 pixel white background, in grayscale and adjusted for luminance. Object stimuli were grayscale, 350 × 350 pixels, and included houses and chairs ().
Figure 1. Sample stimuli used in the stimulus categorization task in study 1
Subjective feelings
In addition to our main hypothesis, we were interested in whether any power manipulation effects on face processing were associated with the subjective experience of power, given that the process of interest – configural face encoding – occurs rapidly and automatically. Thus, for exploratory purposes, we assessed participants’ subjective feelings at the end of the experimental session. Participants were asked to indicate their current power-related feelings on items that have been used in past research on power (e.g., Schmid et al., Citation2015): powerful, independent, entitled, dominant, influential, strong, submissive, constrained, powerless and dependent (with the latter four items reverse-coded) on a 5-point scale (1 = not at all, 5 = very much). We computed a composite score of power-related feelings (Cronbach’s alpha was acceptable, α = .77).
Participants also indicated their experience of comfort and pain during the assigned pose on a 7-point single-item scale (1 = not at all, 7 = very much), and then indicated their current mood on a 7-point single-item scale (1 = very bad, 7 = very good).
Personality questionnaires
A short set of additional questionnaires was included at the very end of the experiment for reasons unrelated to the present study and is thus not discussed here. It included an affect scale, the social connectedness and social assurance scales (Lee & Robbins, Citation1995), the behavior inhibition and behavioral activation scales (Carver & White, Citation1994), the communal and exchange orientation scales (Clark & Mills, Citation2001), and the ten-item personality inventory (Gosling et al., Citation2003).
EEG recording and processing
EEG was recorded from 14 sites (F7, F3, Fz, F4, F8, Fcz, Cz, CPz, P7, P3, Pz, P4, P8, and Oz), with left earlobe reference (impedance <5 kΩ), from tin electrodes in an elastic cap (ElectroCap, Eaton, OH). Vertical and horizontal eye movements were recorded to facilitate artifact scoring. Signals were amplified with a Neuroscan Synamps2 (El Paso, TX), digitized at 1000 Hz (AC coupling), and passed through a 0.15–100 Hz online filter. Offline, EEG was re-referenced to average earlobes. EEG data were submitted to an automatic regression-based blink correction procedure based on a method suggested by Semlitsch et al. (Citation1986), implemented using NeuroScan Edit software. Data were then filtered through a 1–15 Hz bandpass. This filter setting was chosen because it effectively isolates the ERP component of interest in this study (i.e., the N170) while controlling for both high and low frequencies that are not of theoretical interest.Footnote2
To score ERPs, 800 ms stimulus-locked epochs were extracted starting 400 ms before stimulus onset. Baseline correction (subtraction of average voltage) was based on the 200 ms pre-stimulus time period. Average ERP waveforms were computed separately for faces and objects; trials were only included if the stimulus was correctly classified within the 1000 ms response deadline. Trial exclusions resulted in the following average trials per participant in each condition, out of 40 possible: for face trials, high power: M = 37.48, SD = 3.49; low power: M = 37.90, SD = 2.67; control: M = 36.95, SD = 4.13; for object trials, high power: M = 37.13, SD = 4.04; low power: M = 38.18, SD = 1.90; control: M = 36.43, SD = 6.15. The N170 was scored at the right occipito-temporal scalp site (P8) as the peak negative amplitude between 120 and 190 ms (Jacques & Rossion, Citation2007; Kolassa & Miltner, Citation2006).
Exclusions
Data from 14 participants were excluded from analysis; six due to technical problems (i.e., EEG impedance>5 kΩ, extensive EEG artifacts), four due to missing EEG data, three due to noncompliance (i.e., fell asleep, did not complete task), and one due to receipt of incorrect instructions.
Results
All results were evaluated using two-tailed tests. Bayesian analyses are additionally reported to assist in the interpretation of our main findings and theoretically-relevant null effects. Following Jeffreys (Citation1961) and Kass and Raftery (Citation1995) regarding the interpretation of Bayesian Factors (BF), BFs below 0.33 were interpreted as indicating evidence for a null effect, BFs between 0.33 and 3 were interpreted as indicating inconclusive results, and BFs above 3 were interpreted as indicating evidence for H1. Reporting of BFs provides context for frequentist results in cases where small yet significant effects may not be regarded as fully conclusive or when a nonsignificant result may be interpreted as a null finding.
N170 amplitude
A 3 (Power Condition: low vs. high vs. control) x 2 (Target: faces vs. objects) mixed-design ANOVA on N170 amplitudes produced the expected target main effect, F(1,149) = 37.29, p < .001, ηp2 = .20, indicating that N170s were larger to faces (M = −3.47, SD = 4.00) than to objects (M = −1.68, SD = 3.02) – a pattern replicating the known face-selectivity of the N170. The Power Condition main effect was marginally significant, F(2,149) = 2.57, p = .080, ηp2 = .03, BF10 = 0.64, but was qualified by a significant predicted Power Condition x Target interaction, F(2,149) = 3.55, p = .031, ηp2 = .05 ().
Figure 2. ERP waveforms illustrating the N170 component produced during the stimulus categorization task in Study 1 as a function of power manipulation and stimulus type. A topographic scalp voltage map associated with the N170 peak, showing maximal activity at the right temporo-occipital site, is inset
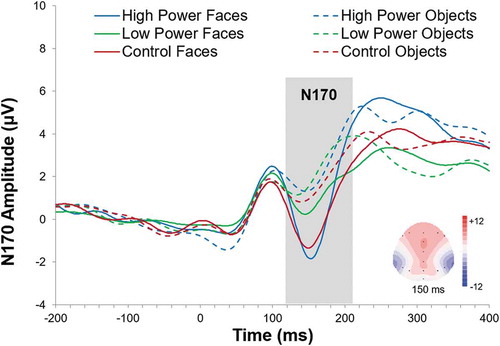
To decompose this interaction, separate ANOVAs were conducted for objects and faces. As expected, power did not significantly affect N170 responses to objects, F(2,149) = 1.52, p = .222, ηp2 = .02, BF10 = 0.24. By contrast, power did moderate N170 responses to faces, F(2,149) = 3.61, p = .030, ηp2 = .05, BF10 = 1.37. 2 Simple effects analyses showed that high-power participants had larger N170 responses to faces (M = −4.34, SD = 3.90) than low-power participants (M = −2.28, SD = 2.61), t(149) = 2.54, p = .012, d = .42, 95% CI [.47, 3.64], BF10 = 12.00. The control group fell in between (M = −3.81, SD = 4.84), and differed from the low-power group, t(149) = 1.99, p = .048, d = .33, 95% CI [.02, 3.04], BF10 = 1.19, but not from the high-power group, t(149) = 0.67, p = .503, d = .11, 95% CI [−2.07, 1.02], BF10 = 0.25. These findings supported our hypothesis that the early encoding of faces (as indexed by N170 amplitudes) is reduced in low-power participants relative to high-power participants and control participants, although Bayesian analysis suggests inconclusive evidence regarding control group differences.
N170 latencies
Although our analyses focused on N170 amplitudes, we also examined N170 peak latency with the same 3 (Power Condition: low vs. high vs. control) x 2 (Target Stimulus: faces vs. objects) mixed-design ANOVA. The Power Condition main effect was not significant, F(2,149) = 0.05, p = .951, ηp2 = .001, nor was the Target Stimulus main effect, F(1,149) = 0.41, p = .524, ηp2 = .003. A significant Power Condition X Target Stimulus interaction emerged, F(2,149) = 3.17, p = .045, ηp2 = .04; although simple main effects were not significant for faces, F(2,149) = 0.22, p = .804, ηp2 = .003, or for objects, F(2,149) = 0.68, p = .509, ηp2 = .009, the interaction pattern suggested that N170 peak activation was slower to faces, compared with objects, among low power participants, but not among high power and control participants ().
Table 1. Means and standard deviations (in parentheses) for N170 latencies separate for power condition and target stimuli
Accuracy
The categorization task was designed to be very simple and, as expected, classification accuracy was very high for both faces (M = .96, SD = .06) and objects (M = .96, SD = .08), and accuracy rates did not significantly differ as a function of target stimulus, F(1,149) = 0.48, p = .490, ηp2 = .003. Performance accuracy on this task did also not vary by power condition, F(2,149) = 0.47, p = .629, ηp2 = .006; and the Power Condition X Target Stimulus interaction effect was also not significant, F(2,149) = 1.09, p = .341, ηp2 = .014.
Subjective feelings
An ANOVA on subjective power feelings indicated a significant effect of power condition, F(2,149) = 3.46, p = .034, ηp2 = .04.Footnote3 The high-power group reported significantly stronger feelings of power (M = 3.13, SD = 0.61) than both the control group (M = 2.89, SD = 0.56), t(149) = 2.00, p = .047, d = .33, 95% CI [.004, .47], and the low-power group (M = 2.82, SD = 0.62), t(149) = 2.51, p = .013, d = .41, 95% CI [.07, .55]. The low-power group did not differ significantly from the control group, t(149) = 0.58, p = .561, d = .10, 95% CI [−.16, .30]. This pattern confirmed that the manipulation affected feelings of power among participants in the high power relative to low power condition. Control participants, who did not receive a power manipulation, reported explicit feelings more similar to low power participants, although their neural responses (which should not necessarily match explicit reports) were more similar to high power participants.
The power manipulation did not affect participants’ reports of comfort, F(2,149) = 1.29, p = .279, ηp2 = .02, or pain, F(2,148) = 1.31, p = .272, ηp2 = .02 (one data point missing), during their pose. The power manipulation effect on mood was also not significant, F(2,149) = 0.16, p = .857, ηp2 < .01.
Personality questionnaires
Exploratory differences between power conditions emerged for measures of emotional stability, F(2,149) = 3.31, p = .039, ηp2 = .04, BF10 = 1.07, and social reassurance, F(2,149) = 4.34, p = .015, ηp2 < .01, BF10 = 2.58. For all other measures, p > .053, BF10 < 0.84. Importantly, the Power x Target interaction effect on N170 amplitudes remained significant when controlling for emotional stability and social reassurance, F(2,146) = 4.24, p = .016, ηp2 = .06, and simple effects analyses showed that high-power participants had larger N170 responses to faces than low-power participants, t(146) = 2.63, p = .009, d = .44, 95% CI [0.55, 3.81]. The control group was marginally different from the low-power group, t(146) = 1.93, p = .056, d = .32, 95% CI [−0.04, 3.06], but not significantly different from the high-power group, t(146) = 0.81, p = .417, d = .13, 95% CI [−2.29, 0.954].
Discussion
Study 1 examined whether one’s experience of high as opposed to low power influences the visual processing of a face using an N170 index of configural encoding. We found that participants who imagined being in a position of low power exhibited smaller N170 responses to faces compared with those who imagined having high power. Control condition participants’ N170 responses did not differ significantly from those of high power participants, but were larger than low power participants (although this significant difference should be interpreted in the context of an inconclusive Bayesian analysis). Together, these results suggest an effect of power on face perception, such that low power appears to impair configural processing – an effect that was not evident in the perception of objects.
Although Study 1 represents the first direct test of power effects on the neural encoding of faces, these results are consistent with prior research on the perception of nonsocial objects, in which low power was associated with reduced configural encoding (Guinote, Citation2007; Smith & Trope, Citation2006). Furthermore, they replicate a previous observation of greater N170 responses to faces among high power than low power individuals (Schmid & Amodio, Citation2017), which bolsters confidence in this result in light of Bayesian results. By including a control group, this study revealed that the effect of power was driven by the low-power condition. Given the predominant emphasis on the influence of powerfulness rather than powerlessness on social outcomes (Schaerer et al., Citation2016), our finding of a directional effect of powerlessness is novel in itself and demonstrates an important direction for subsequent studies on levels of power. These findings provide initial evidence that low power affects may impede early socio-perceptual processing – a pattern that we then aimed to replicate and extend in Study 2.
In Study 1, we also assessed participants’ self-reported feelings of power. We found that participants in the high-power condition reported increased feelings of power, whereas participants in the low-power and control conditions did not differ in their self-reports. This pattern differed from the effect of power on the N170 response, suggesting that such manipulations may have different effects on participants’ subjective feelings and perceptual processing. Indeed, this manipulation of power likely affected a range of related psychological processes, including subjective experience and power-related cognitive processes, and suggests that while a questionnaire may pick up on subjective appraisals, other aspects of manipulated power may have driven effects on perception and behavior observed in Study 1 (Huang et al., Citation2011). Because different manipulations may activate somewhat different aspects of power and have their own strengths and limitations, an additional goal of Study 2 was to use an alternative manipulation of power and determine whether it produces convergent results.
Study 2
Social perception involves not just the detection of a face, but also the encoding of the features associated with a person’s unique identity. Therefore, Study 2 focused on second-order configurations (i.e., the processing of distances between eyes, nose, and mouth, which are relevant for the recognition of facial identity) using a technique known to disrupt second-order configural processing – the face inversion method (Farah et al., Citation1995; Leder & Bruce, Citation2000). Whereas the processing of upright faces typically relies primarily on configural processing (Leder & Bruce, Citation2000), the inversion of a face selectively impedes both first-order and second-order configural processing and thus requires a perceiver to rely instead on featural encoding (Freire et al., Citation2000; Maurer et al., Citation2002).
Given the Study 1 finding that low power was specifically associated with impaired configural face encoding, we hypothesized in Study 2 that low power would be associated with worse recognition of upright faces (which relies on configural processing) but not inverted faces (which relies on featural processing). Moreover, by examining configural processing effects in the context of a recognition task in Study 2, we could begin to examine how the effect of low power on face processing relates to the individuation of specific people – an important next step toward understanding how power effects on early perceptual processes may influence social behavior.
Method
Participants
Sample size was determined using G*power, which indicated that for our 3 (Power, between-subjects) x 2 (Target, within-subjects) x 2 (Orientation, within-subjects) mixed-model design, 102 participants were needed for an estimated medium sized effect, setting α-error probability at .05, and power at .80. As in Study 1, we recruited additional participants until the end of the semester. The total sample included 142 undergraduate students (81% females; Meanage = 19.25, SDage = 1.49) who participated in exchange for partial course credit. Analysis began only after all data were collected.
Procedure
Following the power manipulation (high power vs. low power vs. control), participants were instructed to learn a series of faces and objects presented in upright or inverted orientations for a later recognition test. Following a short distractor task, participants completed the recognition test and then a set of questionnaires.
Power manipulation
Power was manipulated using a power mind-set priming procedure based on autobiographic recall (e.g., Galinsky et al., Citation2003). Participants wrote about a past situation in which they possessed power over another person (high-power condition), a past situation in which somebody else had power over them (low-power condition), or their previous day’s events (control condition).
Stimulus learning and recognition tests
Participants viewed 24 faces and 24 objects (i.e., houses, chairs), half upright and half inverted, presented in randomized order. Stimuli were prepared as in Study 1 (grayscale, with faces cropped as ovals). A trial consisted of the sequential presentation of a fixation cross (200 ms) and a target stimulus (3000 ms). Once a target stimulus has disappeared, the next trial began. Participants were instructed to learn these stimuli.
In the recognition test, the 48 target stimuli from the learning phase were presented along with 48 new face and object stimuli (96 stimuli in total) in randomized order. The orientations of old target stimuli were kept the same as in the learning phase; half of the new stimuli were presented upright and half inverted. Each trial began with the presentation of a fixation cross (200 ms), followed by the target stimulus (3000 ms). Participants’ task was to indicate whether the target stimulus was old (i.e., presented in the learning phase) or new (i.e., not presented before) via keypress.
From the recognition phase, we assessed participants’ performance by calculating A’ separately for upright and inverted faces and objects. A’ is a nonparametric index of sensitivity that ranges from 0 to 1, with 0.5 indicating chance performance. A’ was calculated with the Snodgrass et al. (Citation1985) formula: A’ = 1/2+[(pHit–pFA)×(1+ pHit–pFA)]/4pHit×(1–pFA), where Hit = hit rate, FA = false-alarm rate.
Distractor task
Between the learning phase and the recognition test, participants performed a short and engaging distractor task: the “gorilla experiment” test of selective attention (Simons & Chabris, Citation1999). In this 40 s video, people wearing black and white t-shirts pass basketballs to each other, and participants are instructed to count the number of passes made by people wearing white t-shirts. In the middle of the video, a person in a gorilla costume walks across the screen – an appearance often missed due to selective attention to the passes. At the end of the video, participants were asked to indicate the number of passes and whether or not they noticed the gorilla.
Manipulation check
Following past research, the effectiveness of the power manipulation was determined by coding participants’ expression of power-related feelings in the essays (e.g., Anderson & Galinsky, Citation2006; Galinsky et al., Citation2003; Schmid, Citation2018; Schmid et al., Citation2015). Specifically, two condition-blind coders rated participants’ essays on content expressing power (1 = low power, 4 = power-neutral, 7 = high power). Inter-rater reliability was high (r = .95) for the first 30 participants. Coding of subsequent participants was completed by a single coder.
Subjective feelings
At the experiment’s conclusion, participants reported their current power-related feelings, as in Study 1, and the same composite measure of felt power was computed (Cronbach’s α = .73). Participants also reported their current mood on a 7-point single-item scale (1 = very bad, 7 = very good).
Personality questionnaires
The same short set of additional questionnaires as in Study 1 was included at the very end of the experiment for reasons unrelated to the present study and is thus not discussed here.
Exclusions
Data from 11 participants were excluded from analyses; ten due to incomplete data (i.e., nonresponses in the recognition task) and one due to noncompliance (using cell phone during the experiment).
Results
As in Study 1, all tests were two-tailed and, because we only tested contrasts relevant to our theoretical hypotheses and did not conduct exploratory tests, there were no corrections for multiple comparisons. Bayesian analyses were again reported for the key analyses.
Manipulation check
The power manipulation was successful, as shown by the highly significant power condition effect on essay ratings, F(2,128) = 214.49, p < .001, ηp2 = .77. High-power participants expressed greater power (M = 5.86, SD = 0.82) than low-power participants (M = 2.12, SD = 0.97), t(128) = 23.55, p < .001, d = 4.16, and control participants (M = 3.71, SD = 0.73), t(128) = 15.68, p < .001, d = 2.77, and control participants expressed greater power than low-power participants, t(128) = 10.48, p < .001, d = 1.85.
Main analysis
Our central prediction was that low power would be associated with reduced configural processing, relative to high power. If the effect of power were specific to configural processing, as opposed to featural processing, then we would observe a difference between power groups in the recognition of upright but not inverted stimuli. To test this prediction, a 3 (Power Condition: low vs. high vs. control) x 2 (Target: faces vs. objects) x 2 (Orientation: upright vs. inverted) mixed-model ANOVA was conducted on sensitivity (A’).
All main effects were significant: on average, participants recognized objects (M = .81, SD = .12) better than faces (M = .75, SD = .13), F(1,128) = 39.06, p < .001, ηp2 = .23, and upright stimuli (M = .83, SD = .11) better than inverted stimuli (M = .73, SD = .14), F(1,128) = 110.02, p < .001, ηp2 = .46. Importantly, the main effect for power condition was significant, F(2,128) = 3.76, p = .026, ηp2 = .06, BF10 = 0.85. Simple effect analysis indicated that high-power participants recalled stimuli more accurately (M = .80, SD = .10) than low-power participants (M = .76, SD = .13), t(128) = 2.68, p = .008, d = 0.47, 95% CI [−.08, −.01], BF10 = 25.92. The control group fell in between (M = .77, SD = 0.12), not significantly different from the high-power group, t(128) = 1.74, p = .084, d = 0.31, 95% CI [−.004, .06], BF10 = 0.86, or low-power group, t(128) = 1.00, p = .320, d = 0.18, 95% CI [−.02, .05], BF10 = 0.22.
The ANOVA also revealed two interactions of interest. First, the Target x Orientation interaction, F(1,128) = 32.88, p < .001, ηp2 = .20, replicated prior work and validated our use of the inversion paradigm. Participants recognized upright faces (M = .82, SD = .11) and objects (M = .83, SD = .10) equally well, F(1,128) = 0.60, p = .440, ηp2 < .01, and both were recognized better than their inverted counterparts (faces: F(1,128) = 97.31, p < .001, ηp2 = .43; objects: F(1,128) = 21.99, p < .001, ηp2 = .15). The inversion effect was stronger for faces than for objects, such that recognition was more strongly impaired for inverted faces (M = .67, SD = .15) than inverted objects (M = .78, SD = .13), F(1,128) = 59.01, p < .001, ηp2 = .32. Indeed, in research (Farah et al., Citation1995; Yin, Citation1969) also showed the inversion effect tends to be weaker for objects than faces, presumably because configural information is not as consistently distinctive for most objects compared with faces.
Second, we observed a significant Power Condition x Orientation interaction, F(2,128) = 3.48, p = .034, ηp2 = .05. Conceptually replicating Study 1 results, power condition moderated the recognition of upright stimuli, F(2,128) = 5.25, p = .006, ηp2 = .08. Low-power participants were less accurate at recognizing upright stimuli (M = .79, SD = .13) than both high-power participants (M = .85, SD = .09), t(128) = 3.00, p = .003, d = 0.53, 95% CI [−.09, −.02] and control participants (M = .84, SD = .09), t(128) = 2.57, p = .011, d = 0.45, 95% CI [−.08, −.01]. High-power participants and control participants did not differ significantly, t(128) = 0.44, p = .658, d = 0.08, 95% CI [−.03, .04]. By contrast, recognition of inverted stimuli, which depended on featural but not configural processing, was only marginally affected by power condition, F(2,128) = 2.76, p = .067, ηp2 = .04. This pattern indicated that power selectively affected configural processing of both faces and objects.
Was the effect of power on configural processing pronounced for faces? Tests of the Power Condition x Target interaction, F(2,128) = 0.62, p = .540, ηp2 = .01, and the Power Condition x Target x Orientation interaction, F(2,128) = 1.33, p = .269, ηp2 = .02, suggested it was not: both were nonsignificant, consistent with a domain-general account of power effects on configural encoding.
Given our specific interest in social perception, however, we further examined effects of power and orientation separately for faces and objects. For faces, the Power Condition x Orientation interaction was marginally significant, F(2,128) = 2.90, p = .059, ηp2 = .04, BF10 = 1.04 (, Panel A). The simple effect of power on recognition of upright faces was significant, F(2,128) = 3.77, p = .026, ηp2 = .06, BF10 = 1.67, and although the Bayesian analysis suggested inconclusive evidence, the pattern was consistent with our hypotheses and prior findings: When faces were presented upright, permitting configural encoding, low-power participants recognized them less accurately (M = .78, SD = .14) than both high-power participants (M = .84, SD = .10), t(128) = 2.37, p = .019, d = 0.42, 95% CI [−.10, −.01], BF10 = 1.50, and control participants (M = .84, SD = .07), t(128) = 2.39, p = .018, d = 0.42, 95% CI [−.10, −.01], BF10 = 2.34; high-power and control participants did not differ, t(128) = 0.02, p = .982, d < 0.01, 95% CI [−.05, .05], BF10 = 0.22. When faces were inverted, the power effect was not significant, F(2,128) = 1.14, p = .323, ηp2 = .02, BF10 = 0.19. For objects, the Power Condition x Orientation was not significant, F(2,128) = 1.52, p = .223, ηp2 = .02, BF10 = 0.28 (, Panel B).
Figure 3. Accuracy rates on the face recognition (panel A) and object recognition (panel B) as a function of participant power and stimulus orientation. Error bars represent 95% CI intervals
Subjective feelings
The power manipulation did not significantly affect explicit self-report measures of power feelings (i.e., the composite of the ten items), F(2,128) = 1.44, p = .240, ηp2 = .02Footnote4 , nor participants’ mood, F(2,128) = 2.24, p = .110, ηp2 = .03.
Personality questionnaires
Power conditions differed in terms of how “ashamed” they felt, F(2,128) = 3.59, p = .031, ηp2 = .05, BF10 = 1.46. For all other measures, p > .083 and BF10 < 0.61. The Power X Orientation interaction effect on recognition accuracy remained significant when controlling for how ashamed participants felt, F(2,127) = 3.09, p = .049, ηp2 = .05, and simple effects analyses confirmed that low-power participants were less accurate at recognizing upright stimuli than both high-power participants, t(127) = 3.11, p = .002, d = 0.53, 95% CI [−.09, −.02], and control participants, t(127) = 2.18, p = .031, d = 0.45, 95% CI [−.07, −.004]. High-power participants and control participants did not differ significantly, t(127) = 0.98, p = .327, d = 0.08, 95% CI [−.02, .05]. For the recognition of inverted stimuli, we observed better recognition among the high-power group than control group, t(127) = 2.51, p = .013, d = 0.08, 95% CI [.01, 0.11], but no significant differences between the high-power group and the low-power group t(127) = 1.80, p = .074, d = 0.08, 95% CI [−.004, .09] or between the low-power group and the control group, t(127) = 0.71, p = .476, d = 0.08, 95% CI [−.06, .03].
Discussion
Study 2 extended our analysis of power effects on face processing to examine different components of face processing. Here, we tested whether relative power influenced the encoding of second-order face configurations, concerning distances between facial features unique to a person’s identity, using the face inversion paradigm. Results revealed that low power decreased the recognition of upright faces (which depends primarily on configural processing; Leder & Bruce, Citation2000) relative to high power and neutral power, whereas recognition of inverted faces (which depends primarily on featural processing) was not affected by power condition. This pattern suggests that low power impeded the processing of second-order configurations, consistent with its effects on first-order configural processing observed in Study 1, but did not alter the featural processing of faces. Bayesian analyses provided further evidence for a null effect of power on inverted faces, while effects for upright faces were inconclusive. Thus, these results demonstrate that power did not affect featural face processing. At the same time, these results provide converging evidence for the hypothesis that low power may interfere with the early configural processing of faces.
It is notable that power condition did not differentially affect the configural processing of faces and objects. When considered alongside prior research showing that power (high vs. low) modulates the global processing of objects (Guinote, Citation2007; Smith & Trope, Citation2006), our findings are consistent with a domain-general account of power condition effects on configural processing. It is notable, however, that the effect was numerically stronger for faces, a difference likely due to the more consistent and distinctive configuration of faces compared with that of objects used in this study (e.g., Freire et al., Citation2000; Yin, Citation1969). Importantly, for the present research, these results show that the effect of high versus low power on configural processing observed toward objects in prior research also affects the encoding of faces, thus demonstrating its relevance to social processes.
General discussion
The experience of high power has been shown to influence a range of social processes, often to the detriment of social relations (Fiske, Citation1993; Keltner et al., Citation2003). Yet high power is also associated with a perceptual encoding style – greater configural processing – which, we proposed, should promote the visual encoding of social agents. In two experiments, we found that manipulated power did indeed influence the early processing of faces; specifically, low power was associated with decreased configural face encoding, both in terms of first-order configural processing, indicated by reduced N170 responses in Study 1, and second-order configural processing, indicated by decreased recognition accuracy of upright faces within the face inversion paradigm in Study 2, relative to high power and control conditions. By contrast, the manipulation of power did not significantly influence the recognition of inverted faces (Study 2), suggesting that power effects did not pertain to featural processing but were specific to configural encoding. Together, these findings suggest that low power influences the configural encoding of faces – the perceptual process through which an object is determined to be a fellow human (i.e., first-order configural processing) and unique individual (i.e., second-order configural processing) – such that these processes are relatively impeded among low-power individuals.
How do these results comport with existing theories of power? Our results are consistent with the social distance theory (Magee & Smith, Citation2013), as they show that power fosters abstract and integrative information processing, which includes global visual processing of information. Our results extend these findings to the domain of social perception. By contrast, our results appear inconsistent with another aspect of the social distance theory that highlights more social effects of power, such as social distancing (Magee & Smith, Citation2013) and a reduction in social engagement, individuation, and pro-sociality, relative to low power (see also Fiske, Citation1993; Keltner et al., Citation2003). Thus, our results are consistent with prior theories regarding the cognitive-perceptual effects of power, rather than those focused on socio-motivational effects of power. These findings suggest a new opportunity to examine the relation between perceptual and socio-motivational effects of power, which may vary according to person’s goals and the social situation.
Can the low-power effects be explained by inattention to faces (e.g., gaze aversion away from faces)? Our data cannot provide a direct answer to this question. However, it is notable that participants in the three power conditions performed similarly well on inverted face trials. Thus, if effects were due to inattention in low-power subjects, then they would not have been specific to upright presented faces. Moreover, past research has shown that individuals are better at recognizing faces of high-status than low-status people (Ratcliff et al., Citation2011) and it has been theorized that low-power people are more attentive to other people than high-power people because low-power people are more dependent on others (Keltner et al., Citation2003). This suggests that inattention and gaze aversion are unlikely explanations for the effects. However, it is possible that an impairment in face encoding among low-power individuals may relate to a particular pattern of social engagement that is not necessarily antisocial. By definition, low-power individuals are dependent on other people, which may lead them to be hyper vigilant to potential social and nonsocial threats (Keltner et al., Citation2003). It is thus possible that the results we observed – reduced face processing in low-power individuals – pertains to low-threat situations; this pattern could potentially be reversed in situations of high social threat (Ofan et al., Citation2014). Similarly, the enhanced encoding of a face in the visual system does not imply that one’s judgments and behaviors toward the person will necessarily be prosocial; indeed, the opposite could be true – the exertion of social power requires one to skillfully identify social targets. These considerations may lead to new predictions regarding the interplay of perceptual and cognitive processes and the influence of (low) power on social judgments and behaviors via perceptual pathways.
A second major contribution of this research is the demonstration that power effects on perception occur rapidly – in less than 200 milliseconds. This pattern, observed in Study 1, suggests an automatic effect of power on face processing that is likely undetectable to the perceiver and may thus influence subsequent judgments and behaviors without a perceiver’s ability to intervene. Although we did not examine social judgments in the present research, Study 2 revealed that low power was associated with impaired recognition of individuals’ faces. In prior research, subtle effects of power on the N170 response were associated with expressions of implicit prejudice (Schmid & Amodio, Citation2017). Both effects could be detrimental to social judgments and relationships, and to the extent they arise from biases in face encoding, they may be difficult to avoid. Our findings highlight the need for new research on the mechanisms and strategies that may be effective for preventing unintended perceptual effects of power and powerlessness, such as proactive control approaches (Amodio & Swencionis, Citation2018).
Conclusion
Power differences are ubiquitous in social relationships, influencing how we judge and act toward others. Here, we showed that power also affects the very starting point of many social interactions – the initial visual encoding of a stimulus as a face. These findings provide new evidence that power affects perceptual processes in social behavior, and they suggest a broadened theoretical view in which power influences visual components of social perception in addition to high-level judgments and behaviors.
Disclosure of interest
The authors report no conflict of interest.
Additional information
Funding
Notes
1 When we began data collection in 2014, our goal was to include at least 30 participants with clean data per condition, following acceptable practices at that time. We stopped data collection after 105 participants. The power by target interaction effect was already significant at this point. However, while analyzing and preparing our manuscript, standards for sample sizes changed. In order to meet these new standards, we decided to recruit additional participants in 2017 on the basis of a power analysis. The EEG recording setup was identical and the new participants were distributed equally across the conditions.
2 The choice of filter settings is intended to increase signal-to-noise in an ERP score by removing artifact (e.g., frequencies that either distort or obscure a signal of interest). The filter setting used here is consistent with prior research focusing on N170, which captured the typical frequency range of the N170 (5-10 Hz) while reducing potential low and high frequency artifact (e.g., Amihai et al., Citation2011; Ofan et al., Citation2011, Citation2014; Ratner & Amodio, Citation2013; Sagiv & Bentin, Citation2006; Schmid & Amodio, Citation2017). It is notable, however, that wider filter settings are often recommended when a researcher is interested in a variety of ERP components or absolute amplitude values (Luck, Citation2014), and that more narrow filters could influence baseline values and alter waveform shape, potentially distorting them (Acunzo et al., Citation2012). Because our interest was not in absolute amplitudes, but in relative amplitudes between experimental conditions, and our analysis concerned only the N170, this potential distortion of baseline amplitude is unlikely to affect our main results and conclusions. However, to address potential concerns about the effects of these filters (e.g., Acunzo et al., Citation2012), we present plots comparing waveforms representing a 1-15 Hz bandpass filter with a 30Hz lowpass filter in the Supplementary materials.
3 Participants indicated their feelings on four more items that have not been used in the prior research, accountable, responsible, in authority, and in charge. However, according to participants’ feedback, these items were ambiguous in that it was unclear whether they referred to how one feels about others, how others may feel about oneself, or whether they concern the experimental setting and we decided to not include them in the composite measure of felt power. When adding these four items to the composite measure, the power condition effect on felt power was marginal, F(2,149) = 2.78, p = .065, ηp2 = .04; high-power participants felt significantly more powerful (M = 2.99, SD = 0.61) than the control group (M = 2.74, SD = 0.48), t(149) = 2.30, p = .023, 95% CI [.04, .48], and also somewhat more powerful than low-power participants (M = 2.80, SD = 0.61), t(149) = 1.71, p = .090, 95% CI [−.42, .03]. The low-power group did not significantly differ from the control group, t(149) = 0.55, p = .581, 95% CI [−.16, .28].
4 As in Study 1, we also included accountable, responsible, in authority, and in charge as measures of power-related feelings, but did not include them in the composite measure of felt power. When analyzing all fourteen power-related items in a new composite measure, the power condition effect was also not significant, F(2,128) = 1.74, p = .180, ηp2 = .03.
References
- Acunzo, D. J., MacKenzie, G., & Van Rossum, M. C. W. (2012). Systematic biases in early ERP and ERF components as a result of high-pass filtering. Journal of Neuroscience Methods, 209(1), 212–218. https://doi.org/10.1016/j.jneumeth.2012.06.011
- Amihai, I., Deouell, L. Y., & Bentin, S. (2011). Neural adaptation is related to face repetition irrespective of identity: A reappraisal of the N170 effect. Experimental Brain Research, 209(2), 193–204. https://doi.org/10.1007/s00221-011-2546-x
- Amodio, D. M., & Swencionis, J. K. (2018). Proactive control of implicit bias: A theoretical model and implications for behavior change. Journal of Personality and Social Psychology, 115, 255–275. https://doi.org/10.1037/pspi0000128
- Anderson, C., & Galinsky, A. D. (2006). Power, optimism, and risk-taking. European Journal of Social Psychology, 36(4), 511–536. https://doi.org/10.1002/ejsp.324
- Bentin, S., Allison, T., Puce, A., Perez, E., & McCarthy, G. (1996). Electrophysiological studies of face perception in humans. Journal of Cognitive Neuroscience, 8(6), 551–565. https://doi.org/10.1162/jocn.1996.8.6.551
- Bentin, S., & Deouell, L. Y. (2000). Structural encoding and identification in face processing: ERP evidence for separate mechanisms. Cognitive Neuropsychology, 17(1–3), 35–54. https://doi.org/10.1080/026432900380472
- Caldara, R., Thut, G., Servoir, P., Michel, C. M., Bovet, P., & Renault, B. (2003). Face versus non-face object perception and the ‘other-race’ effect: A spatio-temporal event-related potential study. Clinical Neurophysiology, 114(3), 515–528. https://doi.org/10.1016/S1388-2457(02)00407-8
- Carver, C. S., & White, T. L. (1994). Behavioral inhibition, behavioral activation, and affective reponses to impending reward and punishment: The BIS/BAS scales. Journal of Personality and Social Psychology, 67, 319–333. https://doi.org/10.1037/0022-3514.67.2.319
- Cesario, J., & McDonald, M. M. (2013). Bodies in context: Power poses as a computation of action possibility. Social Cognition, 31(2), 260–274. https://doi.org/10.1521/soco.2013.31.2.260
- Clark, M. S., & Mills, J. R. (2001). A theory of communal (and exchange) relationships. In A. W. Lange & E. T. Higgins (Eds.), Handbook of theories of social psychology. Sage.
- Côté, S., Kraus, M. W., Cheng, B. H., Oveis, C., Van Der Loewe, I., Lian, H., & Keltner, D. (2011). Social power facilitates the effect of prosocial orientation on empathic accuracy. Journal of Personality and Social Psychology, 101, 217–232. https://doi.org/10.1037/a0023171
- Dubois, D., Rucker, D. D., & Galinsky, A. D. (2010). The accentuation bias: Money literally looms larger (and sometimes smaller) to the powerless. Social Psychological and Personality Science, 1(3), 199–205. https://doi.org/10.1177/1948550610365170
- Eimer, M. (2000). Event-related brain potentials distinguish processing stages involved in face perception and recognition. Clinical Neurophysiology, 111(4), 694–705. https://doi.org/10.1016/S1388-2457(99)00285-0
- Farah, M. J., Tanaka, J. W., & Drain, H. M. (1995). What causes the face inversion effect? Journal of Experimental Psychology. Human Perception and Performance, 21, 628–634. https://doi.org/10.1037/0096-1523.21.3.628
- Faul, F., Erdfelder, E., Lang, A. G., & Buchner, A. (2007). G*Power 3: A flexible statistical power analysis program fort he social, behavioral, and biomedical sciences. Behavior Research Methods, 39(2), 175–191. https://doi.org/10.3758/BF03193146
- Fincher, K. M., & Tetlock, P. E. (2016). Perceptual dehumanization of faces is activated by norm violations and facilitates norm enforcement. Journal of Experimental Psychology. General, 145, 131–146. https://doi.org/10.1037/xge0000132
- Fiske, S. T. (1993). Controlling other people: The impact of power on stereotyping. American Psychologist, 48, 621–628. https://doi.org/10.1037/0003-066X.48.6.621
- Freire, A., Lee, K., & Symons, L. A. (2000). The face-inversion effect as a deficit in the encoding of configural information: Direct evidence. Perception, 29(2), 159–170. https://doi.org/10.1068/p3012
- Galinsky, A. D., Gruenfeld, D. H., & Magee, J. C. (2003). From power to action. Journal of Personality and Social Psychology, 85, 453–466. https://doi.org/10.1037/0022-3514.85.3.453
- Galinsky, A. D., Magee, J. C., Inesi, M. E., & Gruenfeld, D. H. (2006). Power and perspectives not taken. Psychological Science, 17(12), 1068–1074. https://doi.org/10.1111/j.1467-9280.2006.01824.x
- Goodwin, S. A., Gubin, A., Fiske, S. T., & Yzerbyt, V. Y. (2000). Power can bias impression processes: Stereotyping subodinates by default and by design. Group Processes & Intergroup Relations, 3, 227–256. https://doi.org/10.1177/1368430200003003001
- Gosling, S. D., Rentfrow, P. J., & Swann, W. B. J. (2003). A very brief measure of the big five personality domains. Journal of Research in Personality, 37(6), 504–528. https://doi.org/10.1016/S0092-6566(03)00046-1
- Guinote, A. (2007). Power affects basic cognition: Increased attentional inhibition and flexibility. Journal of Experimental Social Psychology, 43(5), 685–697. https://doi.org/10.1016/j.jesp.2006.06.008
- Guinote, A. (2017). How power affects people: Activating, wanting, and goal seeking. Annual Review of Psychology, 68(1), 353–381. https://doi.org/10.1146/annurev-psych-010416-044153
- Guinote, A., Willis, G. B., & Martellotta, C. (2010). Social power increases implicit prejudice. Journal of Experimental Social Psychology, 46(2), 299–307. https://doi.org/10.1016/j.jesp.2009.11.012
- Herrmann, M. J., Ehlis, A.-C., Muehlberger, A., & Fallgatter, A. J. (2005). Source localization of early stages of face processing. Brain Topography, 18(2), 77–85. https://doi.org/10.1007/s10548-005-0277-7
- Horovitz, S. G., Rossion, B., Skudlarski, P., & Gore, J. C. (2004). Parametric design and correlational analyses help integrating fMRI and electrophysiological data during face processing. NeuroImage, 22(4), 1587–1595. https://doi.org/10.1016/j.neuroimage.2004.04.018
- Huang, L., Galinsky, A. D., Gruenfeld, D. H., & Guillory, L. E. (2011). Powerful postures versus powerful roles: Which is the proximate correlate of thought and behavior? Psychological Science, 22(1), 95–102. https://doi.org/10.1177/0956797610391912
- Hugenberg, K., Young, S., Rydell, R. J., Almaraz, S., Stanko, K. A., See, P. E., & Wilson, J. P. (2015). The face of humanity: Configural face processing influences ascriptions of humanness. Social Psychological and Personality Science, 7, 167–175. https://doi.org/10.1177/1948550615609734
- Ince, R. A. A., Jaworska, K., Gross, J., Panzeri, S., Van Rijsbegren, N. J., Rousselet, G. A., & Schyns, P. G. (2016). The deceptively simple N170 reflects network information processing mechanisms involving visual feature coding and transfer across hemispheres. Cerebral Cortex, 26, 4123–4135. https://doi.org/10.1093/cercor/bhw196
- Jacques, C., & Rossion, B. (2007). Early electrophysiological responses to multiple face orientations correlate with individual discrimination performance in humans. NeuroImage, 36(3), 863–876. https://doi.org/10.1016/j.neuroimage.2007.04.016
- Jeffreys, H. (1961). The theory of probability (3 ed.). Oxford University Press.
- Kass, R. E., & Raftery, A. E. (1995). Bayes factors. Journal of the American Statistical Association, 90(430), 773–795. https://doi.org/10.1080/01621459.1995.10476572
- Keltner, D., Gruenfeld, D. H., & Anderson, A. (2003). Power, approach, and inhibition. Psychological Review, 110, 265–284. https://doi.org/10.1037/0033-295X.110.2.265
- Kolassa, I.-T. I.-T., & Miltner, W. H. R. (2006). Psychophysiological correlates of face processing in social phobia. Brain Research, 1118(1), 130–141. https://doi.org/10.1016/j.brainres.2006.08.019
- Krosch, A. R., & Amodio, D. M. (2019). Scarcity disrupts the neural encoding of Black faces: A socioperceptual pathway to discrimination. Journal of Personality and Social Psychology, 117, 859–875. https://doi.org/10.1037/pspa0000168
- Lammers, J., & Stapel, D. A. (2011). Power increases dehumanization. Group Processes & Intergroup Relations, 14(1), 113–126. https://doi.org/10.1177/1368430210370042
- Leder, H., & Bruce, V. (1998). Local and relational aspects of face distinctiveness. Quarterly Journal of Experimental Psychology, 51, 449–473. https://doi.org/10.1080/713755777
- Leder, H., & Bruce, V. (2000). When inverted faces are recognized: The role of configural information in face recognition. The Quarterly Journal of Experimental Psychology, 53, 513–536. https://doi.org/10.1080/713755889
- Lee, R. M., & Robbins, S. B. (1995). Measuring belongingness: The social connectedness and the social assurance scales. Journal of Counseling Psychology, 42, 232–241. https://doi.org/10.1037/0022-0167.42.2.232
- Lobmaier, J. S., Klaver, P., Loenneker, T., Martin, E., & Mast, F. W. (2008). Featural and configural face processing strategies: Evidence from a functional magnetic resonance imaging study. NeuroReport, 19(3), 287–291. https://doi.org/10.1097/WNR.0b013e3282f556fe
- Luck, S. J. (2014). An introduction to the event-related potential technique. MIT Press.
- Magee, J. C., & Galinsky, A. D. (2008). Social hierarchy: The self‐reinforcing nature of power and status. The Academy of Management Annals, 2, 351–398. https://doi.org/10.1080/19416520802211628
- Magee, J. C., & Smith, P. K. (2013). The social distance theory of power. Personality and Social Psychology Review, 17, 158–186. https://doi.org/10.1177/1088868312472732
- Maurer, D., Le Grand, R., & Mondloch, C. J. (2002). The many faces of configural processing. Trends in Cognitive Sciences, 6, 255–260. https://doi.org/10.1016/S1364-6613(02)01903-4
- Mercure, E., Dick, F., & Johnson, M. H. (2008). Featural and configural face processing differentially modulate ERP components. Brain Research, 1239, 162–170. https://doi.org/10.1016/j.brainres.2008.07.098
- Minear, M., & Park, D. C. (2004). A lifespan database of adult facial stimuli. Behavior Research Methods, Instruments and Computers, 36(4), 630–633. https://doi.org/10.3758/BF03206543
- Mondloch, C. J., Le Grand, R., & Maurer, D. (2002). Configural face processing develops more slowly than featural face processing. Perception, 31(5), 553–566. https://doi.org/10.1068/p3339
- Navon, D. (1977). Forest before trees: The precedence of global features in visual perception. Cognitive Psychology, 9(3), 353–383. https://doi.org/10.1016/0010-0285(77)90012-3
- Nguyen, V. T., & Cunnington, R. (2014). The superior temporal sulcus and the N170 during face processing: Single trial analysis of concurrent EEG–fMRI. NeuroImage, 86, 492–502. https://doi.org/10.1016/j.neuroimage.2013.10.047
- Ofan, R. H., Rubin, N., & Amodio, D. M. (2011). Seeing race: N170 responses to race and their relation to automatic racial attitudes and controlled processing. Journal of Cognitive Neuroscience, 23(10), 3152–3161. https://doi.org/10.1162/jocn_a_00014
- Ofan, R. H., Rubin, N., & Amodio, D. M. (2014). Situation-based social anxiety enhances the neural processing of faces: Evidence from an intergroup context. Social Cognitive and Affective Neuroscience, 9(8), 1055–1061. https://doi.org/10.1093/scan/nst087
- Overbeck, J. R., & Park, B. (2001). When power does not corrupt: Superior individuation processes among powerful perceivers. Journal of Personality and Social Psychology, 81, 549–565. https://doi.org/10.1037/0022-3514.81.4.549
- Overbeck, J. R., & Park, B. (2006). Powerful perceivers, powerless objects: Flexibility of powerholders’ social attention. Organizational Behavior and Human Decision Processes, 99(2), 227–243. https://doi.org/10.1016/j.obhdp.2005.10.003
- Ratcliff, N. J., Hugenberg, K., Shriver, E. R., & Bernstein, M. J. (2011). The allure of status: High-status targets are privileged in face processing and memory. Personality & Social Psychology Bulletin, 37, 1003–1015. https://doi.org/10.1177/0146167211407210
- Ratner, K. G., & Amodio, D. M. (2013). Seeing “us” vs. “them”: Minimal group effects on the neural encoding of faces. Journal of Experimental Social Psychology, 49, 298–301. https://doi.org/10.1016/j.jesp.2012.10.017
- Richeson, J. A., & Ambady, N. (2003). Effects of situational power on automatic and racial prejudice. Journal of Experimental Social Psychology, 39, 177–183. https://doi.org/10.1016/S0022-1031(02)00521-8
- Rossion, B., & Jacques, C. (2012). The N170: Understanding the time course of face perception in the human brain. In S. J. Luck & E. S. Kappenman (Eds.), The Oxford handbook of event-related potential components (pp. 115–141). Oxford University Press.
- Rossion, B. (2014). Understanding face perception by means of human electrophysiology. Trends in Cognitive Sciences, 18(6), 310–318. https://doi.org/10.1016/j.tics.2014.02.013
- Rossion, B., Delvenne, J.-F., Debatisse, D., Goffaux, V., Bruyer, R., Crommelinck, M., & Guertit, J.-M. (1999). Spatio-temporal localization of the face inversion effect: An event-related potentials study. Biological Psychology, 50(3), 173–189. https://doi.org/10.1016/S0301-0511(99)00013-7
- Sadeh, B., Podlipsky, I., Zhdanov, A., & Yovel, G. (2010). Event-related potential and functional MRI measures of face-selectivity are highly correlated: A simultaneous ERP-fMRI investigation. Human Brain Mapping, 31(10), 1490–1501. https://doi.org/10.1002/hbm.20952
- Sagiv, N., & Bentin, S. (2006). Structural encoding of human and schematic faces: Holistic and part-based processes. Journal of Cognitive Neuroscience, 13(7), 937–951. https://doi.org/10.1162/089892901753165854
- Schaerer, M., Du Plessis, C., Yap, A. J., & Thau, S. (2016). Psychological science’s preoccupation with the powerful. Paper presented at the Academy of Management Proceedings.
- Schmid, P. C. (2018). Less power, greater conflict: Low power increases the experience of conflict in multiple goal settings. Social Psychology, 49(1), 47–62. https://doi.org/10.1027/1864-9335/a000327
- Schmid, P. C., & Amodio, D. M. (2017). Power effects on implicit prejudice and stereotyping: The role of ingroup vs. outgroup face processing. Social Neuroscience, 12(2), 218–231. https://doi.org/10.1080/17470919.2016.1144647
- Schmid, P. C., Hackel, L., & Amodio, D. M. (2018). Power enhances instrumental learning: Effects on feedback-based reinforcement in behavior and the brain. Motivation Science, 4, 206–226. https://doi.org/10.1037/mot0000088
- Schmid, P. C., Kleiman, T., & Amodio, D. M. (2015). Power effects on cognitive control: Turning conflict into action. Journal of Experimental Psychology: General, 144(3), 655–663. https://doi.org/10.1037/xge0000068
- Semlitsch, H., Anderer, P., Schuster, P., & Presslich, O. (1986). A solution for reliable and valid reduction of ocular artifacts applied to the P300 ERP. Psychophysiology, 23(6), 695–703. https://doi.org/10.1111/j.1469-8986.1986.tb00696.x
- Senholzi, K. B., & Ito, T. A. (2013). Structural face encoding: How task affects the N170’s sensitivity to race. Social Cognitive and Affective Neuroscience, 8, 937–942. https://doi.org/10.1093/scan/nss091
- Simons, D. J., & Chabris, C. F. (1999). Gorillas in our midst: Sustained inattention blindness for dynamic events. Perception, 28, 1059–1074. https://doi.org/10.1068/p2952
- Smith, P. K., & Trope, Y. (2006). You focus on the forest when you’re in charge of the trees: Power priming and abstract information processing. Journal of Personality and Social Psychology, 90, 578–596. https://doi.org/10.1037/0022-3514.90.4.578
- Snodgrass, J. G., Levy-Berger, G., & Haydon, M. (1985). Human experimental psychology. Oxford University Press.
- Tanaka, J. W., & Farah, M. J. (1993). Parts and wholes in face recognition. Quarterly Journal of Experimental Psychology, 46(2), 225–245. https://doi.org/10.1080/14640749308401045
- Tanaka, J. W., & Sengco, J. A. (1997). Features and their configuration in face recognition. Memory & Cognition, 25(5), 583–592. https://doi.org/10.3758/BF03211301
- Van Kleef, G. A., Oveis, C., Van Der Loewe, I., LuoKogan, A., Goetz, J., & Keltner, D. (2008). Power, distress, and compassion: Turning a blind eye to the suffering of others. Psychological Science, 19, 1315–1322. https://doi.org/10.1111/j.1467-9280.2008.02241.x
- Wang, R., Li, J., Fang, H., Tian, M., & Liu, J. (2012). Individual differences in holistic processing predict face recognition ability. Psychological Science, 23(2), 169–177. https://doi.org/10.1177/0956797611420575
- Yin, R. K. (1969). Looking at upside-down faces. Journal of Experimental Psychology, 81(1), 141–145. https://doi.org/10.1037/h0027474