Abstract
This article presents a medium resolution land use data set (5 arc min, c. 10 × 10 km) for the year 2000 that reproduces national land use statistics for cropland and forestry at the country level. We distinguish five land use classes displayed as percent-per-gridcell layers: cropland, grazing, forestry, urban and infrastructure areas, and areas without land use. For each gridcell, the sum of these five layers is 100%; that is, the Earth's total land area is allocated to these five classes. Spatial patterns are derived from available thematic maps and reconciled with national extents from census data. Statistical comparisons of the resulting maps with MODIS and CORINE data demonstrate the reliability of our data set; remaining discrepancies can be largely explained by the conceptual difference between land use and land cover. The data set presented here is aimed to support the systematic integration of socio-economic and ecological data in integrated analyses of the coupled global land system. The data set can be downloaded at http://www.iff.ac.at/socec/.
1. Introduction
Land use is a process at the interface of social and ecological systems. It is the sum of arrangements and activities aimed at harnessing ecosystem services, sometimes at the expense of other ecosystem services (Millenium Ecosystem Assessment, Citation2005). Land use is a pervasive factor contributing to global environmental change, and it is a major driver of land-cover change. By using the land, humans alter patterns and processes in ecosystems, including biodiversity, biogeochemical cycles, regional climate patterns, hydrological processes, landscape dynamics, and thereby affect the life-sustaining ability of the biosphere (Brovkin et al., Citation2004; Foley et al., Citation2005; McGuire et al., Citation2001; Sala et al., Citation2000; Steffen et al., Citation2004; Vitousek et al., Citation1997). Nearly half of the Earth's surface has so far been transformed by direct human action (Vitousek et al., Citation1997). Most of the high-quality land is already used for agriculture and depends on human nutrient and water management (Tilman et al., Citation2002; Young Citation1999). Only about one-fifth of the land surface was still largely untouched by human activities in the year 2000 (Sanderson et al., Citation2002).
Spatially explicit data are a prerequisite for assessing how human actions affect natural processes, and for better understanding the consequences of these actions for natural systems and eventually for society itself. These issues are high on the agenda of fields such as integrated land change research (GLP, Citation2005) and sustainability science (Clark et al., Citation2004; Kates et al., Citation2001). The integration of social and socio-economic data with ecological information is a major challenge of integrated land science, an innovative field aimed at improving our understanding of coupled socio-ecological systems (Lambin et al., Citation2006; Rindfuss et al., Citation2004). Land use data and models play a vital role in this context (Heistermann et al., Citation2006).
The necessity to better understand the links between human systems, drivers of change, changes in land use, and their ecological consequences (Turner et al., Citation1993), makes the availability of land use data desirable that are consistent with land use censuses (and can thus be linked to socio-economic data and models) and allocate the Earth's total land area in a double-counting free manner to broad classes of dominant land use (and can therefore be used for the assessment of processes that are driven simultaneously by socio-economic and natural factors). Yet, despite the plethora of data, statistics and spatially explicit information available to the scientific community, the integration of ecological and socio-economic data remains a major challenge, among others for the following four reasons.
-
Most spatially explicit data sets refer to land cover and not to land use. Within the past decade, spatially explicit data sets derived from remote sensing, such as the DISCover land cover data set (Loveland and Belward, Citation1997; Loveland et al., Citation2000), the Global Land Cover Characterization database (GLCC; Loveland et al., Citation2000), the moderate-resolution imaging spectroradiometer land cover product (herafter: MODIS; Friedl et al., Citation2002), or the Global Land Cover Map for the year 2000 (hereafter GLC2000; Joint Research Center Citation2002), have become available to the scientific community. These data refer to biophysical characteristics of the Earth's surface, such as the distribution of vegetation, water, ice, etc., that can be detected by remote sensing. These databases are indispensible for assessing the state of terrestrial ecosystems. However, the relation between land cover and land use is ambiguous and the possibility to infer land use information from land cover data is limited (Brown and Duh, Citation2003; Cihlar and Jansen, Citation2001). When added up to a national total, such land cover data sets differ substantially from national census data on land use, even for categories such as cropland and forests. Despite the fact that census land use statistics are also error-prone, especially in developing countries, census data are the basis for political decision making on land use and thus are regarded authoritative in socio-economic research, especially on the global scale (e.g. Ramankutty, Citation2004; Wood et al., Citation2000; WRI, Citation2004). International land use data sets such as the agricultural data sets provided by the Food and Agricultural Organization (FAO, Citation2004), national and supranational land use statistics by Eurostat Citation(2002) and the forest resource assessments of the FAO (FRA2000: FAO, Citation2001; FRA2005: FAO, Citation2006) and other UN organizations (TBFRA2000: UN, Citation2000), however, are typically only available for political entities and do not provide sufficient spatial detail. The divergence of spatially explicit data and national census data can be regarded as a major obstacle to the integration of socio-economic and ecological analyses.
-
There exists a wide range of—global and regional—land use maps which are aimed at overcoming the disparity of land use and land cover by combining remote sensing data and census data. Examples include the map on the global extent and pattern of cropland (Ramankutty and Foley, Citation1998, Citation1999) which reproduces cropland census statistics at the continental level and, in a new version on county level (Monfreda et al., forthcoming, Ramankutty et al., forthcoming), the geographical distribution of cultivars (Leff et al., Citation2004), maps on forestry (FAO, Citation1999; Greenpeace International, Citation2006), deforestation (Wood and Skole, Citation1998), grazing land (Kruska et al., Citation2003), or irrigation (Siebert et al., Citation2005a, Citation2005b). These maps are widely applied in assessments of human-induced changes in ecosystems, but they contain only information on a specific segment of land use and are thus not sufficiently comprehensive for many purposes. Creating a comprehensive land use map by merging thematic maps will almost inevitably create consistency problems. In particular, it is almost inevitable that the sum of all land use types per gridcell would deviate from 100% for most gridcells if such data sets were to be added up, thus hampering double-counting free data integration: Many environmentally relevant processes are represented as flows per unit area (e.g. g C/m2/yr) which are multiplied by area totals to calculate absolute amounts (g C/yr). Obviously, such methods require consistent and comprehensive data sets in order to yield correct results, despite the problems this may create in dealing with multiple uses of ecosystems (e.g. agroforestry, forest grazing) or multicropping (see below). Existing comprehensive land use maps are geographically restricted to regions with excellent census data availability (e.g. Hurtt et al., Citation2001; Kerr and Cihlar, Citation2003) or avoid the consistency problems at the expense of a coarse geographic resolution, such as the land use maps of the ‘History Database of the Global Environment’ (HYDE; Klein Goldewijk, Citation2001) that assigns one single land use type to each 0.5° gridcell (approximately 55 × 55 km at the equator).
-
In most readily available land use maps, settlement and infrastructure areas associated with agricultural production and forestry are omitted (e.g. Klein Goldewijk, Citation2001) or subsumed under other land use categories (e.g. Frolking et al., Citation2002; Hurtt et al., Citation2001; Ramankutty and Foley, Citation1999). Maps on built-up areas derived from remote sensing exist (e.g. Elvidge et al., Citation2001; FAO, Citation1997; Miteva, Citation2001; Small, Citation2004), but the data sets contain only information on urban areas or areas of high population densities and do not comprise small infrastructure units associated with agriculture or forestry, such as dwellings or small roads. This deficiency makes them less valuable in an integrated land use data set. Despite their small extent, settlement and infrastructure areas play a decisive role within the land use context, because this type of land use results in far-reaching alterations of ecosystem patterns and processes. Furthermore, use of land for settlement and infrastructure areas influences pattern and dynamics of other land uses (Lambin et al., Citation2001; Ramankutty et al., Citation2006). The lack of comprehensive data on settlement and infrastructure area hampers advancements in our understanding on the interrelation of human drivers of global environmental change and their ecological impacts.
-
There is a lack of reliable data on the extent and distribution of grazing land. This land use category is characterized by a very loose relation of land use and land cover, which renders the establishment of reliable data sets on basis of remote sensing particularly difficult: in contrast to forestry, which cannot happen in the absence of woody biomass, or cropland agriculture, which obviously requires fields and agricultural infrastructure (farms, roads, etc.), livestock grazing may occur in a wide range of ecosystems, natural and artificial grasslands as well as deserts, semi-deserts, scrublands and woodlands and forest-like savannah associations (Conant, Citation2002; Harris, Citation2000; Kimble et al., Citation2001; Lambin et al., Citation2001). This limits the applicability of remote sensing techniques in identifying grazing land. On the other hand, available census data are limited in scope and very heterogeneously defined. Since the distinction between artificial pastures and natural grasslands is not always clear and discrepancies in statistical reporting schemes are almost unavoidable, statistical data on that land use category are more uncertain than data in cropland or forestry statistics. Most grazing land statistics are selective and contain only information on artificial grasslands, i.e. land converted for forage crop production, or information on permanent pastures, that is land used permanently at least for five years for herbaceous forage crops. These statistics are known to be highly inaccurate (Asner et al., Citation2004; Harris, Citation2000; Ramankutty et al., Citation2006). All of this results in difficulties in producing grazing land inventories and sometimes leads to the decision to omit this land use type in global assessments of land use and land cover change (e.g. the rapid land cover change assessments in the Millenium Ecosystem Assessment, Citation2005), despite its importance in land use research. Livestock grazing is not only vital for subsistence economies, it is one of the largest fractions of the global human appropriation of biomass (Vitousek et al., Citation1986) and a major driver of the human transformation of terrestrial ecosystems (Asner et al., Citation2004; Graetz, Citation1994).
We here discuss a data set of global land use in the year 2000 that was derived in order to map the global human appropriation of net primary production or HANPP (Haberl et al., Citation2007) and may also be useful for other applications in which socio-economic and remote-sensing data must be systematically integrated. HANPP is defined as the aggregate effect of land conversion and harvest on the availability of NPP in ecosystems and is a widely used measure of the human domination of the Earth's ecosystems (Vitousek et al., Citation1997). In order to be able to map HANPP it is necessary to estimate, for each gridcell, estimates of (1) potential NPP, (2) actual NPP and (3) biomass harvest. The assessment of items (2) and (3) is based on methods that combine information on the biophysical characteristics of the land surface (e.g. dynamic global vegetation models based on soil, temperature and precipitation data) and socio-economic data (census data) on the area of cropland and forest, livestock numbers, and biomass harvest in agriculture and forestry. Correct estimates of total flows require a land use data set that fulfills the above-mentioned four requirements. The maps we have derived are consistent with national census data on a country level and discern the land use classes cropland, grazing, forestry, areas hosting infrastructure, and the remaining area devoid of human land use. The Earth's total land area is consistently allocated to these five classes; that is, within each gridcell, the sum of all classes of dominant land use adds up to 100%. All land use classes are available as separate GIS layers in a percent-per-gridcell representation on a fine geographical resolution (5 arc minutes). By indicating proportional coverage within each gridcell, the data set captures information on land use at the sub-pixel scale. However, at the sub-pixel scale the data set contains only quantitative information and does not provide information on spatial arrangement that could be used to characterize a pixel with respect to fragmentation, patchiness, multiple use of ecosystems, etc. With this data set we intend to make a database available that can be used for assessments of land use effects on global biogeochemical cycles and for coupled socio-ecological models that analyze land systems from an integrated land system science perspective (GLP, Citation2005) on a global scale. The data set can be obtained through our website at http://www.iff.ac.at/socec/.
2 Methods
In our attempt to create a grid-based global land use data set for the year 2000 we combined existing and well-established thematic land use maps on different land use categories. We discern five land use classes, the sum of which covers 100% of the area of each gridcell: (1) settlement and infrastructure area, (2) cropland, (3) forestry, (4) grazing area, (5) unused areas. The map of settlement and infrastructure area includes built-up land in urban and rural areas, industrial and transport facilities as well as artificial, non-agricultural vegetated areas such as parks, other green urban areas and sport and leisure facilities. The cropland map is based on FAO definitions and includes permanent crops (e.g. cacao, coffee, fruit trees or rubber) and arable land (i.e. land under temporary crops, areas used shorter than 5 years as meadows for mowing or pasture, land under market and kitchen gardens and land lying temporarily fallow). Forestry data follow FRA2000/TBFRA2000 definitions which adopt a threshold of 10% minimum crown cover with a minimum size of 0.5 hectares. The forestry map includes natural forests, other woodlands and forest plantations and excludes stands of trees established primarily for agricultural production (e.g. fruit tree plantations; these are included in the cropland definition), and forested land used only for recreational purposes (included in the category ‘settlement and infrastructure’). Trees planted in agro-forestry systems are excluded from the forestry definition; agro-forestry areas are included in either cropland or grazing land depending on the dominant agricultural use. Unused forests—that is, forests included in the map of unused areas according to Sanderson et al. (Citation2002)—were excluded from the forestry map. Unused areas are defined as areas without significant human use. Grazing area was calculated as the remaining area in each gridcell and assumed to include all forms of livestock grazing throughout a wide variety of ecosystems.
The spatially explicit data set was produced for 161 countries with a terrestrial surface >30.000 km2 and available international statistics on agriculture (FAO, Citation2004) and on forest area (FRA2000: FAO, Citation2001; TBFRA2000: UN, Citation2000). We choose a resolution of 5 arc minutes for our maps. To derive coastlines and water bodies (inland and marine) we resampled the GLC2000 global land cover map (Joint Research Center, Citation2002) to 30 arc seconds (originally 32.1 arc seconds) using a majority algorithm, allowing us to calculate consistent percentages for each 5 arc minutes grid cell, and excluded gridcells with >50% water. This procedure resulted in a global total of c. 2 mio. gridcells.
3 Settlement and infrastructure area
Infrastructure area is characterized by artificial land cover such as buildings or transport infrastructure. Besides built-up or impervious areas, this category contains also vegetation cover, e.g. in recreational areas, cemeteries and vegetation along roads and highways. Inventory data for this land use class are not available at the global level but only for a few countries. Urban agglomerations are detectable from remote sensing and are represented in most global land cover maps, but rural settlements, roads and highways are generally not detected by the methods used to derive such data sets. Spatially explicit maps of built-up area exist (Elvidge et al., Citation2001; FAO, Citation1997; Miteva, Citation2001; Small, Citation2004), but substantially underestimate the area covered by this kind of land use, as comparisons with the available national inventory data indicate. We therefore modeled the area used for settlement and infrastructure in each country as a function of its population density and development status, assuming a smaller per-capita area demand in developing countries and a higher demand in industrialized countries (). The model assumptions were derived from data on built-up and related areas for 19 countries in Europe and the Near East from the New Cronos database (Eurostat, Citation2002), from national inventories for the USA (U.S.Census Bureau, Citation2006), Canada (Jones et al., Citation2000), Japan (Statistics Bureau Japan, Citation2006) and Vietnam (GSO Vietnam, Citation2006), from local land use assessments for villages and towns in Thailand (Grünbühel et al., Citation2003) and Laos (Thongmanivong, Citation2004) and data on historic infrastructure land requirements in Central Europe (Krausmann, Citation2004). Urban areas were taken from the GLC2000 land cover category ‘artificial surfaces and associated areas’ which identifies urban agglomerations at high congruence with alternative land cover maps (Giri et al., Citation2005; Jung et al., Citation2006) and integrates local expert knowledge in its classification procedure. The difference of the national total of this category and the national total settlement and infrastructure area estimated using the model assumptions was then allocated to gridcells identified as cropland in the map of Ramankutty and Foley (Citation1999), assuming infrastructure area to be linearly correlated with agricultural activities. Data on development status were taken from the literature (UNSD, Citation2006).
Table 1. Model assumptions used in calculating national-level totals of settlement and infrastructure area as a function of population density and development status. Sources: see text
3.1 Cropland
The cropland map of Ramankutty and Foley (Citation1999) was used for the assessment of the global cropland area. This map was chosen due to its wide acceptance in the scientific Global Change community (e.g. Bondeau et al., Citation2007; Matthews et al., Citation2003; McGuire et al., Citation2001; Millenium Ecosystem Assessment, Citation2005; Tegen et al., Citation2004) and due to its direct focus on cropland land use (Ramankutty and Foley, Citation1998). This map, seminal product of the BIOME300 project (cf. Ramankutty et al., Citation2006), is based on the DISCover land cover data set and calculates the pattern of cropland distribution for the year 1992 in 5' geographic resolution. It combines satellite data and agricultural census data on the basis of an allocation algorithm using error minimization techniques and reproduces FAO statistics for national cropland extent for continents, but not on the national scale. The spatial cropland pattern of this map was used to reproduce the 3-year mean (1999–2001) of the national total in cropland area (sum of arable land and permanent cultures) of FAO cropland statistics (FAO, Citation2004). This task was performed with an algorithm that adjusted the fractional cover in each gridcell without changing the relative weight among the gridcells within a country. The 3-year mean was used in order to reduce the impact of stochastic events or data gaps in the FAO database. The adjustments considered gridcells already identified as urban and infrastructure area in the first step, and allocated missing cropland area to the residual fraction and to other gridcells. For some countries (Saudi Arabia, The United Arab Emirates, and Kuwait) the small number of gridcells identified by Ramankutty and Foley (Citation1999) prevents raising the cropland area to the national total reported in FAO. In this case, cropland area was allocated up to the maximum possible value and the remainder was neglected.
3.2 Forestry
The reference 5 arc minutes grid was used to calculate the percent-per-gridcell of the FRA2000 forest map (FAO, Citation1999), originally available at 30 arc seconds resolution. The FRA2000 map was preferred over alternative forest cover maps because it was compiled to supplement the FRA2000 assessment (FAO, Citation2001) and represents a special assessment discerning forested land from non-forested land and, furthermore, closed forests from fragmented forests and other wooded land. This map, based on the DISCover data set in combination with temporal compositing, modified mixture analysis and geographic stratification, has a reported accuracy of 77% to 86%. Alternative and more recent forests maps exist which would allow for modeling forestry distribution on a global scale, most prominently the MODIS tree cover (Hansen et al., Citation2003; LP DAAC, Citation2007), which is available at a resolution of 500 m fractional cover. However, this map, as most alternative forest cover maps (e.g. DeFries et al., Citation2000) refers to fractional tree cover and would thus require translation of tree cover to forestry land use. This, however, is hampered by the ambiguous relation between land use and land cover (e.g. a patch of forest with a high share of clear cut areas is still subjected to forestry use despite its very low tree cover) and would require to develop a sophisticated interpretation algorithm such as the one used in the FRA2000 mapping effort. The FRA2000 map distinguishes three forest classes: (1) closed forest, (2) fragmented forest, and (3) other wooded land. These layers were used to derive a forestry use map consistent with national forestry census statistics reported in the TBFRA2000 (UN, Citation2000) for temperate and boreal countries, and the FRA2000 (FAO, Citation2001) for all other countries. Closed forest extent was adopted as 100% forestry, except when already allocated infrastructure or cropland area did not allow this. In this case, forestry use was allocated to the remaining gridcell fraction. As the national forest extent reported by the census statistics in nearly all countries exceeds the closed forest area according to the FRA2000 map, the difference between the already allocated closed forest area and the national forest extent was subsequently allocated to grid cells with open and fragmented forests coverage, using a similar procedure as the adjustment of cropland (see above). For countries with massive disparities between remote sensing data and national census data on forest area, mostly countries characterized by a large proportion of open forests, the national forest extent was taken from GLC2000, which is an inclusive forest estimate due to its forest definition (gridcells with more than 15% tree cover). This procedure results in a forest layer which contains used and unused forest ecosystems and thus does not refer to land use in a strict sense. This differentiation was based on the human footprint map (Sanderson et al., Citation2002) discussed below.
3.3 Areas without land use
Based on the human footprint map (Sanderson et al., Citation2002) we excluded areas which are too remote for permanent land use. This map assesses the intensity of human influence upon ecosystems through geographic proxies, such as population density, land transformation due to settlements, proximity to infrastructure, accessibility, e.g. coastlines and rivers, and electrical power infrastructure. We defined gridcells with a human footprint index of 0 and 1 (i.e. areas with 0% or 1% of its extent covered by human artifacts) as wilderness area, i.e. untouched by human activities. Since this map is available at a resolution of 30 arc seconds, we produced a 5 arc minutes mask by identifying cells with >50% wilderness area, similar to the procedure to derive coastlines and water bodies. Gridcells with irrigation (Siebert et al., Citation2005b) and gridcells already occupied by infrastructure and cropland were excluded from the wilderness mask. In addition to the wilderness map we also excluded gridcells with an aboveground net primary production below 20 g C/m2, which we assumed to be the minimal annual productivity required to sustain grazing (Lamprey, Citation1983). Aboveground NPP was calculated with the Lund–Potsdam–Jena Dynamic Global Vegetation Model (Gerten et al., Citation2004; Sitch et al., Citation2003). From the resampled GLC2000 we used the layer identifying snow cover to calculate the 5min fractional cover resolution and added those areas to the non-productive layer identified by LPJ.
3.4 Grazing land
The difference between the total area of a gridcell and the area allocated to the sum of built-up area, cropland area, forestry area and wilderness in the previous four steps was assumed to be used for grazing. The resulting map of grazing land comprises a wide range of ecosystems, from artificial and semi-natural grasslands, natural grasslands, semi-deserts and deserts, to scrublands, savannas and tundra.
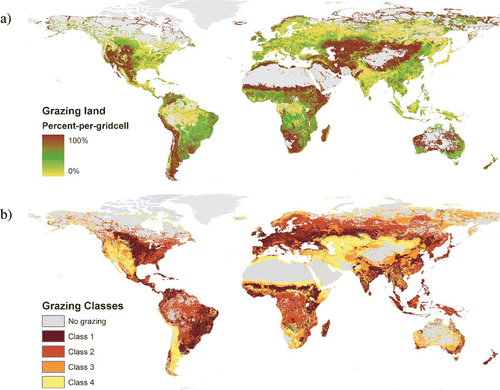
The resulting grazing land is characterized by huge differences in grazing suitability. It includes highly productive grassland ecosystems as well as semi-deserts with irregular patterns in NPP, short vegetation periods and a high percentage of barren area cover. In order to enhance the utility of this map, we complement it with a map discerning four classes of grazing suitability. In a first step we used land cover information from a 5' majority recalculation of the GLC2000 to divide grazing land into three sub-classes, assuming a correlation of grazing suitability with land cover, e.g. high suitability of cultivated and managed areas, medium suitability of grazing land found under tree cover, and low suitability if shrub cover or sparse vegetation is detected in remote sensing. The grouping is shown in . In a second step we separated the first two classes into two classes each, based on a threshold of aboveground NPP of 200 g C/m2, in order to take the effect of productivity on grazing suitability into account (McNaughton et al., Citation1989; Oesterheld et al., Citation1992). In a third step, the resulting five classes were regrouped into four classes (). This procedure results in a map labeling each 5' gridcell with classes 1–4 of grazing suitability.
Table 2. Classification of grazing land on basis of land cover information (GLC2000) and potential productivity patterns (calculated with the LPJ-DGVM; Gerten et al., Citation2004; Sitch et al., Citation2003)
4 Results and discussion
The aim of this study was to produce consistent and comprehensive land use maps compatible with socio-economic land use data on one hand, and with spatially explicit land cover data on the other hand. Our main purpose was to specify the mix of land use within each gridcell or to identify areas which were without land use around the year 2000. The results are shown in and . Five distinct land use maps are presented: settlement area and infrastructure (), cropland (), forestry (), areas without land use () and grazing land (). A sixth map () displays the four grazing suitability classes and complements the grazing land map. According to this map, class 1, the best-suitable, highly productive grazing land class, consists of 11.4 mio. km2, 24% of the total grazing land, class 2 has an extent of 7.4 mio. km2 (16% of the total grazing land) and class 3 8.2 mio. km2 (18%). Class 4, the least productive and suitable class for grazing, is the largest fraction with 19.7 mio. km2, or 42% to the total global grazing land. All land use maps are available at a resolution of 5 arc minutes and can be aggregated to coarser resolutions for modeling applications.
Figure 1. Patterns of land use. (a) Urban and infrastructure area, (b) cropland, (c) forestry, (d) wilderness and unproductive area. Greenland and Antarctica excluded. (Available in colour online)
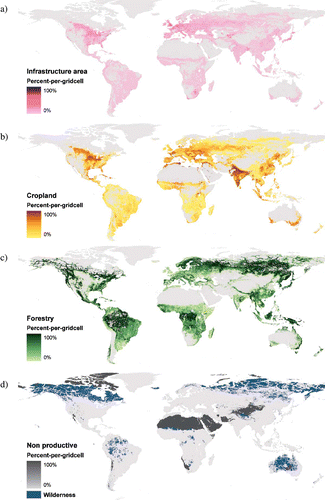
Figure 2. Patterns of land use. (a) Grazing land and (b) grazing suitability classes: 1 high suitability, 4 low suitability. Greenland and Antarctica excluded. (Available in colour online)
Quantitative and spatial validation of our result is challenging due to the absence of reliable reference data sets. To evaluate the reliability of the five maps we compared the global total () and national results (, Appendix) with the original statistical data sources and with alternative available data sets. Furthermore, because such a quantitative comparison on the national level is inadequate to discuss spatial patterns, we compared our results with alternative data sets on a grid-per-grid basis. This comparison includes European high resolution land cover data for infrastructure area, forestry and agriculture from the CORINE Land Cover 2000 map (CLC2000: Joint Research Center, Citation2006), the global grazing area map of the HYDE database (Klein Goldewijk, Citation2001), the comprehensive land use data set for the year 1992 constructed by Hurtt et al. (Citation2001) for the conterminous USA at 0.5° resolution by combining census statistics and remote sensing data (we refer to the national model results, see Hurtt et al., Citation2001, for details), and MODIS global land cover data at 500 m fractional cover resolution (LP DAAC, Citation2007). The latter intercomparison yielded further insights into the differences of land use and land cover, essential for understanding the quality of the maps presented here. In order to compare spatial patterns of our maps with alternative data sources, we calculated the numerical fuzzy kappa values and the Pearson correlation coefficient on a gridcell-to-gridcell basis, using the Map Comparison Kit (Visser and de Nijs, Citation2006) and the SAGA GIS (SAGA, Citation2006), respectively. The fuzzy numerical kappa is an enhancement of the fuzzy kappa coefficient, originally developed to compare raster maps of categorical data (Hagen, Citation2003). It expresses similarity between continuous maps, comparing values as well as location, considering uncertainties in both, and taking influences of neighboring cells on a target cell into account (Hagen-Zanker et al., Citation2005; Prasad et al., Citation2006). The Pearson's correlation coefficient (r) shows the linear degree of agreement between two maps and supplements the fuzzy numerical kappa. The results of the spatial intercomparison is summarized in below.
Table 3. Global quantitative result and comparison with original data sources and alternative data. Data exclude Greenland and Antarctica; regional sub-samples in italics
Table 4. Spatial statistics of the land use maps and alternative land use/land cover maps intercomparison. Hurtt (Citation2001) refers to the national model presented in that article. B: Boolean representation, fc: fractional coverage. Greenland and Antarctica excluded from the analysis
4.1 Settlement and infrastructure area
Our estimate of global settlement and infrastructure area is considerably higher than existing global maps for built-up area (FAO, Citation1997; Miteva, Citation2001; ). In the spatial representation, besides urban areas detected by remote sensing which we adopted from the GLC2000, settlement and infrastructure area is only allocated to gridcells containing cropland, because density of settlement areas is decreasing with decreasing land use intensity. With this assumption, a certain fraction of this land use class, e.g. infrastructure in forested areas devoid of cropland, cannot be assumed to be allocated accurately. Furthermore, the connection of cropland and infrastructure area is most likely strong in subsistence agriculture, but probably much weaker in areas of intensive industrialized agriculture. However, better spatially explicit data on rural infrastructure areas are unfortunately not available, and current specific maps refer only to urban land use (e.g. Elvidge et al., Citation2001; Small, Citation2004).
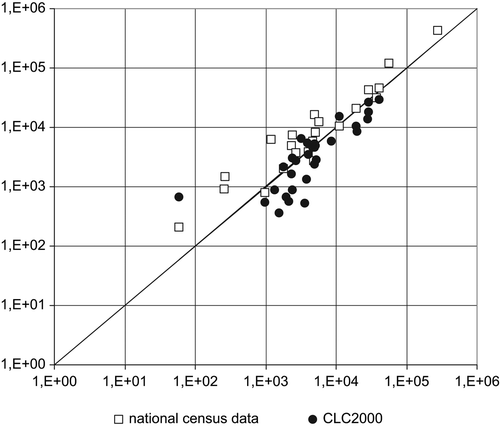
In order to gain a better understanding of the quality of this layer, we compared our map with the CLC2000. This data set, available at a resolution of 100 m in Lambert Equal Area Azimuthal projection for 28 European countries, was particularly suitable for such a comparison due to its similarity in definition of the settlement and infrastructure classes: the class 1 comprises urban fabric areas (class 1.1), industrial and transport facilities (class 1.2), mine and dump constructions (class 1.3) and includes artificial, non-agricultural vegetated areas such as green urban areas and sport and leisure facilities (class 1.4). This map, however, does not contain information on rural infrastructure due to the minimum detection size of its input data. We re-projected the CLC2000 to a geographic projection and calculated the fractional cover of the artificial-surface classes for the 5min cells of our reference grid. The comparison of the two maps yielded a fuzzy kappa value of 0.58 and a Pearson's r of 0.75 (), which we interpret as a high correspondence of the two layers in the light of the methodological differences used to derive the two maps. A comparison of the national totals of the CLC2000 map and of the national census data used to derive the model assumptions (see above) with the national results of our modeling attempt is displayed in . Pearson's r values between the data sets were 0.93 for the CLC2000 data and 0.99 for the census data. Note that we did not force the model to reproduce national census values, but merely derived the national per-capita infrastructure area demand from the census statistics, using only few broad classes (). The high correspondence of the census data and model result is therefore remarkable. However, our result is still systematically smaller than the census data, indicating that the model assumptions in lead to a conservative estimate. Due to the omission of rural infrastructure area, national totals derived from CLC2000 are below the results of our model ().
Figure 3. Estimates of urban and infrastructure land use in those countries with census data (see text) and the countries represented in the CLC2000 (Joint Research Center, Citation2006) (y-axis) plotted versus the national result of our urban and infrastructure layer (x-axis). Note the logarithmic representation of both axes. The straight line indicates 1:1 correspondence for interpretation.
4.2 Cropland
and confirm that our modeling approach almost perfectly reproduces the official statistics for cropland. Small deviations still present stem from cropland areas not allocated due to mismatches in available cropland gridcells and total national cropland area (see Methods). The spatial pattern of our cropland map is derived from the cropland map by Ramankutty and Foley (Citation1999), originally produced for the year 1992. We realize that adjusting the spatial pattern of a map published for the year 1992 to the cropland extent reported by official statistics for the year 2000 constitutes a source of uncertainty. With this approach we assume that increases or decreases in cropland extent in this period of time occurred uniformly over the entire cropland area within a country. This assumption may be problematic in regions with rapid land use change. However, as we aimed to derive a map which combines spatial pattern and total extent from census statistics at the national level, this inaccuracy is probably small in the light of the deviations of the original cropland map to the national cropland census statistics: The map by Ramankutty and Foley (Citation1999) estimates global cropland extent in the year 1992 at 17.9 mio. km2, whereas FAO reports an extent of 15.1 mio. km2 for the same year, a difference of 19%. Global cropland expanded by only 2% between 1992 and 2000 (FAO, Citation2004).
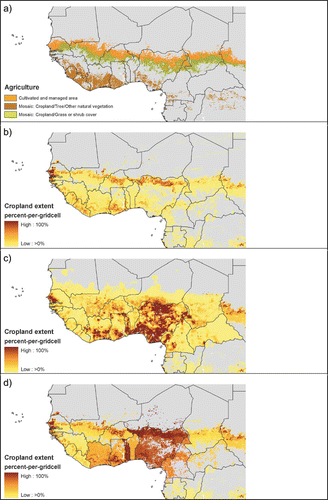
The gridcell-to-gridcell comparison of Ramankutty and Foley's Citation(1999) map with our cropland map results in a high fuzzy kappa of 0.85 and a Pearson's r of 0.93 at the global level. Most countries range between fuzzy kappa values of 0.85 and 0.99 (e.g. France 0.89, USA 0.92, Indonesia 0.94, India 0.95, Argentina 0.99) and even higher r values. The agreement is found to be larger in big countries and in developing countries, due to the minor relative weight of changed pixels. However, in some countries we had to adjust Ramankutty and Foley's cropland extent more than threefold (17% of all countries, mostly in Africa). Here, lower fuzzy kappa values are found (e.g. Mozambique 0.56, Nigeria 0.39, Benin 0.26). However, r-values are higher for these countries (0.99, 0.62, 0.65, respectively), pointing to a higher agreement in spatial pattern than in overall extent. In the region of West Africa, it is well-known that Ramankutty and Foley's Citation(1999) map only poorly reproduces cropland patterns. A new data set for this region was published recently (Ramankutty, Citation2004). A visual inspection for that region (Appendix, ) of the GLC2000, Ramankutty and Foley's original map, Ramankutty's (Citation2004) new map and our map demonstrates that our map is largely similar to Ramankutty's improved map.
A comparison of our cropland map with that derived by Hurtt et al. (Citation2001) at a resolution of 0.5° yielded a fuzzy kappa of 0.53 and a Pearson's r of 0.90, suggesting reasonable agreement (). A direct comparison of our cropland map with the cropland data available in the CLC2000 was impossible because the latter include also the ambiguous land cover category ‘heterogenous agricultural areas’. This category contains significant fractions of pastures and natural vegetation mosaics. A comparison of agricultural land was, however, possible. For this statistical test we combined our cropland and grazing land maps and compared it to the sum of cropland, permanent cropland, pastures and meadows and heterogeneous agricultural areas from CLC2000. This gridcell-to-gridcell comparison yields a high fuzzy kappa of 0.64 and a Pearson's r of 0.86, indicating considerable agreement between both maps of agricultural land.
4.3 Forestry
The forest layer reproduces national census statistics from the TBFRA2000 for temperate and boreal countries and from the FRA2000 for all others ( and ). Our estimate for total forest area is thus higher than the FRA2000. The TBFRA2000 estimate is reproduced for this sub-sample of countries (, row c″). Other data sources, such as the GLC2000 and the FRA2000 forest map itself, result in higher estimates for total forest area. For matters of comparison we calculated the global area bearing tree cover from the MODIS assessment (Hansen et al., Citation2003). Remarkably, global tree cover, i.e. the net area covered by trees, amounts to 28 mio. km2 and is substantially smaller than the global forest estimates, again pointing at the differences between land use and land cover data sets. The basis of our assessment, the FRA2000 map has a reported accuracy of 0.86 for the forest and non-forest classification, and 0.77 for the distinction of the three forested land and the other land classes (FAO, Citation1999). Because we did not change the spatial pattern of this map but merely interpreted its classes, we conclude that our map's accuracy is similar to that of the original map. The comparison of our forestry map with the forest classes from the CLC2000 (Joint Research Center, Citation2006) for European countries yields a fuzzy kappa value of 0.68 and a Pearson's r of 0.81; that with Hurtt et al.'s Citation(2001) forestry map a fuzzy kappa of 0.48 and a Pearson's r of 0.85 (), thus corroborating this conclusion.
also shows that, according to the wilderness map we used, 85% of the forest area are under forestry use, the remaining 15% are not used. Remember that we assumed all forests outside wilderness areas to be under use, although maybe very extensively. This is a pragmatic assumption, however, especially for sparsely populated areas with a large forested area, such as certain African countries where less than 1% of the total forest area is subjected to timber harvesting (FRA2000). The use of alternative global data sets, such as the ‘intact forest’ map (Greenpeace International, Citation2006) that models the extent of ‘intact’ forests, would yield a different result. This map, based on the MODIS tree cover map (Hansen et al., Citation2003), follows a proximity-approach similar to the human footprint map by Sanderson et al. (Citation2002), identifying areas without significant visible signs of human impact such as logging, burning or other forms of clearings by means of geographic proxies. However, it focuses on intactness and thus applies smaller proximity boundaries, which results in larger areas identified as untouched by human activities than the human footprint map, especially in the Amazon region, Papua New Guinea, South-East Asia and Central Africa.
4.4 Grazing land
Grazing was assumed to prevail in all accessible and productive areas which are not used for infrastructure, cropland or forestry. The resulting grazing map thus includes all areas thought to be under some kind of grazing regime, be it artificial grasslands, natural grassland, tundra, semi-deserts or areas mowed for hay or silage production. This estimate is obviously much larger than the FAO estimate of permanent pastures (land used permanently at least for five years) at the global level. However, for some countries our estimate is well below the FAO estimate (Appendix, ). Surprisingly, for some countries our grazing land result is almost identical with the FAO permanent pasture estimate (e.g. China, South Africa, Mexico, New Zealand). To facilitate comparisons, also displays some estimates of global grassland cover or pasture areas, the differences of which can largely be explained by the use of different land cover definitions (White et al., Citation2000). Our estimate falls well within the range of these estimates. The grazing land extent figure by Meyer and Turner (Citation1992) is by far the highest estimate, almost twice the permanent pasture estimate by FAO and 45% larger than our result based on a very inclusive definition. This estimation illustrates the scale of disparity which prevails with regard to grazing land data and definition.
However, some caveats are warranted with reference to the grazing land map presented here. First, we are aware that, due to the subtractive approach we followed, inaccuracies of all other maps may accumulate in producing the grazing land map. Second, other types of land use might prevail in area remaining after subtraction of cropland, forestry and infrastructure areas (see Heilig, Citation1994). Our grazing land map might be labeled more precisely as ‘land potentially available for land uses other than cultivation, forestry and infrastructure’, but it seems plausible that grazing and mowing are by far the most important uses prevailing on that area. Finally, the quality of the grazing land map depends on the assumptions used in excluding non used areas. Whereas the aboveground NPP threshold of 20 g C/m2 may be suitable to identify regions unlikely to sustain grazing according to the literature (Lamprey, Citation1983), the application of the human footprint map (Sanderson et al., Citation2002) to identify productive unused areas may be error prone. This map probably underestimates the extent of areas without land use due its approach to identify proximity to human artifacts. Furthermore, it is likely that it suffers from the systematic omission of minor inclusions of non-usable land such as scarps, rock outcrops or small water bodies in nearly every gridcell (Young, Citation1999), and thus the extent of grazing land is biased towards a high estimate. On the other hand, grazing activities of transhuman societies are probably underrepresented, as such societies create few, if any, artifacts detectable from space.
A spatial validation of the grazing land map presented here is thus highly desirable. This is difficult, however, as no global data set on the spatial distribution of grazing land, according to a reasonably similar definition, is available on a 5 min resolution. For European countries, agricultural areas (= grazing land plus cropland) showed a high agreement with high-resolution land cover data from CLC 2000 (see above). For the conterminous USA, the comparison with Hurtt et al.'s Citation(2001) pasture map resulted in a fuzzy kappa of 0.48 and a Pearson's r of 0.79, thus also suggesting reasonable agreement.
On a global level, we compared our grazing map with the HYDE land use map (Klein Goldewijk, Citation2001) for the year 1990, a map widely used in the global change modeling community (e.g. Asner et al., Citation2004). This map, available at a resolution of 0.5° (approximately 55 km at the equator), maps the distribution of cropland and permanent pastures starting from a potential vegetation classification (e.g. Ramankutty and Foley, Citation1999) in a Boolean representation. We resampled our map to a 0.5° fractional cover resolution and compared it to the aggregated grazing land classes in HYDE, i.e. the sum of the classes ‘marginal cropland/used for grazing’, ‘savanna’, ‘grassland/steppe’, ‘dense shrubland’, ‘open shrupland’, and ‘tundra’ (). The class 2 ‘marginal cropland/used for grazing’ (shaded area in ) almost exactly reproduces the FAO estimate of permanent pasture (). shows that almost all grazing land gridcells in the HYDE map have a high grazing coverage in our grazing map (green color gradient). The class ‘marginal cropland/used for grazing’ (shaded area) is obviously much smaller than the total grassland/pasture areas. Especially low quality grasslands in mountainous and semi-desert regions of the world are not included in this class of the HYDE database. This is a result of the approach used to construct the HYDE map that allocates the national pasture extent reported by FAO to entire 0.5° gridcells until the national sum is reached.
Figure 4. Comparison of the permanent pasture map by Klein-Goldewijk Citation(2001) and the grazing land layer. Greenland and Antarctica not included. For discussion see text. (Available in colour online)
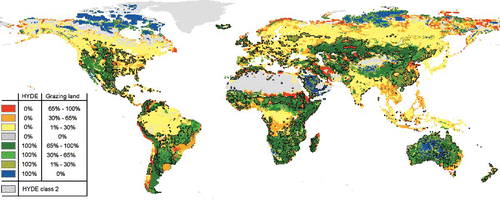
Only few grazing gridcells in HYDE are devoid of grazing in our map (blue color); this is especially the case in tundra regions of the north, desert regions south of the Gobi desert, on the Saudi-Arabian Peninsula and in Australia. These are mostly gridcells classified as ‘wilderness’ or unproductive in our maps. The two maps differ substantially in areas where our map identifies a certain grazing coverage, but HYDE does not (yellow to red color gradient). Yellow to orange areas in (no grassland or pasture in HYDE, small grazing land extent in the grazing land layer) are found in almost all areas and ecozones. In temperate regions such as in Europe, the US, and China, these are mostly areas of permanent agricultural activities, which are known to include pastures and meadows. Yellow areas are also found in tropical and boreal zones and tundra ecosystems. Grazing is presumably prevalent here as well, although sometimes very extensively, but occasionally associated with adverse effects such as the reported cases of overgrazing in the Siberian tundra regions (Stolbovoi and McCallum, Citation2006). Few gridcells are not identified as grasslands or pastures in HYDE but show a high fraction of grazing land coverage in our assessment (red areas). These are mostly areas at the boundary between productive and unproductive areas in desert and arctic regions.
4.5 Comparison with MODIS land cover data
We also compared our land use maps with the vegetation continuous field data set from MODIS (Hansen et al., Citation2003; LP DAAC, Citation2007), available at a resolution of 500 m fractional cover. This data set provides global estimates of landscape components (tree cover, herbaceous cover, and bare cover), the sum of which adds up to 100%. In order to compare our land use maps to this MODIS data set, we calculated the MODIS fractional cover in each cell of our 5 min reference grid and rearranged our land use maps in order to make them comparable. displays histograms of difference of the three comparison maps: we compared the MODIS tree cover layer with our forestry layer plus non-used forests () and the MODIS bare cover with the combination of the non-productive area and infrastructure area (). Note that the latter includes vegetation cover by definition and is therefore bound to yield unsatisfactory results. Finally, we compared the MODIS herbaceous cover to those of our maps consisting mainly of annual plants, i.e. the sum of the cropland and grazing land layer, including non-forested but productive untouched areas (). summarizes the spatial correlation values.
Figure 5. Histogram of difference in percent fractional cover in each 5 min gridcell of (a) forest cover, (b) bare cover, (c) herbaceous cover of the MODIS layers and the corresponding land use layers. x-axis representation: land use layers minus MODIS.
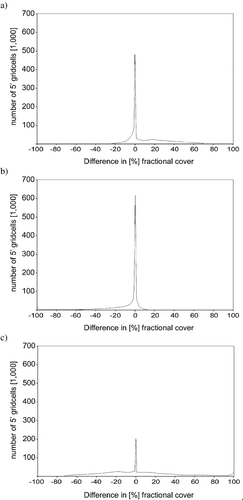
The comparison of the tree cover layer and our forest map () yields a fuzzy kappa value of 0.61 and a Pearson's r of 0.84 (), suggesting a considerable spatial agreement of the two maps. Remaining differences can to a large extent be explained by the ambiguous relation between land use and land cover. For some gridcells MODIS tree cover surmounts our estimate of forest coverage (negative values in ). These probably are areas with tree cover outside forests, or forested areas subjected to land uses other than forestry, such as parks (categorized as infrastructure area), permanent cultures such as fruit trees, grazed savannas or agricultural fields with some scattered tree cover (e.g. agro-forestry). For a larger fraction of gridcells forest area in our map is larger than tree cover according to MODIS. These gridcells presumably comprise forests with incomplete crown closure, such as open or fragmented forests. Visual inspection (not shown) reveals that these gridcells are mainly located in Eastern Siberia, a region for which large disagreements between MODIS and other land cover classification systems have been reported (Giri et al., Citation2005; Jung et al., Citation2006).
The comparison of the bare areas reaches the lowest fuzzy kappa value of all three intercomparisons (0.44) and a Pearson's r of 0.69. A large part of the discrepancy may be explained by the fact that infrastructure areas by definition comprise vegetation. The histogram of differences () indicates considerable agreement for desert and bare areas. A small peak is found at –100%. These are gridcells classified neither as non-productive nor as infrastructure in our map but with near to 100% bare cover in the MODIS map. These are probably gridcells incorrectly identified in our map as grazing land due to the subtractive approach that is not able to identify small inclusions of non-usable fractions such as mountain tops.
The intercomparison of the MODIS herbaceous cover layer with our agricultural land map (=cropland plus grazing land) yields a fuzzy kappa of 0.58 and a Pearson's r of 0.45. Discrepancies between land use and land cover can also explain the differences displayed in . These mismatches are reciprocal to the ones discussed above, mainly the herbaceous fraction in forested ecosystems (negative values in ). Positive values in are gridcells categorized as grazing land in our map in which herbaceous cover is smaller according to MODIS. This discrepancy may result from cropland or grazing land in areas with scattered tree cover (e.g. agro-forestry or savannahs), and, most dominantly, grazing in areas with a considerable proportion of bare cover—all of which are conceptual divergences between land use and land cover. The small peak at +100% is probably due to an inaccuracy of our grazing land map, because it would imply grazing land use in the absence of any herbaceous cover. However, underestimation of (sparse) herbaceous cover in deserts in the MODIS map cannot be ruled out (Jung et al., Citation2006).
5 Concluding remarks
Spatially explicit, consistent and comprehensive land use data are high on the agenda of integrated land system science (GLP, Citation2005). While some applications require data sets with the highest possible precision with respect to total extent and spatial pattern of individual land-use categories (e.g. cropland or agricultural land: Monfreda et al., forthcoming; Ramankutty et al., forthcoming), we here present an integrated set of five maps that aims to represent land use comprehensively by allocating 100% of the area of each gridcell to five broad classes of dominant land use. A strength of this data set is that the cropland and forestry maps are consistent with national census data, thus allowing to consistently link statistical socio-economic data (e.g. livestock numbers, fertilizer use, yields, cultivars or harvest) with spatially explicit information. Moreover, the 100% coverage approach is essential in cases where it is required to have comprehensive, double-counting free accounts of land use that guarantee that no area is omitted in the assessment. Comprehensive assessments of land-related phenomena that are simultaneously influenced by natural and socio-economic factors and are thus highly relevant to sustainability—such as the global human appropriation of net primary production (Haberl et al., Citation2007)—require exactly such data sets. Similar applications could include, among others, an assessment of methane emissions from ruminants on grazing lands (that could profit from the grazing land quality map presented here) or a comprehensive assessment of global natural and anthropogenic nitrogen or carbon flows. Such assessments could profit from a data set suitable for integrating census / statistical data with GIS data in a sensible way.
We are of course aware of the limitations of our methods that stem from lacking data on many important aspects of land use, in particular built-up land, non-used areas and grazing land. Nevertheless, we feel that the necessity of a data set that consistently includes these important (but poorly documented) aspects of land use in a comprehensive way for the above-discussed applications justifies the admittedly crude approach in the absence of better information. Moreover, as we have extensively discussed above, the maps derived by this approach are in reasonable accordance with widely accepted independent land use and land cover data sets, including CORINE-CLC2000, MODIS and the maps derived by Hurtt et al. (Citation2001). We note that—due to these limitations—the data set should only be used for global or at least very large-scale (e.g. continental) applications and is not expected to yield satisfactory results on small scales.
In particular, the grazing map may be an improvement over existing data sets but is still far from satisfactory. First, global validation was almost impossible due to the lack of reliable census data or comparable maps. By definition, the grazing land map presented here differs from the more narrowly defined pasture areas included in the HYDE database (Klein Goldewijk, Citation2001), but is largely consistent with a more encompassing definition of grazing land that also includes natural grasslands, among others. The literature on grazing systems suggests that such an encompassing definition is needed because grazing occurs in a large variety of ecosystems (Conant, Citation2002, FAO, Citation2003, Citation2005; Harris, Citation2000; Lambin et al., Citation2001; Le Houerou, Citation1989; Oesterheld et al., Citation1992; White et al., Citation2000). In order to enhance the applicability of our grazing land map we derived a map of grazing land quality that represents the range of ecosystem suitability for grazing, thus complementing the grazing land map. The combination of these two maps is aimed to contribute to further analyses of the spatial impacts of livestock systems, such as impacts on vegetation cover and hydrology, emissions of greenhouse gases, overgrazing and its consequences such as degradation and desertification.
One major aim of our study was to reconcile spatial patterns and national land use statistics. We are aware that this objective may be questioned. First, census data, as reported in international statistics, may be incomplete, biased, or simply flawed (Grainger, Citation1996; Matthews, Citation2001; Mayaux et al., Citation2005). Second, even today some national census data may differ quite substantially from official international estimates (Frolking et al., Citation1999), and it is often not clear which of the two data sets is less erroneous. Third, land use inventories do not necessarily report only on land use, but often also contain land cover information. Moreover, there may be huge discrepancies due to differences in definitions, as it is the case with forest statistics (Houghton, Citation2005; Mather, Citation2005; Noble et al., Citation2000). All of this suggests some caveats with respect to our data set. Nevertheless, in the absence of more reliable global data, we give priority to the FAOstat, TBFRA2000 and FRA2000 data sets because these data are (1) closest to political land use decision making and socio-economic statistics and modeling, and (2) as standard data sources they basically are the only data available for cross-national analyses of agriculture and forestry at the global scale. Furthermore, most existing and commonly used thematic land use data sets suffer from the very same deficiency. Advances in the reliability of official (census) statistics on land use are highly desirable, in any case.
Another potential source of uncertainty remains, as our approach does not allow to account for multiple uses of ecosystems, but strictly separates the four land use categories, classifying them by dominant land use. An obvious example is agro-forestry, but multiple land use is not restricted to any type of land use. To account for multiple land use by simply double-counting areas for each land use class, however, would hamper the consistency of the data set. Multiple land use could be better addressed by defining specific classes of multiple land use (e.g. grazing–forestry Mosaic). However, to our knowledge no spatially explicit data exist to support such an approach.
We are also aware that it is far from ideal to combine different data sets from a decadal time span (early 1990s to recent years), as we were forced to do. Of course, further work seems to be highly desirable, particularly with respect to built-up land, multiple land use, unused areas and grazing land. Information that systematically differentiates between land use and land cover are lacking today, but are required in order to be able to better integrate ecological and socio-economic data, thus advancing the integrated analysis of the global land system.
Acknowledgements
This research was funded by the Austrian Science Fund (FWF) within project P16692-G05 and by the FP6 of the EU within the MATISSE project. It contributes to the Global Land Project (GLP). We thank C. Lauk, M. Zika for their support in finding references, V. Grabner for help with programming, and W. Lucht for useful discussions.
Related Research Data
References
- Ajtay , G. L. , Ketner , P. and Duvigneaud , P. 1979 . “ Terrrestrial primary production and phytomass ” . In The Global Carbon Cycle , Edited by: Bolin , B. , Degens , E. T. , Kempe , S. and Ketner , P. 129 – 182 . Chichester : John Wiley & Sons .
- Asner , G. P. , Elmore , A. J. , Olander , L. P. , Martin , R. E. and Harris , A. T. 2004 . Grazing systems, ecosystem responses, and global change . Annual Review of Environment and Resources , 29 : 261 – 299 .
- Bondeau , A. , Smith , P. C. , Zaehle , S. , Schaphoff , S. , Lucht , W. , Cramer , W. , Gerten , D. , Lotze-Campen , H. , Muller , C. , Reichstein , M. and Smith , B. 2007 . Modelling the role of agriculture for the 20th century global terrestrial carbon balance . Global Change Biology , 13 : 679 – 706 . online first, January 2007.
- Brovkin , V. , Sitch , S. , Von Bloh , W. , Claussen , M. , Bauer , E. and Cramer , W. 2004 . Role of land cover changes for atmospheric CO2 increase and climate change during the last 150 years . Global Change Biology , 10 : 1253 – 1266 .
- Brown , D. G. and Duh , J. -D. 2003 . Spatial simulation for translating from land use to land cover . International Journal of Geographical Information Science , 17 : 1 – 26 .
- Cihlar , J. and Jansen , L. J. M. 2001 . From land cover to land use: a methodology for efficient land use mapping over large areas . The Professional Geographer , 53 : 275 – 289 .
- Clark , W. C. , Crutzen , P. J. and Schellnhuber , H. -J. 2004 . “ Science for global sustainability ” . In Earth System Analysis for Sustainability , Edited by: Schellnhuber , H. -J. , Crutzen , P. J. , Clark , W. C. , Claussen , M. and Held , H. 1 – 28 . Cambridge, MA : Report of the 91st Dahlem Workshop, MIT Press .
- Conant, R. T., 2002, Grazer-dominated ecosystems. In Encyclopedia of Life Sciences (London: Macmillan). Available online at: www.els.net
- DeFries , R. S. , Hansen , M. C. , Townshend , J. R. G. , Janetos , A. C. and Loveland , T. R. 2000 . A new global 1-km data set of percentage tree cover derived from remote sensing . Global Change Biology , 6 : 247 – 254 .
- Elvidge , C. D. , Imhoff , M. L. , Baugh , K. E. , Hobson , V. R. , Nelson , I. , Safran , J. , Dietz , J. B. and Tuttle , B. T. 2001 . Night-time lights of the world: 1994–1995 . ISPRS Journal of Photogrammetry and Remote Sensing , 56 : 81 – 99 .
- Eurostat, 2002, Eurostat New Cronos. Macroeconomic and social statistical data. Available online at: http://epp.eurostat.ec.europa.eu . (Luxembourg: European Communities)
- FAO, 1997, Built-up Areas of the World (Vmap0). Available online at: http://www.fao.org/geonetwork
- FAO . 1999 . Global Forest Cover Map , Rome : FAO .
- FAO . 2001 . Global Forest Resources Assessment 2000. Main Report , Rome : FAO .
- FAO . 2003 . Transhumant Grazing Systems in Temperate Asia , Rome : Food and Agriculture Organization of the United Nations .
- FAO . 2004 . FAOSTAT 2004, FAO Statistical Databases: Agriculture, Fisheries, Forestry, Nutrition , Rome : FAO .
- FAO . 2005 . Grasslands of the World , Rome : Food and Agriculture Organization of the United Nations .
- FAO . 2006 . Global Forest Resource Assessment 2005: Progress Towards Sustainable Forest Management , Rome : FAO .
- Foley , J. A. , DeFries , R. , Asner , G. P. , Barford , C. , Bonan , G. , Carpenter , S. R. , Chapin , F. S. , Coe , M. T. , Daily , G. C. , Gibbs , H. K. , Helkowski , J. H. , Holloway , T. , Howard , E. A. , Kucharik , C. J. , Monfreda , C. , Patz , J. A. , Prentice , I. C. , Ramankutty , N. and Snyder , P. K. 2005 . Global consequences of land use . Science , 309 ( 5734 ) : 570 – 574 .
- Friedl , M. A. , McIver , D. K. , Hodges , J. C. F. , Zhang , X. Y. , Muchoney , D. , Strahler , A. H. , Woodcock , C. E. , Gopal , S. , Schneider , A. , Cooper , A. , Baccini , A. , Gao , F. and Schaaf , C. 2002 . Global land cover mapping from MODIS: algorithms and early results . Remote Sensing of Environment , 83 : 287 – 302 .
- Frolking , S. , Qui , J. , Boles , S. , Xiao , X. , Liu , J. , Zhuang , Y. , Li , C. and Qin , X. 2002 . Combining remote sensing and ground census data to develop new maps of the distribution of rice agriculture in China . Global Biogeochemical Cycles , 16 : 1091 – 1101 .
- Frolking , S. , Xiao , X. , Zhuang , Y. , Salas , W. and Li , C. 1999 . Agricultural land-use in China: a comparison of area estimates from ground-based census and satellite-borne remote sensing. GCTE/LUCC RESEARCH LETTER . Global Ecology and Biogeography , 8 : 407 – 416 .
- Gerten , D. , Schaphoff , S. , Haberland , U. , Lucht , W. and Sitch , S. 2004 . Terrestrial vegetation and water balance—hydrological evaluation of a dynamic global vegetation model . Journal of Hydrology , 286 : 249 – 270 .
- Giri , C. , Zhu , Z. and Reed , B. 2005 . A comparative analysis of the Global Land Cover 2000 and MODIS land cover data sets . Remote Sensing of Environment , 94 : 123 – 132 .
- GLP . 2005 . Global Land Project. Science Plan and Implementation Strategy , Stockholm : IGBP Secretariat .
- Graetz , D. 1994 . “ Grasslands ” . In Changes in Land Use and Land Cover: A Global Perspective , Edited by: Meyer , W. B. and Turner , B. L. I. 125 – 147 . Cambridge : Cambridge University Press .
- Grainger , A. 1996 . An evaluation of the FAO tropical forest resource assessment, 1990 . The Geographical Journal , 162 : 73 – 79 .
- Greenpeace International, 2006, Roadmap to recovery. The world's last intact forest landscapes. Available online at: http://www.intactforests.org/ Greenpeace International
- Grünbühel , C. M. , Haberl , H. , Schandl , H. and Winiwarter , V. 2003 . Socio-economic metabolism and colonization of natural processes in SangSaeng Village: material and energy flows, land use, and cultural change in Northeast Thailand . Human Ecology , 31 : 53 – 87 .
- GSO Vietnam, 2006, Land use in 2003. Available online at: http://www.gso.gov.vn/default_en.aspx?tabid=466&idmid=3&ItemID=1494 . General Statistic Office of Vietnam
- Haberl , H. , Erb , K. -H. , Krausmann , F. , Gaube , V. , Bondeau , A. , Plutzar , C. , Gingrich , S. , Lucht , W. and Fischer-Kowalski , M. 2007 . Quantifying and mapping the human appropriation of net primary production in the Earth's terrestrial ecosystems . Proceedings of the National Academy of Science , 104 : 12 942 – 12 . 947
- Hagen-Zanker , A. , Straatman , B. and Uijee , I. 2005 . Further developments of a fuzzy set map comparison approach . International Journal of Geographical Information Science , 19 : 769 – 785 .
- Hagen , A. 2003 . Fuzzy set approach to assessing similarity of categorical maps . Journal of Geographical Information Science , 17 : 235 – 249 .
- Hansen , M. C. , DeFries , R. S. , Townshend , J. R. G. , Carroll , M. , Dimiceli , C. and Sohlberg , R. A. 2003 . Global percent tree cover at a spatial resolution of 500 meters: first results of the MODIS vegetation continous field algorithm . Earth Interactions , 7 : 1 – 15 . Paper No. 10
- Harris , P. S. 2000 . Grassland Resource Assessment for Pastoral Systems , Rome : Food and Agricultural Organization of the United Nations (FAO) .
- Heilig , G. 1994 . Neglected dimensions of global land-use change: reflections and data . Population and Development Review , 20 : 831 – 859 .
- Heistermann , M. , Muller , C. and Ronneberger , K. 2006 . Land in sight? Achievements, deficits and potentials of continental to global scale land-use modeling . Agriculture, Ecosystems & Environment , 114 : 141 – 158 .
- Houghton , R. A. 2005 . Aboveground forest biomass and the global carbon balance . Global Change Biology , 11 : 945 – 958 .
- Hurtt , G. C. , Rosentrater , L. , Frolking , S. and Moore , B. III . 2001 . Linking remote-sensing estimates of land cover and census statistics on land use to produce maps of land use of the conterminous United States . Global Biogeochemical Cycles , 15 : 673 – 685 .
- Joint Research Center, 2002, Global Land Cover 2000 (GLC2000). Available online at: http://www-gvm.jrc.it/glc2000/
- Joint Research Center, 2006, CLC2000. Corine Land Cover 2000. Available online at: http://terrestrial.eionet.europa.eu/CLC2000 . European Commission
- Jones , L. , Griggs , L. and Fredricksen , L. 2000 . Envrionmental Indicators , 4th , Vancouver : The Fraser Institute .
- Jung , M. , Henkel , K. , Herold , M. and Churkina , G. 2006 . Exploiting synergies of global land cover products for carbon cycle modeling . Remote Sensing of Environment , 101 : 534 – 553 .
- Kates , R. W. , Clark , W. C. , Corell , R. , Hall , J. M. , Jaeger , C. C. , Lowe , I. , Mccarthy , J. J. , Schellnhuber , H. J. , Bolin , B. , Dickson , N. M. , Faucheux , S. , Gallopin , G. C. , Grübler , A. , Huntley , B. , Jäger , J. , Jodha , N. S. , Kasperson , R. E. , Mabogunje , A. , Matson , P. A. , Mooney , H. A. , Moore , B. III , O'Riordan , T. and Svedin , U. 2001 . Sustainability science . Science , 292 : 641 – 642 .
- Kerr , J. T. and Cihlar , J. 2003 . Land use and cover with intensity of agriculture for Canada from satellite and census data . Global Ecology and Biogeography , 12 : 161 – 172 .
- Kimble , J. M. , Follett , R. F. and Lal , R. 2001 . “ Introduction: The characteristics and extent of U.S. grazing lands ” . In The Potential of U.S. Grazing Lands to Sequester Carbon and Mitigate the Greenhouse Effect , Edited by: Follett , R. F. , Kimble , J. M. and Lal , R. 3 – 20 . Boca Raton : Lewis Publishers .
- Klein Goldewijk , K. 2001 . Estimating global land use change over the past 300 years: the HYDE Database . Global Biogeochemical Cycles , 15 : 417 – 433 .
- Krausmann , F. 2004 . Milk, manure and muscular power. Livestock and the industrialization of agriculture . Human Ecology , 32 : 735 – 773 .
- Kruska , R. L. , Reid , R. S. , Thornton , P. K. , Henninger , N. and Kristjanson , P. M. 2003 . Mapping livestock-oriented agricultural production systems for the developing world . Agricultural Systems , 77 : 39 – 63 .
- Lambin , E. F. , Geist , H. and Rindfuss , R. R. 2006 . “ Introduction: Local processes with global impacts ” . In Land Use and Land Cover Change. Local Processes and Global Impacts , Edited by: Lambin , E. F. and Geist , H. J. 1 – 8 . Berlin, Heidelberg : Springer .
- Lambin , E. F. , Turner , B. L. I. , Geist , H. J. , Agbola , S. B. , Angelsen , A. , Bruce , J. W. , Coomes , O. T. , Dirzo , R. , Fischer , G. , Folke , C. , George , P. S. , Homewood , K. , Imbernon , J. , Leemans , R. , Li , X. , Moran , E. F. , Mortimore , M. , Ramakrishnan , P. S. , Richards , J. F. , Skanes , H. , Steffen , W. , Stone , G. D. , Svedin , U. , Veldkamp , T. A. , Vogel , C. and Xu , J. 2001 . The causes of land-use and land-cover change: moving beyond the myths . Global Environmental Change , 11 : 261 – 269 .
- Lamprey , H. F. 1983 . “ Pastoralism yesterday and today: the overgrazing problem ” . In Tropical Savannas. Ecosystems of the World 13 , Edited by: Bourliere , F. 643 – 666 . Amsterdam : Elsevier Scientific Publishing Company .
- Le Houerou , H. N. 1989 . The Grazing Land Ecosystems of the African Sahel , New York : Springer .
- Leff , B. , Ramankutty , N. and Foley , J. A. 2004 . The geographic distribution of major crops across the world . Global Biogeochemical Cycles , 18 ( 1 ) doi: 10.1029/2003GB002108.
- Loveland , T. R. and Belward , A. S. 1997 . The IGBP-DIS global 1km land cover data set, DISCover: first results . International Journal of Remote Sensing , 18 : 3289 – 3295 .
- Loveland , T. R. , Reed , B. C. , Brown , J. F. , Ohlen , D. O. , Zhu , Z. , Yang , L. and Merchant , J. W. 2000 . Development of a global land cover characteristics database and IGBP DIScover from 1 km AVHRR data . International Journal of Remote Sensing , 21 : 1303 – 1330 .
- LP DAAC, 2007, MODIS/Terra Vegetation Continuous Fields Yearly L3 Global 500m ISIN Grid (MOD44B). Available online at: http://edcdaac.usgs.gov/modis/mod44b.asp . Land Processes Distributed Active Archive Center
- Mather , A. S. 2005 . Assessing the world's forests . Global Environmental Change Part A , 15 : 267 – 280 .
- Matthews , E. 2001 . Understanding the FRA 2000. Forest Briefing No. 1 , Washington, D.C. : World Resources Institute .
- Matthews , H. D. , Weaver , A. J. , Eby , M. and Meissner , K. J. 2003 . Radiative forcing of climate by historical land cover change . Geophysical Research Letters , 30 ( 1055 ) doi:1029/2002GL016098.
- Mayaux , P. , Holmgren , P. , Achard , F. , Eva , H. , Stibig , H. and Branthomme , A. 2005 . Tropical forest cover change in the 1990s and options for future monitoring . Philosophical Transactions of the Royal Society B: Biological Sciences , 360 ( 1454 ) : 373 – 384 .
- McGuire , A. D. , Sitch , S. , Clein , J. S. , Dargaville , R. , Esser , G. , Foley , J. A. , Heimann , M. , Joos , F. , Kaplan , J. , Kicklighter , D. W. , Meier , R. A. , Melillo , J. M. , Moore , B. III , Prentice , I. C. , Ramankutty , N. , Reichenau , T. , Schloss , A. , Tian , H. , Williams , L. J. and Wittenberg , U. 2001 . Carbon balance of the terrestrial biosphere in the twentieth century: analyses of CO2, climate and land-use effects wieht four process-based ecosystem models . Global Biogeochemical Cycles , 15 : 183 – 206 .
- McNaughton , S. J. , Oesterheld , M. , Frank , D. A. and Williams , K. J. 1989 . Ecosystem-level patterns of primary productivity and herbivory in terrestral habitats . Nature , 341 : 142 – 144 .
- Meyer , W. B. and Turner , B. L. I. 1992 . Human population growth and global land-use/cover change . Annual Review of Ecological Systems , 23 : 39 – 61 .
- Millenium Ecosystem Assessment . 2005 . Ecosystems and Human Well-Being, Synthesis , Washington, D.C. : Island Press .
- Miteva, B., 2001, Built-Up Land. Sage Atlas of the biosphere . Available online at: http://www.sage.wisc.edu/atlas/maps.php . Center for Sustainability and the Global Environment (SAGE), Institute for Environmental Studies, University of Wisconsin–Madison
- Monfreda , C. , Ramankutty , N. and Foley , J. A. forthcoming . Farming the planet, Part 2: The geographic distribution of crop areas and yields in the year 2000 . Global Biogeochemical Cycles. ,
- Noble , I. , Apps , M. , Houghton , R. , Lashof , D. , Makundi , W. , Murdiyarso , D. , Murray , B. , Sombroek , W. and Valentini , R. 2000 . “ Implications of different defintions and generic issues ” . In Land Use, Land-use Change and Forestry , Edited by: Watson , R. T. , Noble , I. R. , Bolin , B. , Ravindranath , N. H. , Verardo , D. J. and Dokken , D. J. 53 – 126 . Cambridge : Cambridge University Press .
- Oesterheld , M. , Sala , O. E. and McNaughton , S. J. 1992 . Effect of animal husbandry on herbivore-carrying capacity at a regional scale . Nature , 356 : 234 – 236 .
- Olson , J. S. , Watts , J. A. and Allison , L. J. 1983 . Carbon in Live Vegetation of Major World Ecosystems , Oak Ridge, TN : Oak Ridge National Laboratory .
- Prasad , A. M. , Iverson , L. R. and Liaw , A. 2006 . Newer classification and regression tree techniques: bagging and random forests for ecological prediction . Ecosystems , 9 : 181 – 199 .
- Ramankutty , N. 2004 . Croplands in West Africa: a geographically explicit data set for use in models . Earth Interactions , 8 : 1 – 22 .
- Ramankutty , N. and Foley , J. A. 1998 . Characterizing patterns of global land use: an analysis of global croplands data . Global Biogeochemical Cycles , 12 : 667 – 685 .
- Ramankutty , N. and Foley , J. A. 1999 . Estimating historical changes in global land cover: croplands from 1700 to 1992 . Global Biogeochemical Cycles , 13 : 997 – 1027 .
- Ramankutty , N. , Graumlich , L. , Achard , F. , Alves , D. , Chhabra , A. , Defries , R. S. , Foley , J. A. , Geist , H. , Houghton , R. A. , Klein Goldewijk , K. , Lambin , E. , Millington , A. , Rasmussen , K. , Reid , R. S. and Turner , B. L. II . 2006 . “ Global land-cover change: recent progress, remaining challenges ” . In Land-use and Land-cover Change. Local Processes and Global Impacts , Edited by: Lambin , E. F. and Geist , H. J. 9 – 39 . Berlin, Heidelberg : Springer .
- Ramankutty , N. , Evan , A. T. , Monfreda , C. and Foley , J. A. forthcoming . Farming the planet, Part 1: The geographic distribution of global agricultural lands in the year 2000 . Global Biogeochemical Cycles. ,
- Rindfuss , R. R. , Walsh , S. J. , Turner , B. L. I. , Fox , J. M. and Mishra , V. 2004 . Developing a science of land change: challenges and methodological issues . Proceedings of the National Academy of Science , 101 : 13 976 – 13 . 981
- SAGA, 2006, SAGA—System for Automated Geoscientific Analyses. Available online at: http://www.saga-gis.org
- Sala , O. E. , Chapin , F. S. III , Armesto , J. J. , Berlow , E. , Bloomfield , J. , Dirzo , R. , Huber-Sannwald , E. , Huennecke , L. F. , Jackson , R. B. , Kinzig , A. , Leemans , R. , Lodge , D. M. , Mooney , H. A. , Oesterheld , M. , Poff , N. L. , Sykes , M. T. , Walker , B. , Walker , M. and Wall , D. H. 2000 . Global biodiversity scenarios for the year 2100 . Science , 287 : 1770 – 1774 .
- Sanderson , E. , Jaiteh , M. , Levy , M. , Redford , K. , Wannebo , A. and Woolmer , G. 2002 . The human footprint and the last of the wild . BioScience , 52 : 891 – 904 .
- Siebert , S. , Döll , P. , Hoogeveen , J. , Faures , J. -M. , Frenken , K. and Feick , S. 2005a . Development and validation of the global map of irrigation areas . Hydrology and Earth System Sciences , 9 : 535 – 547 .
- Siebert, S., Feick, S., Döll, P. and Hoogeveen, J., 2005b, Global map of irrigation areas version 3.0. Available online at: http://www.fao.org/ag/agl/aglw/aquastat/irrigationmap/index.stm (Frankfurt a. Main, Rome: University of Frankfurt, FAO).
- Sitch , S. , Smith , B. , Prentice , I. C. , Arneth , A. , Bondeau , A. , Cramer , W. , Kamplan , J. O. , Levis , S. , Lucht , W. , Sykes , M. T. , Thonicke , K. and Venevsky , S. 2003 . Evaluation of ecosystem dynamics, plant geography and terrestrial carbon cycling in the LPJ dynamic global vegetation model . Global Change Biology , 9 : 161 – 185 .
- Small , C. 2004 . Global population distribution and urban land use in geophysical parameter space . Earth Interactions , 8 ( 8 ) : 1 – 18 .
- Statistics Bureau Japan . 2006 . Japan Statistical Yearbook , Tokyo : Statistical Bureau and Statistical Research and Training Institute, MIC .
- Steffen , W. , Sanderson , A. , Tyson , P. D. , Jäger , J. , Matson , P. A. , Moore , B. III , Oldfield , F. , Richardson , K. , Schellnhuber , H. J. , Turner , B. L. II and Wasson , R. J. 2004 . Global Change and the Earth System. A Planet Under Pressure , Berlin : Springer .
- Stolbovoi, V. and McCallum, I., 2006, Land resources of Russia. Available online at: http://www.iiasa.ac.at/Research/FOR/russia_cd/index.htm . IIASA—International Institute for Applied System Analysis
- Tegen , I. , Werner , M. , Harrision , S. P. and Kohfeld , K. E. 2004 . Relative importance of climate and land use in determining present and future global soil dust emission . Geophysical Research Letters , 31 : L05105 (doi:10.1029/2003GL019216)
- Thongmanivong , S. 2004 . “ Sustainable use of land and natural resources in Lao PDR. Material energy flow accounting, human appropriation of net primary production ” . PhD thesis, University of Vienna .
- Tilman , D. , Cassman , K. G. , Matson , P. A. , Naylor , R. and Polasky , S. 2002 . Agricultural sustainability and intensive production practices . Nature , 418 : 671 – 677 .
- Turner , B. L. I. , Moss , R. H. and Skole , D. L. 1993 . Relating Land Use and Global Land-Cover Change: A Proposal for an IGBP-HDP Core Project , Stockholm : IGBP Report No. 24, HDP Report No. 5 .
- U.S. Census Bureau . 2006 . Statistical Abstract of the United States , Washington, D.C. : US Department of Commerce, Bureau of the Census .
- UN . Forest Resources of Europe, CIS, North America, Australia, Japan and New Zealand (industrialized temperate/boreal countries) . UN-ECE/FAO Contribution to the Global Forest Resources Assessment 2000. Main Report ECE/TIM/SP/17 . 2000 . (New York, Geneva: United Nations Publications).
- UNSD, 2006, Composition of macro geographical (continental) regions, geographical sub-regions, and selected economic and other groupings. Available online at: http://unstats.un.org/unsd/methods/m49/m49regin.htm . United Nations Statistical Division
- Visser , H. and De Nijs , T. 2006 . The map comparison kit . Environmental Modelling & Software , 21 : 346 – 358 .
- Vitousek , P. M. , Ehrlich , P. R. , Ehrlich , A. H. and Matson , P. A. 1986 . Human Appropriation of the Products of Photosynthesis . BioScience , 36 : 363 – 373 .
- Vitousek , P. M. , Mooney , H. A. , Lubchenco , J. and Melillo , J. M. 1997 . Human domination of Earth's ecosystems . Science , 277 : 494 – 499 .
- White , R. , Murray , S. and Rohweder , M. 2000 . Grassland Ecosystems. Pilot Analysis of Global Ecosystems , Washington, D.C. : World Resources Institute .
- Whittaker , R. H. and Likens , G. E. 1973 . Primary production: the biosphere and man . Human Ecology , 1 : 357 – 369 .
- Wood , C. H. and Skole , D. L. 1998 . “ Linking satellite, census, and survey data to study deforestation in the Brazilian Amazon ” . In People and Pixels, Linking Remote Sensing and Social Science , Edited by: Liverman , D. , Moran , E. F. , Rindfuss , R. R. and Stern , P. C. 70 – 93 . Washington, D.C. : National Academy Press .
- Wood , S. , Sebastian , K. and Scherr , S. J. 2000 . Pilot Analysis of Global Ecosystems: Agroecosystems , Washington, D.C. : International Food Policy Research Institute and World Resources Institute .
- WRI . 2004 . World Resources 2002–2004. Decisions for the Earth: Balance, Voice, and Power , Washington, D.C. : World Resources Institute .
- Young , A. 1999 . Is there really spare land? A critique of estimates of available cultivable land in developing countries . Environment, Development and Sustainability , 1 : 3 – 18 .
6. Appendix
Table A1. National land use area estimates and comparison with statistical census data. [1] = our estimate
Figure A1. Comparison of cropland estimates for West Africa. (a) Agricultural land cover according to the GLC2000, (b) cropland map of Ramankutty and Foley Citation(1999), (c) cropland map of Ramankutty Citation(2004), and (d) our cropland result. The adjustment of the cropland extent in our data (d) to national census data () is based on map (b) and results in discernible national boundaries. The result is similar to the pattern in map (c) which approximates (but does not reproduce) FAO cropland data on the national level. Note the disparities of all three cropland maps (b,c,d) with the GLC land cover map (a). We conclude that a satisfactory representation of cropland in that region remains elusive. (Available in colour online)