
ABSTRACT
In this paper, we explored how aridity influences the regional deforestation and land-use patterns (i.e. crops/pastures) in South American Dry Chaco. To do this, we contrasted land use during last decade (2001–2012) with a spatially explicit aridity index, which we complemented with a crop water balance model. Land-use classifications were performed by considering the temporal variability of NDVI from MODIS satellites, showing that 40 and 60% of deforested land was assigned to crops and pastures, respectively. Results indicate that although the regional deforestation pattern was not associated with the aridity gradient, with drier areas similarly deforested as wetter areas, contrasting differences were observed in the use of this land, with crops mostly located (90%) in wetter areas and pastures evenly distributed across the whole aridity gradient. This research highlighted the strong effect of water limitations on the land-use option after deforestation and may help to set the basis for future land-use planning policies.
1. Introduction
As a consequence of global needs for food, most semiarid and subhumid lands in the world display active agriculture frontiers (Lambin et al., Citation2013; Millennium Ecosystem Assessment, Citation2005; Ramankutty, Evan, Monfreda, & Foley, Citation2008) in which deforestation for rainfed agriculture is the main land-cover change (Baldi & Jobbágy, Citation2012; Hansen et al., Citation2013). Although the location of these land transformations is relatively well known (Hansen et al., Citation2013), a key and poorly understood aspect of deforestation is the role of water availability as a climatic constraint for alternative land-use choices. Global modelling studies have recognized the relationship between this climate constraint and the potential of land to grow crops (Leemans & Solomon, Citation1993; Ramankutty, Foley, Norman, McSweeney, & McSweeney, Citation2002). However, as grain crop production is not the only purpose of deforested lands, these types of studies are not enough to fully understand current land-use transformation patterns (Ramankutty et al., Citation2002). In this paper, we analysed land-use patterns of deforested lands along a semiarid to subhumid gradient with the aim to understand how water availability influences the expansion of the two main land-use alternatives (i.e. grain crop and pasture production). This information can be useful to understand and anticipate potential environmental impacts of ongoing transformations, as well as to design land-use policies based on regional biophysical variability (Wright & Wimberly, Citation2013).
The two main land uses of deforested areas are grain production systems based mostly on annual crops and pasture production systems based on perennial pastures and grasslands (Connor, Loomis, & Cassman, Citation2011; Foley et al., Citation2005). The main difference between grain and pasture production is that while pasture production aims to maximize vegetative growth (leaves, stems), grain production aims to maximize the reproductive growth (seeds) (Connor et al., Citation2011). Another important issue is that pastures usually are multi-specific communities, while crops are mostly monospecific systems. These differences seem trivial but are critical when considering the influence of water constraints on their physiological processes. For example, grassland/pasture productivity typically displays a linear relationship with precipitation (PPT) along a wide annual rainfall range (200–1400 mm y−1) (Sala, Citation2001). In contrast, grain crop yields usually are strongly dependent on water availability during a specific part of their life cycle (usually around flowering, grain setting and beginning of grain-filling period) frequently called the critical period (Andrade & Sadras, Citation2000; Dardanelli, Collino, Otegui, & Sadras, Citation2008; Maddonni, Citation2012; Nix & Fitzpatrick, Citation1969). During this period, droughts reduce yields abruptly and may turn agriculture unfeasible (Andrade & Sadras, Citation2000; Andriani, Andrade, Suero, & Dardanelli, Citation1991; Dardanelli, Suero, Andrade, & Andriani, Citation1991). These differences suggest a greater influence of water limitation on the regional distribution of grain crops than in pasture systems.
The influence of water availability on land productivity has usually been assessed using the annual rainfall amount (PPT) (Grau, Gasparri, & Aide, Citation2005; Lambin et al., Citation2013). However, when large areas are analysed, the atmospheric water demand (i.e. potential evapotranspiration, PET) can vary significantly in the spatial dimension, affecting water availability beyond rainfall pattern (Lobell et al., Citation2013). Under this condition, the aridity index (ratio between annual PPT and annual PET) may improve the water availability assessment (e.g. Nosetto, Jobbágy, Toth, & Jackson, Citation2008). Although these climatic variables are useful to understand the long-term influence of water availability on land-use patterns and vegetation functioning (Sohoulande Djebou, Singh, & Frauenfeld, Citation2015; Vicente-Serrano, Cuadrat-Prats, & Romo, Citation2006), they do not consider seasonality effects nor the effect of other biophysical controls (e.g. water holding capacity of soils, crop type and management) which are central to understanding water constraints on grain production systems (Dardanelli et al., Citation2008; Ramankutty et al., Citation2002). In this sense, the water balance during the crop critical period, estimated, for example, from the crop water stress index (CWSI), has been strongly associated to the yield of annual grain crops (Calviño & Monzon, Citation2009; Calviño, Sadras, & Andrade, Citation2003; Dardanelli et al., Citation2008; Giménez, Mercau, Houspanossian, & Jobbágy, Citation2015).
With an extension of 60.3 Mha, the semiarid and subhumid Chaco in southern South America is one of the few regions of the world that still has a high proportion (~70%) of its surface covered by native dry forests (Guyra Paraguay, Citation2013; Vallejos et al., Citation2015). However, high deforestation rates have been registered during the last three decades as a consequence of the strong transformation pressure imposed by the global demand for food (FAO, Citation2010; Vallejos et al., Citation2015). Annual crops such as soybean, maize, wheat and barley for grain production (Grau et al., Citation2005; Grau, Gasparri, & Aide, Citation2008) and perennial pastures, mainly Panicum maximum cv. Gatton and Cenchrus ciliaris, for pasture production (Glatzle, Citation2004) are the main land uses of deforested areas (Baldi, Houspanossian, Murray, Rueda, & Jobbágy, Citation2015). Given the still large area of native dry forests and the growing demand for commodities (Grau et al., Citation2008), a better knowledge of how land use interacts with water availability would be critical to predict changes in ecological goods and services (Viglizzo, Paruelo, Laterra, & Jobbágy, Citation2012; Volante, Alcaraz-Segura, Mosciaro, Viglizzo, & Paruelo, Citation2012).
In this paper, we evaluated how aridity has influenced the land uses (annual crops vs. pastures) of deforested areas in the Dry Chaco. Our hypothesis is that given the physiological and ecological differences between vegetation types, the expansion of grain crops is more constrained by water availability than that of pastures. To address this, we performed land-use classifications over deforested areas and we analysed the relationship between the expansion of pastures and annual crops with water availability based on the aridity index. This analysis was performed for two periods during the last decade of farming expansion (2001/2002 and 2012/2013). Deforested areas were identified from the most updated publicly available forest land-cover data sets (Guyra Paraguay, Citation2013; Hansen et al., Citation2013; Huang et al., Citation2007; UMSEF, Citation2008; Vallejos et al., Citation2015) including total deforestation registered up to 2001 and up to 2012. The distinction between crops and pastures was made from supervised classifications of moderate-resolution imaging spectroradiometer (MODIS) satellite images of normalized difference vegetation index (NDVI) (Clark, Aide, Grau, & Riner, Citation2010). Furthermore, in order to deepen the analysis about the influence of aridity on grain production and to roughly assess the potential expansion of this land use in the region, we analysed the relationship between crop expansion and the CWSI computed from a regional water balance model (Giménez et al., Citation2015).
2. Materials and methods
2.1. Description of the study region
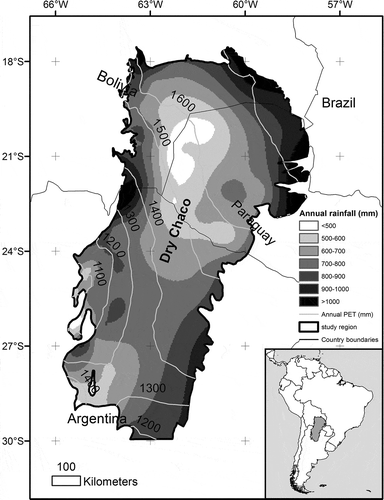
The Dry Chaco region is a vast sedimentary plain that covers 61.3 Mha in the north-central part of Argentina, Southeast of Bolivia and western Paraguay (Olson et al., Citation2001) (). The region presents a monsoonal climate with a strong rainfall seasonality (dry winters, rainy summers) (Minetti, Citation1999). Mean annual temperature increases from south to north, varying from 18 to 21°C (Minetti, Citation1999). Annual rainfall (PPT) is highly variable decreasing from the east and west edges to the centre of the region, from about 1000 to 500 mm y−1 (), and there is a general negative trend in rainfall amounts between 1980 and 2007 (González, Dominguez, & Nuñez, Citation2012). Annual PET has a latitudinal gradient between 1100 mm y−1 in the south and 1700 mm y−1 in the north, encompassing therefore a wide water balance gradient (values of 0.3<PPT:PET<0.8), including semiarid (0.3–0.5) and dry subhumid (0.5–0.8) conditions. Vegetation is exposed to soil moisture deficit and frosts in the dry season and high summer temperatures and drought spells during part of the wet season. Soils are derived from massive accumulation of fine loess and alluvial sediments during the Quaternary period (Pennington, Prado, & Pendry, Citation2000). They present relatively high fertility levels (Riveros, Citation2003), loamy texture (coarser to the west, smoother to the east) and deep soil profiles without physical impediments to root growth. The water table is usually salty and variable in depth (Giménez et al., Citation2015).
Figure 1. Map of the study region, showing the distribution of the South American Dry Chaco. Mean annual rainfall (in mm, grey shaded area) and mean annual potential evapotranspiration (in mm, PET, white isolines) are shown. Climatic data (1959–2002) were obtained from a 30-minute meteorological database (CRU-UEA, New, Lister, Hulme, & Makin, 2002).
Native vegetation is dominated by broadleaf, deciduous or semi-deciduous forests, classified as subtropical dry forests (Gentry, Citation1995). As a consequence of fire and grazing history among other causes, some areas have become open savannahs or dense woodlands (Dussart, Lerner, & Peinetti, Citation1998). Currently, there are large continuous areas of natural or semi-natural vegetation (Vallejos et al., Citation2015), where dominant economic activities are extensive cattle ranching, charcoal extraction and selective logging (Gasparri & Grau, Citation2009; Rueda, Baldi, Verón, & Jobbágy, Citation2013). Soybean is the dominant grain crop, followed by maize, which is sown from spring (October–November) to early summer (mid-January). Winter crops (wheat and barley) are also common but less extensive (Calviño, Andrade, & Sadras, Citation2003; Calviño & Monzon, Citation2009). Most grain crop systems apply no-till sowing and use transgenic seed varieties, herbicides and fertilizers (Devani, Ploper, & Pérez, Citation2006). Livestock systems involve the use of grasslands (post clearing) and implanted pastures adapted to the region (Glatzle, Citation1999, Citation2004). In Argentina, these production systems have their origin and imprint in the mixed – rainfed crops and pastures – schemes of the Pampas (Viglizzo et al., Citation2011). By contrast in Paraguay, livestock systems widely prevail as the main production activity, based mainly on rainfed implanted pastures (Caldas, Goodin, Sherwood, Campos Krauer, & Wisely, Citation2015; Glatzle, Citation1999).
2.2. Land-cover and land-use map for 2001 and 2012
We developed a deforestation map updated to year 2012 based on the most updated publicly available land-cover data sets (Guyra Paraguay, Citation2013; Hansen et al., Citation2013; Huang et al., Citation2007; UMSEF, Citation2008; Vallejos et al., Citation2015) (Figure S1, left). This information was resized to 30 m (which is the spatial resolution of most databases), and we considered a pixel as deforested when it was classified as deforested in at least one of the different databases. For the 2001 deforestation map, we used the global forest cover loss product (2001–2012) from Hansen et al. (Citation2013), and we subtracted both maps (Figure S1, left; grey colours).
Deforested plots smaller than 750 × 750 m2 (562,500 m2) were considered as ‘not considered areas’ given their difficulty for classification process. In this class were also included those territories that displayed physical restrictions to agriculture (i.e. frequently flooded or high-salinity territories and high-slope territories). The location of these areas was obtained from external databases of flooded areas, water bodies and regional soils data maps (Brakenridge, Kettner, Slayback, & Policelli, Citation2011; Dijkshoorn, Huting, & Tempel, Citation2005; REDIEX, Citation2009) and regional digital elevation model (USGS, Citation2004).
We differentiated grain crops from pastures in deforested areas for each period (2001/2002 and 2012/2013; hereafter land use for 2001 and 2012, respectively) based on the different phenological signatures of each land use (Clark et al., Citation2010). To do this, we used MODIS NDVI images (MOD13Q1 product, ~250 m spatial resolution) from June 2001 (and 2012) to May of the following year in each case, considering only high-reliability pixels (using quality product flags). We performed supervised ‘maximum likelihood’ classifications in deforested areas utilizing field control points obtained from Google Earth (GE, www.earth.google.com) following Clarks et al.’s (Citation2010) methodology. We selected 2000 random control points (see supplementary material) at least 1000 m apart. We displayed and visualized selected points in GE and discarded those points with no high-resolution imagery. GE high-resolution images taken before 2003 were used for 2001 classification and images taken between 2012 and 2014 for the 2012 classification. For each control point and at each pixel centre, we generated a 250 × 250 m2 (62,500 m2) representing the MOD13Q1 pixel, and we sub-gridded it in 5 × 4 rows and columns, respectively (Figure S2). Within each sample grid, we estimated the percent cover of three classes of land use (dry forests and savannahs, pastures, croplands) considering increments of 5%. Only those grids with percent cover of the same class greater than 80% were used in the analysis. This process, which is fully described in Clark et al. (Citation2010), has proved to present a high spatial accuracy between points selected in GE and points acquired using global positioning system (Clark et al., Citation2010). After this processing, a total of 1252 control points were collected (314 of croplands, 366 of pastures and 572 of forest) (Figure S1, left). Half of the control points of croplands and pastures were used to perform the classification over deforested lands and the other half (including all control points of dry forests and savannahs) were used to test classification errors using a confusion matrix () (Congalton, Citation1991).
Table 1. Confusion matrix for land-use classifications showing user’s and producer’s accuracies. Results of supervised classifications for 2012 and 2001 (within parentheses) are shown.
2.3. Aridity index and crop water stress index
We calculated the spatially explicit aridity index as the ratio between mean annual PPT and mean annual PET. PET was computed using the FAO Penman–Monteith equation (Allen, Pereira, Raes, & Smith, Citation1998) with climatic data from the 30-minute meteorological database (CRU-UEA, New et al., 2002). This database represents average monthly meteorological data (air temperature, wind, sunshine and PPT) for the period 1959–2002.
We calculated the CWSI (Equation 1) using a regional crop water balance model (Giménez et al., Citation2015) and the meteorological database described above. In this model, the soil water available for crop evapotranspiration is computed on a monthly time step by adding water (AW) inputs (i.e. PPT) and deducing water losses (i.e. run-off, evapotranspiration and deep percolation) from the AW of the previous month. The model was parameterized considering a late summer crop scheme which is the most water conservative cropping strategy used in region (Giménez et al., Citation2015; Maddonni, Citation2012). This corresponds to either a soybean or a maize crop sown in late December, with the critical period for grain production occurring in March–April months. Maps of CWSI for several cropping schemes can be found in Giménez et al. (Citation2015). The CWSI was calculated as follows:
where n and m are the initial and final months of the critical period. AWi is the soil water availability which varied according to the soil type and previous month water balance, Pefi is the effective PPT and ETi is the actual evapotranspiration, for the i months of the critical period. ETi = PETi × Kci, PETi being the PET and Kci the crop coefficient in the i months of critical period. Kci was set according to the expected leaf area and stage of development of the corresponding crops scheme (Giménez et al., Citation2015).
Three measures of CWSI were estimated for each grid cell: (i) mean CWSI (i.e. average stress for the period 1952–2002), (ii) the 80th percentile and (iii) the drought frequency (i.e. the numbers of years with CWSI >0.3).
2.4. Data analysis
In order to analyse the relationship between land use/land cover and the climatic indexes, we converted land-cover and land-use data (for each period, developed in Section 2.2) and the climatic indexes maps (developed in Section 2.3) into raster square grids with a spatial resolution of 10,000 ha. We then compared with an unpaired Student’s t-test the difference (p < 0.05) in mean aridity index of the land occupied by both land uses in 2001 and the new expanded land (occupied between 2001 and 2012).
3. Results
3.1. Changes in land cover and land use between 2001 and 2012
Total agricultural land area in 2001 was 6.9 Mha, with 78% classified as pastures and 22% as annual crops (). A decade later, this area increased to 12.5 Mha, with 62% classified as pastures and 38% as croplands. The total area with land-cover/land-use changes during this period approached 7.0 Mha, resulting from 5.6 Mha of dry forests that were deforested and 1.4 Mha of already deforested areas that showed land-use changes (e.g. from pasture to crops). The increase in the crop area (3.5 Mha) during the study period came from newly deforested areas (58%) and previously deforested areas devoted to pastures (41%). By contrast, the increase in the pasture area (3.7 Mha) occurred in new deforested regions.
Figure 2. Land-use classifications for years 2001 and 2012 in the Dry Chaco. The areas classified as crops and pastures during 2001 and 2012, as well as the areas that changed from pastures (2001) to crops (2012), are indicated. Areas changing from croplands (2001) to pastures (2012) were not observed. The areas not considered in the analysis corresponded to water bodies, frequently flooded areas and high-slope terrains.
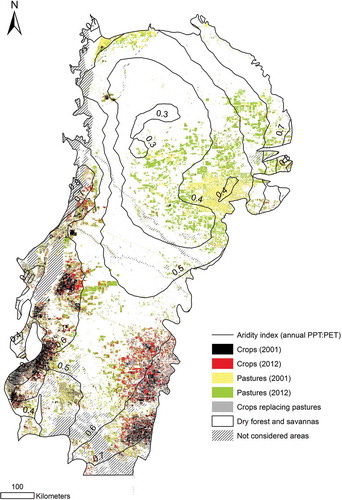
The territory with physical restrictions to agriculture approached 4.4 Mha, which corresponds to frequently flooded areas (55%) and terrains with high slope (45%, ‘not considered areas’, in ). Deforested plots smaller than 750 × 750 m2 (562,500 m2) approached 0.6 Mha (‘not considered areas’, in ). The current territory of dry forest and savannahs without strong physical restrictions to agriculture totalized 43.4 Mha.
3.2. Land-use patterns and aridity gradient in Dry Chaco
The overall deforestation pattern showed no clear association with the aridity gradient. Wetter areas (PPT:PET> 0.55) were just slightly more deforested (62% of total deforested areas) than drier regions (PPT:PET< 0.55; 38% of total deforested areas) (). However, contrasting differences were observed between the regional expansion of crops and pastures. While annual crops were mostly located in humid areas (90% in areas with PPT:PET> 0.55), pastures were evenly distributed across the entire aridity gradient. Consequently, grain crops predominate over pastures in the wetter parts of the region, while deforested lands in drier zones were almost completely devoted to pastures ().
Figure 3. Relationship between land use and aridity index in the Dry Chaco. (a) Current distribution (i.e. 2012 classification) of crops, pastures and dry forests/savannahs across the aridity gradient. (b) Changes in pasture and crop areas between 2001 and 2012 across the aridity gradient (percentage of the area changed for each land use; 3.5 Mha in croplands and 5.1 Mha in pastures). (c) Box plot of aridity level distribution of grid cells occupied by crops and pastures in 2001 and the new crop and pasture areas developed between 2001 and 2012. The boxes represent first and third quartiles, and the whiskers show 5–95% intervals of results. The thick black line represents the median and the square represents the mean value.
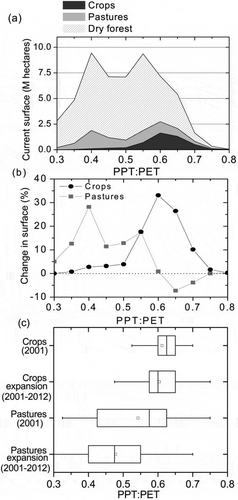
Considering the land-use/land-cover changes that occurred between 2001 and 2012, we found that 90% of the new crops (2.9 Mha) were located in areas with low (0.65–0.75, 1.6 Mha) and medium (0.55–0.65, 1.3 Mha) aridity levels (). Of this, almost one-third (1.4 Mha) involved the replacement of pastures by crops (). The expansion of new pastures during the study period was higher (2.3 Mha) in zones of high aridity levels (PPT:PET = 0.3–0.55) than in zones of medium and low aridity levels (PPT:PET = 0.55–0.75) (1.5 Mha). Compared to the crop area observed in 2001, the new crops (established between 2001 and 2012) were located in slightly drier regions (mean PPT:PET = 0.62 and 0.60 for 2001 and 2012 crop areas, respectively, p < 0.05) (). Pastures expanded towards drier areas as well, with an average level of aridity of 0.48 (for 2012 classification) and 0.55 (for 2001 classification) (p < 0.05) ().
3.3. Relationship between aridity and crop water stress
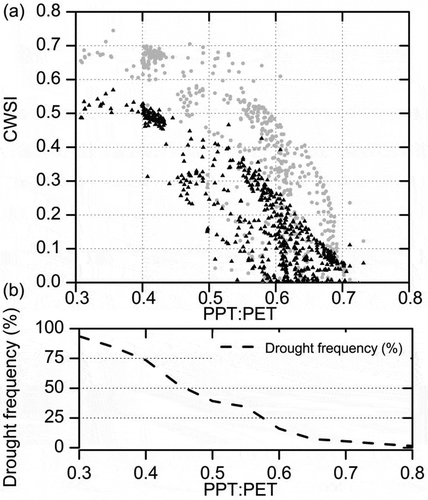
The aridity index and the CWSI were negatively associated (r2 = 073, p < 0.01), but at intermediate aridity conditions (PPT:PET = 0.5–0.6), the CWSI showed large variability. For instance, for an aridity level of 0.55, crop water deficit during the critical period (i.e. CWSI) may vary from 0 to 40% (). As expected, as the aridity of the territory increases, drought spells experienced by summer crops become more frequent and intense (). Under semiarid conditions (PPT:PET = 0.5–0.55), drought frequency (CWSI> 0.3) increased up to 35%, and they turned more intense (80th percentile of the CWSI> 0.6). This implies that only 40% of crop water needs in the critical period would be satisfied, and that this level of stress (or higher) would be reached in one every 5 years. Note that this relationship could change if other crop scheme (e.g. double cropping) with higher water use is modelled (Giménez et al., Citation2015).
Figure 4. Relationships between the aridity index (PPT:PET) and the crop water stress index (CWSI) in the Dry Chaco. (a) Mean CWSI (black triangles) and 80th (grey circles) percentile of CWSI, for the 43 years modelled (1959–2002), across the aridity gradient. Only grid cells where deforestation was higher than 20% were considered in this analysis. The CWSI for each grid cell was simulated considering a late summer cropping strategy. (b) Drought frequency across the aridity gradient. The mean drought frequency (for each aridity level) was estimated as the numbers of years for each grid cell with mean CWSI higher than 0.30 in relation to the total number of years modelled.
4. Discussion
Our study in the whole Dry Chaco region is the first that quantifies and maps the land uses (i.e. pastures or annual crops) of deforested areas and characterizes the relations of their expansion with climate. Previous land-cover/land-use maps developed for the Dry Chaco do not allow to discriminate between different herbaceous covers under anthropogenic use (Clark et al., Citation2010). Although it is generally thought that the expansion of grain crops (mostly soybean) is the main driver of deforestation in the Dry Chaco (Hoyos et al., Citation2013; Reboratti, Citation2010), our work demonstrated that the expansion of pastures was also an important factor of deforestation in the last decade (Caldas, et al., 2013; Glatzle, Citation2004), but it is important to consider that in some cases, pasture systems may not be the final trajectory post deforestation, and they can be switched to grain crops a few years later (Gasparri, Grau, & Sacchi, Citationin press). Currently, 60% and 40% of the deforested land in the region is devoted to grow pastures and annual crops, respectively. Additionally, the compilation of deforestation maps highlighted the high deforestation rates occurring in the region (~0.5 Mha yr−1), one of the highest observed worldwide (FAO, Citation2010). Notably, deforestation in the Dry Chaco was responsible for 12.5% of total deforestation observed in South America in the last decade (FAO, Citation2010).
Deforestation pattern was not associated with the aridity gradient of the region (Baldi & Jobbágy, Citation2012; Gasparri et al., Citationin press). On the contrary, the distribution of pastures and crops across the aridity gradient of the Dry Chaco showed notable differences between both land uses (). While grain crops predominated in areas of medium-to-low aridity conditions (0.55–0.75 aridity levels), pastures were evenly distributed across the whole aridity gradient, in agreement with local and cross-continental studies (Baldi et al., Citation2015; Baldi & Jobbágy, Citation2012; Hoyos et al., Citation2013; Ramankutty et al., Citation2002). This pattern seems to be related to the expected impacts that water deficits would have on grain crop and pasture productivities, respectively. As aridity increases, the water deficit during the crop critical period increases as well (), reducing crop yields drastically (Bannayan, Sanjani, Alizadeh, Lotfabadi, & Mohamadian, Citation2010). For example, wheat and barley yields decreased 50% in Iran when the aridity index fell below 0.45 (Bannayan et al., Citation2010). In addition, the higher atmospheric demand during extreme heat events, more frequent as aridity increases in territory, may also decrease crop yields (Lobell et al., Citation2013). Based on crop yield data at the department level (third administrative level) in Argentina, we found a significant decline in soybean and maize yields as the aridity increases (Fig. S3 in supplementary materials), evidencing the key role of water availability in the performance of crops in the region. By contrast, several studies have shown relatively good pasture productivity in arid and semiarid regions (Blanco, Aguilera, Paruelo, & Biurrun, Citation2008; Glatzle, Citation1999, Citation2004; Glatzle & Stosiek, Citation2002; Sohoulande Djebou et al., Citation2015). In addition, livestock systems present intrinsically more flexibility to cope with production risks in semiarid environments where water availability is not only scarce but also highly variable. For example, livestock systems allow the application of different management strategies during the course of the growing season, such as the adjustment of cattle density, the use of supplementary forages or deferred grazing in dry years, while little can be done to manage water scarcity once the crop is established (Connor et al., Citation2011).
In the last 12 years, agricultural frontier moved towards drier territories of the Chaco region. Although 90% of the new cropped land was located in intermediate and low aridity zones, this territory was on average drier than that of previously established grain crop systems ( and ). This result agrees with recent studies showing how the combination of changes in cropping technologies (e.g. crop cultivars resistant to insects, direct sowing), agribusiness forms of organization (e.g. long-scale farming corporations), crop management strategies (e.g. change from early summer to late summer sowing dates) and high grain prices (Gasparri, Grau, & Gutiérrez Angonese, Citation2013) allowed the establishment of grain crops in zones previously considered as marginal because of rainfall shortage (Grau et al., Citation2005; Maddonni, Citation2012; Viglizzo & Jobbágy, Citation2010). However, it is important to highlight that during periods of low grain prices, as the current, agriculture could become unprofitable in the more arid parts of region given the lower grain yields (Fig. S3), which can trigger new land-use/land-cover changes and move the agricultural frontier (Gasparri et al., Citation2013). Pastures are also exploring drier zones of the Chaco nowadays. In this case, the notable increase in the cattle-carrying capacity generated by implanted pastures compared to native dry forests (Blanco et al., Citation2008; Kunst et al., Citation2014) is probably a key factor. Interestingly, we observed a strong replacement of pastures by crops in the wetter parts of the region between 2001 and 2012 (), mimicking a similar process that took place two decades ago in the Pampas (Paruelo, Guerschman, & Verón, Citation2005). A higher profitability of grain crops compared to livestock systems in the most suitable areas for crop production would be the reason for this land-use change. Similar processes were recently observed in Brazilian Amazon (Gasparri et al., Citation2013; Gollnow & Lakes, Citation2014; Graesser, Aide, Grau, & Ramankutty, Citation2015; Macedo et al., Citation2012).
Although most studies use PPT data to understand water restrictions to cropping expansion, this single variable would not be sufficient for large regions which exhibit high PET contrasts. Considering, for example, an annual rainfall limit of 700 mm yr−1 for grain production in the Dry Chaco as proposed by Lambin et al. (Citation2013), the aridity index is determined to be 0.42 for the Paraguayan Chaco (PET = 1650 mm yr−1; 21ºS; 61ºW) and 0.61 for the southern part of the region (PET = 1150 mm yr−1; 29ºS; 62ºW). Although both regions have similar rainfall amount, the frequency and severity of droughts would be much higher in the Paraguayan site. This would explain why we found no significant relationship between grain yields and annual rainfall at the department level in Argentina, but a positive relationship with the aridity index (Fig S3, supplementary materials). Remarkably, the variability of grain yields was much better explained by the CWSI (r2 = 0.51 and 0.61 for maize and soybean respectively; Fig S3, supplementary materials), indicating that this index captures water limitation effects on crop performance in a better way. Probably, the seasonal dynamics of rainfall and evapotranspiration, among other non-climatic aspects (e.g. soil water holding capacity, crop type and cropping management), explain the better performance of this index (Giménez et al., Citation2015).
Since water availability is the major climate constraint for cropping in the Dry Chaco (Devani et al., Citation2006; Fatecha, Citation1989; Grau et al., Citation2005; Lambin et al., Citation2013; Viglizzo & Jobbágy, Citation2010), we can speculate about the potential expansion of grain crops in this region. Estimating the area without physical constraints and with similar or lower CWSI than the ones explored by crops at present, we estimated that 21.9 Mha (51%) of remnant dry forests and savannahs would be suitable for grain cropping. This estimation is ~20% lower than the one proposed by Lambin et al. (Citation2013) who used a rainfall threshold of 700 mm y−1 because of the different ways that annual rainfall and CWSI represent water limitations for grain crops, as explained previously. However, it is important to consider that changes in farming technologies and management practices may move the cropping frontier towards drier areas, as it happened in the last decade. It is also important to consider possible long-term trends in rainfall patterns which can move the agricultural frontier, particularly considering that strong rainfall fluctuations have been described in the region from the beginning of the nineteenth century based on dendrochronological studies (Ferrero & Villalba, Citation2009). In any case, since pastures were evenly distributed across the whole aridity gradient, there seems to be no water limitation for the expansion of cattle production in the Dry Chaco, denoting a high deforestation risk in the region.
Water restrictions in the Dry Chaco are partially segregating the different land-use options in the region, with grain crops prevailing in the wettest areas and pastures in the driest areas (). It is interesting to note that although this segregation seems coherent in productive and economics terms, there are potential environmental impacts of these land-cover transformations that may threaten the future productivity of lands. For instance, the hydrological impacts of deforestation are notably stronger with annual crops than with pastures (Amdan, Aragõn, Jobbágy, Volante, & Paruelo, Citation2013; Giménez et al., Citation2015; Nosetto, Jobbágy, Brizuela, & Jackson, Citation2012), given the lower evapotranspiration of the former. From this perspective, a balanced combination of annual crops, perennial pastures and dry forests would be required to minimize the hydrological impacts (Giménez et al., Citation2015; Lemaire, Franzluebbers, Carvalho, & Dedieu, Citation2014; Sadras, Roget, & Krause, Citation2003). So, in this sense, land-use planning in the region must explicitly consider not only the goods provided by the Dry Chaco ecosystems but also the different ecosystem services (e.g. water regulation) they provide in order to minimize potential environmental risks in a region undergoing rapid land-cover and land-use changes (Viglizzo et al., Citation2012; Volante et al., Citation2012).
5. Conclusions
This research highlighted the strong effect of water limitations on the land-use option after deforestation, and it may help to set the basis for future land-use planning policies. According to our results, aridity is restricting the expansion of grain crops in the Dry Chaco but does not influence the implantation of pastures or grasslands after deforestation. The higher water deficit of crops during the critical period towards semiarid areas would be the cause of this restriction. By contrast, the different risk management strategies available in livestock systems would allow the expansion of pastures across the whole Dry Chaco, highlighting the high vulnerability to deforestation of the region. However, since agricultural area expanded towards drier areas in the last decade, a better understanding about the sustainability of the productive systems in these new agricultural lands would be highly required. Besides deforestation, and similar to other deforestation foci around the world (Gasparri et al., Citation2013; Gollnow & Lakes, Citation2014; Graesser et al., Citation2015; Macedo et al., Citation2012), intense land-use changes (i.e. replacement of pastures by crops) were also identified in the last decade, highlighting that landscape configuration in the Dry Chaco is under rapid changes.
Supplementary_material_revised.docx
Download MS Word (714.8 KB)Acknowledgements
We thank PhD Victoria Marchesini for her helpful comments and critical reading of the manuscript.
Disclosure statement
No potential conflict of interest was reported by the authors.
Supplemental data
Supplemental data for this article can be accessed here.
Additional information
Funding
Related Research Data
References
- Allen, R. G., Pereira, L. S., Raes, D., & Smith, M. D. (1998). Crop evapotranspiration. Guidelines for computing crop water requirements. Rome: FAO.
- Amdan, M. L., Aragõn, R., Jobbágy, E. G., Volante, J. N., & Paruelo, J. M. (2013). Onset of deep drainage and salt mobilization following forest clearing and cultivation in the Chaco plains (Argentina). Water Resources Research, 49(10), 6601–6612. doi:10.1002/wrcr.20516
- Andrade, F. H., & Sadras, V. O. (2000). Efectos de la sequía sobre el crecimiento y rendimiento de los cultivos. In F. H. Andrade & V. O. Sadras (Eds.), Bases para el manejo del maíz, el girasol y la soja. Balcarce: Instituto Nacional de Tecnologia Agropecuaria.
- Andriani, J. M., Andrade, F. H., Suero, E. E., & Dardanelli, J. L. (1991). Water deficits during reproductive growth of soybeans. I. Their effects on dry matter accumulation, seed yield and its components. Agronomie, 11, 737–746.
- Baldi, G., Houspanossian, J., Murray, F., Rueda, C. V., & Jobbágy, E. G. (2015). Cultivating the dry forests of South America: Diversity of land users and imprints on ecosystem functioning. Journal of Arid Environments. doi:10.1016/j.jaridenv.2014.05.027
- Baldi, G., & Jobbágy, E. G. (2012). Land use in the dry subtropics: Vegetation composition and production across contrasting human contexts. Journal of Arid Environments, 76, 115–127. doi:10.1016/j.jaridenv.2011.08.016
- Bannayan, M., Sanjani, S., Alizadeh, A., Lotfabadi, S., & Mohamadian, A. (2010). Association between climate indices, aridity index, and rainfed crop yield in northeast of Iran. Field Crops Research, 118(2), 105–114. doi:10.1016/j.fcr.2010.04.011
- Blanco, L. J., Aguilera, M. O., Paruelo, J. M., & Biurrun, F. N. (2008). Grazing effect on NDVI across an aridity gradient in Argentina. Journal of Arid Environments, 72(5), 764–776. doi:10.1016/j.jaridenv.2007.10.003
- Brakenridge, G. R., Kettner, A. J., Slayback, D., & Policelli, F. (2011). The surface water record: Dartmouth flood observatory. Boulder, CO: University of Colorado. Retrieved from http://floodobservatory.colorado.edu/
- Caldas, M. M., Goodin, D., Sherwood, S., Campos Krauer, J. M., & Wisely, S. M. (2015). Land-cover change in the Paraguayan Chaco: 2000–2011. Journal of Land Use Science, 10(1), 1–18. doi:10.1080/1747423x.2013.807314
- Calviño, P. A., Andrade, F. H., & Sadras, V. O. (2003). Maize yield as affected by water availability, soil depth, and crop management. Agronomy Journal, 95(2), 275–281. doi:10.2134/agronj2003.0275
- Calviño, P. A., & Monzon, J. P. (2009). Farming systems of Argentina: Yield constraints and risk management. In V. O. Sadras & D. F. Calderini (Eds.), Crop physiology: Applications for genetic improvement and agronomy (pp. 55e70). San Diego, CA: Academic Press.
- Calviño, P. A., Sadras, V. O., & Andrade, F. H. (2003). Quantification of environmental and management effects on the yield of late-sown soybean. Field Crops Research, 83(1), 67–77. doi:10.1016/s0378-4290(03)00062-5
- Clark, M. L., Aide, T. M., Grau, H. R., & Riner, G. (2010). A scalable approach to mapping annual land cover at 250 m using MODIS time series data: A case study in the Dry Chaco ecoregion of South America. Remote Sensing of Environment, 114(11), 2816–2832. doi:10.1016/j.rse.2010.07.001
- Congalton, R. G. (1991). A review of assessing the accuracy of classifications of remotely sensed data. Remote Sensing of Environment, 37(1), 35–46. doi:10.1016/0034-4257(91)90048-b
- Connor, D. J., Loomis, R. S., & Cassman, K. G. (2011). Strategies and tactics for rainfed agriculture. In D. J. Connor, R. S. Loomis, & K. G. Cassman (Eds.), Crop ecology: Productivity and management in agricultural systems (2nd ed.). Cambridge: Cambridge University Press.
- Dardanelli, J. L., Collino, D., Otegui, M. E., & Sadras, V. O. (2008). Bases funcionales para el manejo del agua en los sistemas de producción de los cultivos de grano. In E. Satorre, R. B. Arnold, G. Slafer, E. de la Fuente, D. Miralles, M. Otegui, & R. Savin (Eds.), Producción de Granos – Bases funcionales para su manejo (pp. 377–440). Buenos Aires: Orientación Gráfica Editora.
- Dardanelli, J. L., Suero, E. E., Andrade, F. H., & Andriani, J. (1991). Water deficits during reproductive growth of soybeans. II. Water use and water deficiency indicators. Agronomie, 11(9), 747–756. doi:10.1051/agro:19910905
- Devani, M. R., Ploper, D., & Pérez, D. (2006). Evolución y estado actual de la producción de soja en el noroeste argentino. Las Talitas: Estación Experimental Agroindustrial “Obispo Colombres” (EEAOC).
- Dijkshoorn, J. A., Huting, J. R. M., & Tempel, P. (2005). Update of the 1:5 million Soil and Terrain Database for Latin America and the Caribbean (SOTERLAC; version 2.0). Wageningen: ISRIC – World Soil Information.
- Dussart, E., Lerner, P., & Peinetti, R. (1998). Long term dynamics of 2 populations of Prosopis caldenia Burkart. Journal of Range Management, 51, 685–691. doi:10.2307/4003613
- FAO. (2010). Global forest resources assessment 2010 (Vol. 163). Rome: Food and agriculture organization of the United Nations.
- Fatecha, A. (1989). Present and potential area for agricultural use in the Arid Chaco of Paraguay. In M. Hamp & M. A. Tiefert (Eds.), Agricultural production under semi-arid conditions with special reference to the Paraguayan Chaco: Strategies and appropriate technologies (pp. 26–49). Feldafing: DSE.
- Ferrero, M. E., & Villalba, R. (2009). Potential of Schinopsis lorentzii for dendrochronological studies in subtropical dry Chaco forests of South America. Trees, 23(6), 1275–1284. doi:10.1007/s00468-009-0369-1
- Foley, J. A., DeFries, R. S., Asner, G. P., Barford, C., Bonan, G., Carpenter, S. R., … Snyder, P. K. (2005). Global consequences of land use. Science, 309(5734), 570–574. doi:10.1126/science.1111772
- Gasparri, N. I., & Grau, H. R. (2009). Deforestation and fragmentation of Chaco dry forest in NW Argentina (1972–2007). Forest Ecology and Management, 258, 913–921. doi:10.1016/j.foreco.2009.02.024
- Gasparri, N. I., Grau, H. R., & Gutiérrez Angonese, J. (2013). Linkages between soybean and neotropical deforestation: Coupling and transient decoupling dynamics in a multi-decadal analysis. Global Environmental Change, 23(6), 1605–1614. doi:10.1016/j.gloenvcha.2013.09.007
- Gasparri, N. I., Grau, H. R., & Sacchi, L. V. ( Producer). (in press). Determinants of the spatial distribution of cultivated land in the North Argentine Dry Chaco in a multi-decadal study. Journal of Arid Environments. doi:10.1016/j.jaridenv.2015.05.005
- Gentry, A. (1995). Diversity and floristic composition of Neotropical dry forests. In H. A. Mooney, S. H. Bullock & E. Medina (Eds.), Seasonally dry tropical forests. Cambridge: Cambridge University Press.
- Giménez, R., Mercau, J. L., Houspanossian, J., & Jobbágy, E. G. (2015). Balancing agricultural and hydrologic risk in farming systems of the Chaco plains. Journal of Arid Environments, 123, 81–92. doi:10.1016/j.jaridenv.2014.09.004
- Glatzle, A. (1999). Compendio para el manejo de pasturas en el Chaco. Chaco central: Estacion Experimental Chaco Central (MAG-GTZ).
- Glatzle, A. (2004). Sistemas Productivos en el Chaco Central Paraguayo: Características, Particularidades. Loma Plata: INTTAS.
- Glatzle, A., & Stosiek, D. (2002). Country pasture/forage resource profile of Paraguay. Rome: FAO.
- Gollnow, F., & Lakes, T. (2014). Policy change, land use, and agriculture: The case of soy production and cattle ranching in Brazil, 2001–2012. Applied Geography, 55, 203–211. doi:10.1016/j.apgeog.2014.09.003
- González, M. H., Dominguez, D., & Nuñez, M. (2012). Long term and interannual rainfall variability in argentinean Chaco plain region. In O. E. Martín & T. M. Roberts (Eds.), Rainfall: Behavior, forecasting and distribution. Nova Science Publishers. ISBN: 978-1-62081-551-9.
- Graesser, J., Aide, T. M., Grau, H. R., & Ramankutty, N. (2015). Cropland/pastureland dynamics and the slowdown of deforestation in Latin America. Environmental Research Letters, 10(3), 034017. doi:10.1088/1748-9326/10/3/034017
- Grau, H. R., Gasparri, N. I., & Aide, T. M. (2005). Agriculture expansion and deforestation in seasonally dry forests of north-west Argentina. Environmental Conservation, 32, 140–148. doi:10.1017/S0376892905002092
- Grau, H. R., Gasparri, N. I., & Aide, T. M. (2008). Balancing food production and nature conservation in the Neotropical dry forests of northern Argentina. Global Change Biology, 14(5), 985–997. doi:10.1111/j.1365-2486.2008.01554.x
- Guyra Paraguay. (2013). Monitoreo de los cambios de uso de la tierra, incendios e inundaciones del Gran Chaco Americano. (A. Yanosky, Ed.). Guyra Paraguay. Retrieved from: http://www.guyra.org.py/
- Hansen, M. C., Potapov, P. V., Moore, R., Hancher, M., Turubanova, S. A., & Tyukavina, A., … Townshend, J. R. G. (2013). High-resolution global maps of 21st-century forest cover change. Science, 342(6160), 850–853. doi:10.1126/science.1244693
- Hoyos, L. E., Cingolani, A. M., Zak, M. R., Vaieretti, M. V., Gorla, D. E., & Cabido, M. R. (2013). Deforestation and precipitation patterns in the arid Chaco forests of central Argentina. Applied Vegetation Science, 16(2), 260–271. doi:10.1111/j.1654-109X.2012.01218.x
- Huang, C., Kim, S., Altstatt, A., Townshend, J. R. G., Davis, P., Song, K., … Musinsky, J. (2007). Rapid loss of Paraguay’s Atlantic forest and the status of protected areas – A Landsat assessment. Remote Sensing of Environment, 106, 460–466. doi:10.1016/j.rse.2006.09.016
- Kunst, C., Ledesma, R., Castañares, M., Cornacchione, M., van Meer, H., & Godoy, J. (2014). Yield and growth features of Panicum maximum (Jacq.) var Trichoglume cv Petrie (Green Panic) under woody cover, Chaco region, Argentina. Agroforestry Systems, 88(1), 157–171. doi:10.1007/s10457-013-9663-4
- Lambin, E. F., Gibbs, H. K., Ferreira, L., Grau, R., Mayaux, P., Meyfroidt, P., … Munger, J. (2013). Estimating the world’s potentially available cropland using a bottom-up approach. Global Environmental Change, 23(5), 892–901. doi:10.1016/j.gloenvcha.2013.05.005
- Leemans, R., & Solomon, A. M. (1993). Modeling the potential change in yield and distribution of the earth’s crops under a warmed climate. Climate Research, 3(1), 79–96. doi:10.3354/cr003079
- Lemaire, G., Franzluebbers, A., Carvalho, P. C., & Dedieu, B. (2014). Integrated crop–livestock systems: Strategies to achieve synergy between agricultural production and environmental quality. Agriculture, Ecosystems & Environment, 190, 4–8. doi:10.1016/j.agee.2013.08.009
- Lobell, D. B., Hammer, G. L., McLean, G., Messina, C., Roberts, M. J., & Schlenker, W. (2013). The critical role of extreme heat for maize production in the United States. Nature Climate Change, 3(5), 497–501. doi:10.1038/nclimate1832
- Macedo, M. N., DeFries, R. S., Morton, D. C., Stickler, C. M., Galford, G. L., & Shimabukuro, Y. E. (2012). Decoupling of deforestation and soy production in the southern Amazon during the late 2000s. Proceedings of the National Academy of Sciences of the United States of America, 109(4), 1341–1346. doi:10.1073/pnas.1111374109
- Maddonni, G. A. (2012). Analysis of the climatic constraints to maize production in the current agricultural region of Argentina—A probabilistic approach. Theoretical and Applied Climatology, 107, 325–345. doi:10.1007/s00704-011-0478-9
- Millennium Ecosystem Assessment. (2005). Current state & trends assessment: Dryland systems. Washington, DC: World Resources Institute.
- Minetti, J. L. (1999). Atlas Climático del Noroeste Argentino. Laboratorio Climatológico Sudamericano. Tucumán: Fundación Zona Caldenius.
- New, M., Lister, D., Hulme, M., & Makin, I. (2002). A high-resolution data set of surface climate over global land areas. Climate Research, 21, 1–25.
- Nix, H. A., & Fitzpatrick, E. A. (1969). An index of crop water stress related to wheat and grain sorghum yields. Agricultural Meteorology, 6(5), 321–337. doi:10.1016/0002-1571(69)90024-7
- Nosetto, M. D., Jobbágy, E. G., Brizuela, A. B., & Jackson, R. B. (2012). The hydrologic consequences of land cover change in central Argentina. Agriculture, Ecosystems and Environment. doi:10.1016/j.agee.2011.1001.1008
- Nosetto, M. D., Jobbágy, E. G., Toth, T., & Jackson, R. B. (2008). Regional patterns and controls of ecosystem salinization with grassland afforestation along a rainfall gradient. Global Biogeochemical Cycles, 22, GB2015. doi:10.1029/2007GB003000
- Olson, D. M., Dinerstein, E., Wikramanayake, E. D., Burgess, N. D., Powell, G. V. N., Underwood, E. C., … Kassem, K. R. (2001). Terrestrial ecoregions of the world: A new map of life on Earth. BioScience, 51(11), 933–938. doi:10.1641/0006-3568(2001)051[0933:TEOTWA]2.0.CO;2
- Paruelo, J. M., Guerschman, J. P., & Verón, S. R. (2005). Expansión agrícola y cambios en el uso del suelo. Ciencia Hoy, 15, 14–23.
- Pennington, T. R., Prado, D. E., & Pendry, C. A. (2000). Neotropical seasonally dry forests and Quaternary vegetation changes. Journal of Biogeography, 27(2), 261–273. doi:10.1046/j.1365-2699.2000.00397.x
- Ramankutty, N., Evan, A. T., Monfreda, C., & Foley, J. A. (2008). Farming the planet: 1. Geographic distribution of global agricultural lands in the year 2000. Global Biogeochemical Cycles, 22(1). doi:10.1029/2007gb002952
- Ramankutty, N., Foley, J., Norman, J. M., & McSweeney, K. (2002). The global distribution of cultivable lands: Current patterns and sensitivity to possible climate change. Global Ecology and Biogeography, 11, 377–392. doi:10.1046/j.1466-822x.2002.00294.x
- Reboratti, C. (2010). A sea of soybean: Consequences of the new agriculture in Argentina. Revista Geografía Norte Grande, 45, 63–76.
- REDIEX. (2009). Atlas geográfico del Chaco Paraguayo. Asunción. Retrieved from: http://www.geologiadelparaguay.com/Atlas-Geografico-del-Chaco.pdf
- Riveros, F. (2003). The Gran Chaco. Rome: FAO Bulletin. Retrieved November 26, 2013, from www.fao.org/ag/AGP/AGPC/doc/Bulletin/granchaco.htm
- Rueda, C. V., Baldi, G., Verón, S. R., & Jobbágy, E. G. (2013). Apropiación humana de la producción primaria en el Chaco Seco. Ecología Austral, 23, 44–54.
- Sadras, V., Roget, D., & Krause, M. (2003). Dynamic cropping strategies for risk management in dry-land farming systems. Agricultural Systems, 76(3), 929–948. doi:10.1016/s0308-521x(02)00010-0
- Sala, O. E. (2001). Productivity of temperate grasslands. In J. Roy, B. Saugier, & H. A. Mooney (Eds.), Terrestrial global productivity (pp. 285–300). San Diego, CA: Academic Press.
- Sohoulande Djebou, D. C., Singh, V. P., & Frauenfeld, O. W. (2015). Vegetation response to precipitation across the aridity gradient of the southwestern United states. Journal of Arid Environments, 115, 35–43. doi:10.1016/j.jaridenv.2015.01.005
- UMSEF. (2008). Monitoreo de la superficie de bosque nativo de Argentina. Secretaria de Ambiente y Desarrollo Sustentable. Retrieved from http://www.ambiente.gov.ar/
- USGS. (2004). Shuttle radar topography mission: Global land cover facility. College Park, MD: University of Maryland.
- Vallejos, M., Volante, J. N., Mosciaro, M. J., Vale, L. M., Bustamante, M. L., & Paruelo, J. M. (2015). Transformation dynamics of the natural cover in the Dry Chaco ecoregion: A plot level geo-database from 1976 to 2012. Journal of Arid Environments, 123, 3–11. doi:10.1016/j.jaridenv.2014.11.009
- Vicente-Serrano, S. M., Cuadrat-Prats, J. M., & Romo, A. (2006). Aridity influence on vegetation patterns in the middle Ebro Valley (Spain): Evaluation by means of AVHRR images and climate interpolation techniques. Journal of Arid Environments, 66(2), 353–375. doi:10.1016/j.jaridenv.2005.10.021
- Viglizzo, E. F., Frank, F. C., Carreño, L. V., Jobbágy, E. G., Pereyra, H., Clatt, J., … Florencia Ricard, M. (2011). Ecological and environmental footprint of 50 years of agricultural expansion in Argentina. Global Change Biology, 17(2), 959–973. doi:10.1111/j.1365-2486.2010.02293.x
- Viglizzo, E. F., & Jobbágy, E. G. (2010). Expansion de la Frontera Agropecuaria en Argentina y su Impacto Ecologico-Ambiental. Buenos Aires: Ediciones INTA.
- Viglizzo, E. F., Paruelo, J. M., Laterra, P., & Jobbágy, E. G. (2012). Ecosystem service evaluation to support land-use policy. Agriculture, Ecosystems & Environment, 154, 78–84. doi:10.1016/j.agee.2011.07.007
- Volante, J. N., Alcaraz-Segura, D., Mosciaro, M. J., Viglizzo, E. F., & Paruelo, J. M. (2012). Ecosystem functional changes associated with land clearing in NW Argentina. Agriculture, Ecosystems & Environment, 154, 12–22. doi:10.1016/j.agee.2011.08.012
- Wright, C. K., & Wimberly, M. C. (2013). Recent land use change in the Western Corn Belt threatens grasslands and wetlands. Proceedings of the National Academy of Sciences, 110(10), 4134–4139. doi:10.1073/pnas.1215404110