
ABSTRACT
Land use is shaped by human activities. Traditional methods of measuring land uses (e.g. surveys and remote sensing techniques) often have difficulties in capturing human activities. The near-ubiquitous coverage of mobile phones opens up a new way to investigate land use through human activities. We propose to analyze land use by characterizing human activity patterns based on the aggregated call volume, and apply non-negative matrix factorization to identify fundamental behavioral classes. Using tower-based call data from Dakar, Senegal, we discover two fundamental land use patterns: commercial/business/industrial (C/B/I) and residential. Then, the land use of the reception area of each cell tower can be inferred based on the weights obtained for each basis vector. To evaluate the proposed approach, the results are compared with two points-of-interest (POI) data sets obtained from OpenStreetMap and Facebook’s Graph API. We have found that a majority of POIs like embassies, offices, and hotels are located in the predicted C/B/I areas; specifically, there is a strong positive correlation between estimated land use weights and the number of related POIs. Furthermore, we have shown analyzing 24-h call pattern matrix can track daily land use changes.
1. Introduction
Land use is ‘the human employment of the land’ (Meyer & BL Turner, Citation1994) and characterized by ‘the arrangements, activities, and inputs people undertake’ (Di Gregorio, Citation2005). Depending on the socioeconomic functions, land uses can be categorized into classes, such as industrial, commercial, residential, administrative, and agricultural. Understanding land use is crucial for practitioners and researchers to perform urban analysis and planning, such as population estimation, infrastructure planning, neighborhood zoning, as well as hazard and pollution analysis (Donnay & Unwin, Citation2001). Traditionally, land use is identified through surveys, which usually tend to be expensive and difficult to obtain frequently. Therefore, computational methods have been proposed to detect land use automatically. For instance, remote sensing techniques have been widely used for land cover and land use classification (Gong & Howarth, Citation1990; Lu & Weng, Citation2006; Tatem, Nayar, & Hay, Citation2006; Yin et al., Citation2011; Yuan, Sawaya, Loeffelholz, & Bauer, Citation2005, Citation2014). Both spectral and texture features of satellite images can be combined to identify objects, such as roads, parking lots, buildings, and grass, from satellite imagery (Yuan et al., Citation2014). Reflective spectral bands of satellite imagery are used to identify land cover types including urban land, agriculture, forest, grass, water, and wetland (Yuan et al., Citation2005). However, spectral and texture features are highly varying within the same land use class, so it is difficult to differentiate land use types based on these features alone (Wu, Qiu, Usery, & Wang, Citation2009). In order to address the limitation, some ancillary information, such as geographic information systems data (Yin et al., Citation2011), surface temperature (Lu & Weng, Citation2006), contextual properties (Wu et al., Citation2009), census data (Mesev, Citation1998), and expert knowledge (Platt & Rapoza, Citation2008), has been added to improve land use classification. However, most of the ancillary information still focuses on the physical properties of the land rather than human activities. Even though human activities can be partially captured by demographic and socioeconomic surveys such as census, the temporal and spatial resolutions are usually not high enough to capture dynamic changes of land use.
The universal adoption of mobile phones provides us with a high-resolution proxy for human activities. Several studies investigated the potential of mobile phone data for spatiotemporal population distribution modeling, and applied clustering, classification, and eigendecomposition methods to identify call patterns for land use detection (Pei et al., Citation2014; Reades, Calabrese, & Ratti, Citation2009; Soto & Frías-Martínez, Citation2011; Toole, Ulm, González, & Bauer, Citation2012). Results have shown a moderate detection rate (below 60%) in Pei et al. (Citation2014) and Toole et al. (Citation2012). In addition to mobile phone data, social media data has been used for land use analysis. The hourly geotagged tweet volume is used to detect traditional (e.g. business, residential, industrial) and new types of land use, such as nightlife places (Frias-Martinez & Frias-Martinez, Citation2014). GPS-enabled taxi trajectory data is used to classify multiple urban land use types (Liu, Wang, Xiao, & Gao, Citation2012). Network activity data is also used to study human activities and their relation to physical environment. For instance, a significant correlation between MIT’s Wi-Fi network activity data and campus building uses (e.g. residential buildings, research labs, auditorium) is found in Calabrese, Reades, and Ratti (Citation2010).
Yet, most existing studies focus on developed countries, probably due to the extensively deployed sensors and rich ground-truth data available. In resource-constrained countries, there is far less geotagged human activity data, and detailed land use data is also scarce, if not missing. Moreover, different types of land uses are usually mixed and co-located in low-income countries, unlike land use zoning in developed countries. So, due to the limited data sources and mixed land use, it is unclear whether similar findings can be generalized to low-income countries. In our paper, we study the land use detection in Senegal (a low-income country in Sub-Saharan Africa) based on the Call Details Record (CDR) data, provided for the Orange Data for Development Challenge in 2014.
Existing work (Pei et al., Citation2014; Toole et al., Citation2012) evaluates their land use prediction results by comparing with zoning data, which, however, reflects the planned use of the land by the government and may not reflect the actual land use. In our paper, we use the crowdsourced points-of-interest (POI) labeling data from OpenStreetMap (OSM) and Facebook as the ground truth to evaluate our results. Moreover, different from existing work that applies clustering and classification algorithms to categorize land uses into separated classes (e.g. commercial, residential, industrial), we propose to use non-negative matrix factorization (NMF) to decompose the call pattern matrix and generate a weighted land use map that shows a mixture of commercial and residential land uses. This method is well suited for the nature of mixed land use. At the end, our results show that it is possible to track land use changes by monitoring the daily weight changes.
2. Data
2.1. CDR data
This data set contains the number and duration of calls between each pair of antennae (1,666 antennae in total) at every hour from 1 January 2013 to 31 December 2013. Since our study is based on an aggregated spatial analysis, users’ anonymity is maintained. According to Telecommunication/ICT Development Report (Citation2015), the mobile cellular subscriptions per 100 people in Senegal reached 99 in 2014. Given the high penetration rate, we consider mobile phone usage data as a good proxy for human activities.
We study the land use in the capital region, Dakar, instead of the whole country. Dakar is the most populous and affluent region in Senegal (with 20% of the nation’s population); and OSM and Facebook are more extensively used in Dakar than in other regions of the country. The higher usage of OSM and Facebook produces more human-labeled land use data, which is used to evaluate our results. Also, there is a denser placement of antennae in Dakar: 488 cell phone towers (about 29% of all) are located there. This generates high spatial resolution data for our study.
It is well known that human dynamics are very different between work (e.g. commercial, business, industrial) and residential areas, with the former has dense activities during days and weekdays, while the latter shows the opposite – more activities during nights and weekends. This observation constitutes the basis of our analysis. Similar to (Toole et al., Citation2012), we process the CDR data in three steps in order to capture the spatiotemporal patterns of human activities.
First, for each antenna, we aggregate its total call volume (including the number of incoming and outgoing calls) on an hourly basis and normalize the original hourly call volume time series into z-score over the study period from 1 January 2013 to 31 December 2013. We denote the normalization as , where
represents the absolute call volume of antenna i at hour t,
is the mean call volume of antenna i across the whole study period. This normalization scales the signal so that we can compare call patterns of different cell phone towers.
Second, in order to capture the relative activity of a certain area at a given hour, we subtract the average activity (or ‘baseline’ activity) of all areas during the hour from its normalized call volume. Hence, we obtain the z-score spatial residual of an antenna, i, which is represented by , where
represents the average normalized call volume of all antennae in Dakar at time t.
Third, we calculate of an antenna over the time by hour of day (i.e. 0 AM to 11 PM) and day of week (i.e. Monday to Sunday), and obtain the average value,
. By doing this, we obtain a 168-dimension (i.e. 7 days × 24 h) vector for each antenna,
. We remove 11 antennae that have less than 168 features, which leads to 477 antennae in our analysis.
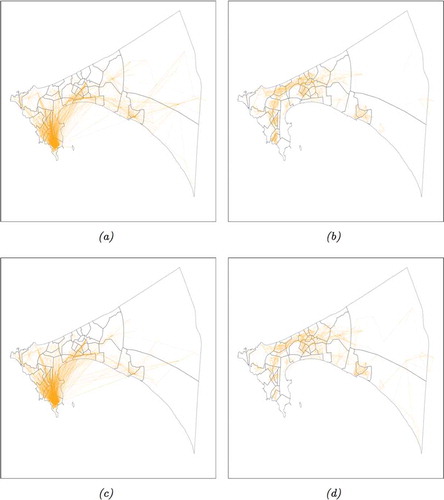
In , we show the spatiotemporal differences of mobile phone communication activities by plotting the aggregated call flows during the day (from 8 AM to 5 PM), night (from 6 PM to 11 PM), weekdays (Monday to Friday), and weekends (Saturday and Sunday). The edge weight between each pair of antennae reflects the relative intensity of call volume to the average in the entire region at the same time. This graph demonstrates different call activity patterns across the day and night as well as across weekdays and weekends. It is reasonable to assume that areas with more activities during the day/weekdays are likely to be commercial/business/industrial, while areas with more activities during the night/weekends are residential. For example, Dakar Plateau, the hub point of call flow during the day and weekdays (i.e. the bottom corner on the left in and ) is the central district of the city, having most public administrations, major banks, business centers located there. By contrast, Guediawaye, within the hub region of call flow during the night and weekends (see and ), is found to be a small town in Dakar, having no large business places but mainly serving for residential uses.
Figure 1. Call flow visualization during the day, night, weekdays, and weekends. (a) Day, (b) night, (c) weekday, and (d) weekend.
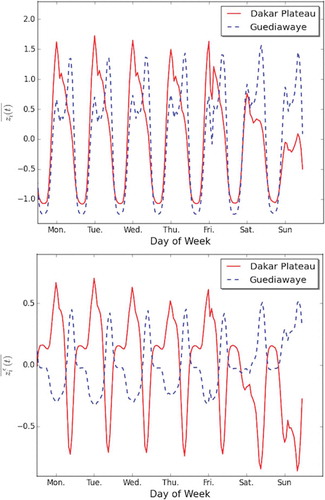
We then compare the call patterns of Dakar Plateau and Guediawaye by showing their normalized call time series () and spatial residuals (
) in . The activity peaks of Guediawaye in the evenings lag a few hours to the peaks of Dakar Plateau in the days, and the level of aggregated activities of Guediawaye is higher than that of Dakar Plateau on Saturday and Sunday. After subtracting the average activity of the entire Dakar, the spatial residuals of two normalized time series demonstrate an even stronger difference (see )): both signals show an inverse relationship with Dakar Plateau having much higher activities than the average during the day and weekdays and Guediawaye having much higher activities than the average during the night and weekends. We use the spatial residuals instead of the original normalized ones from now on.
Figure 2. Data transformation of call patterns of two arrordosiments (a subdivision in a department): Dakar Plateau and Guediawaye. (a) z-score normalization and (b) z-score spatial residuals.
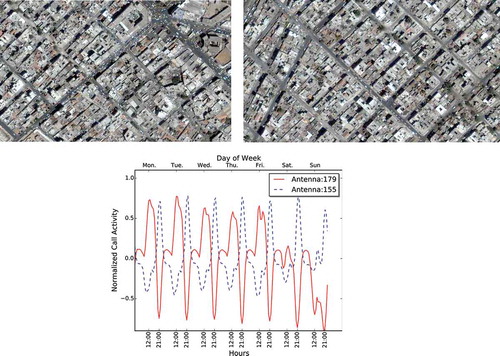
We underline the value of information from call patterns by comparing with satellite images of two regions. As discussed before, since commercial and residential areas can share similar physical characteristics, using spectral and texture features alone is usually not enough to differentiate land uses. shows satellite images from service areas of two antennae (IDs: 179 and 155), which exhibit similar image features. However, their call patterns as shown in ) contrast each other: antenna 179 reveals strong ‘commercial’ characteristics, while antenna 155 demonstrates strong ‘residential’ characteristics. So, call activity provides uniquely relevant information about land use, especially when their physical features are not disparate.
Figure 3. Satellite imagery snapshots and call patterns of antennae 179 and 155. (a) Service area of antenna 179, (b) service area of antenna 155, and (c) call pattern comparison between these two antennae.
2.2. Open-sourced POI data
2.2.1. OSM data
The POI data in OSM is voluntarily added by users to tag the use of a place represented by a point or polygon on the map. Since the official land use data is missing in Dakar, we adopt POI data as the ground truth to evaluate our land use inference results.
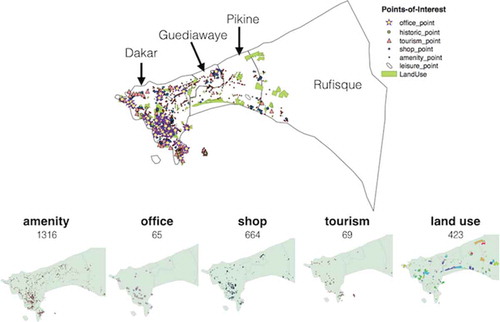
The OSM POI data sets are obtained from Trimble Data Marketplace (http://data.trimble.com/market). Among various POI features, we select seven features that are most relevant to land uses. These features include land use, office, amenity, historic, tourism, shop, and leisure. Land use feature includes commercial, residential, industrial, cemetery, garages, military, recreation ground, retail, etc. Office refers to a business place for conducting administrative or professional work. Shop includes convenience, clothes, book, jewelry, bakery stores, as well as kiosk (i.e. small shops), etc. Amenity includes facilities such as bar, restaurant, college, school, bank, and pharmacy. The POI data is available in three geometry formats: polygons, points, and lines. shows the obtained POI features in the region of Dakar. Some individual POI features are listed: 1,316 amenity, 65 office, 664 shop, and 69 tourism labeled points, as well as 423 tagged land use polygons. The Dakar region is consisted of four departments – Dakar, Gudiawaye, Pikine, and Rufisque. The former two departments are the main urban lands, while the latter two are the suburbs. As we can see from , there is much less POI data in the suburbs than in the urban land.
Figure 4. Points-of-interest features obtained from OpenStreetMap for Dakar, Senegal.
2.2.2. Facebook POI data
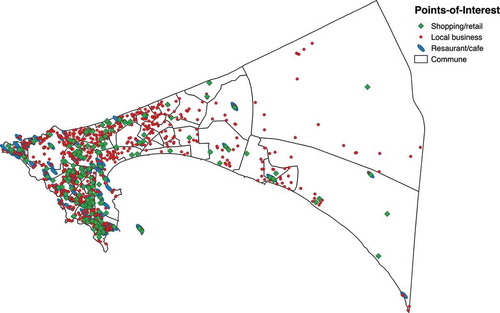
The second POI data set used for our evaluation is obtained via Facebook’s Graph API. The data is collected through PlanetSense (Thakur et al., Citation2015), a geospatial data platform developed by the Oak Ridge National Laboratory for real-time data streaming and analytics. There are 3,797 POI points in the Dakar region (see ), covering 82 types of POIs. The most frequently tagged POI types are local business (1,152), shopping/retail (423), and restaurant/cafe (171).
Figure 5. Points-of-interest features obtained via Facebook Graph API for Dakar, Senegal.
3. Methodology and results
3.1. Inferring land use from mobile phone call activities
We assume that each cell tower’s service area (approximated by the Voronoi polygon) is a mixture of commercial and residential land uses, and each land use corresponds to a representative call pattern. To disentangle the call pattern of each service area, we propose the following problem formulation. A is an m × n mobile phone call activity matrix, where m is the number of cell towers and n is the length of a call pattern vector of each cell phone tower. Here, and
. Each row vector of A is a n-dimensional call pattern vector, which are the spatial residuals of normalized call time series obtained in Section 2.1,
. Each row is normalized to 0 to 1. A can be approximated as a product of two matrices W and H:
Here, H contains two rows, which represent fundamental land use patterns: commercial/business/industrial (C/B/I) and residential. Each row of x W contains combination weights. Both H and W are non-negative.
This is a typical non-NMF problem, which aims to approximate high-dimensional data representation by a lower-dimensional representation with non-negativity constraints (Berry, Browne, Langville, Pauca, & Plemmons, Citation2007; Lee & Seung, Citation1999). To obtain W and H, we use the Gradient Descent algorithm (Lin, Citation2007), which minimizes the following objective function:
where F stands for the Frobenius norm. The implementation is based on the scikit-learn Python library.
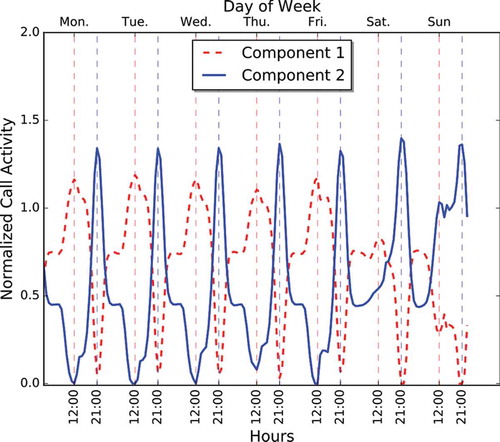
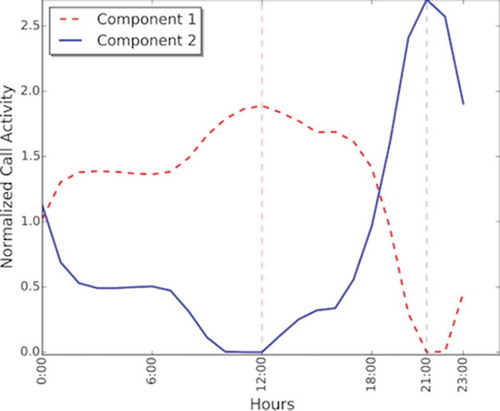
shows two resulting basis vectors, denoted by Component 1 and Component 2. It can be seen that these two components show opposite patterns: peaks of Component 1 are in the day time (at 12 PM) and weekdays, while peaks of Component 2 are in the night (at 9 PM) and weekends, capturing C/B/I and residential characteristics, respectively.
Figure 6. Two basis vectors obtained from decomposing the 24-h/7-day call pattern matrix using non-negative matrix factorization.
Then, the original call pattern time series of each cell tower can be approximated by a linear combination of these two basis vectors based on weights contained in each row of W. Voronoi polygons are used to approximate the reception area of cell towers (Gonzalez, Hidalgo, & Barabasi, Citation2008). Based on the estimated call patterns for each tower, we infer the land use map at the level of Voronoi polygon, which is shown in ). The color value in the map is determined by the weights for two basis vectors, that is, . Blue hue represents C/B/I, while red hue indicates ‘residential’ (or out-of-work) land use.
Figure 7. Estimated land use map based on call activities: (a) at the Voronoi polygon level, (b) intersection between Voronoi polygon (grey dashed line) and neighborhood (red solid line) boundaries, and (c) at the neighborhood level.
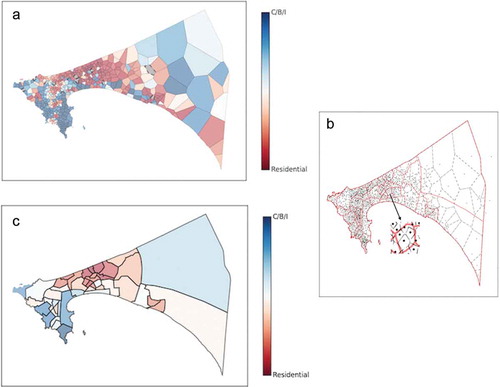
Voronoi polygons are not actual neighborhood boundaries. In order to obtain a land use map in a physically meaningful context, we convert the land use map at the level of Voronoi polygon (see )) to the one with actual neighborhood boundaries. Dakar consists of 45 communes or neighborhoods.Footnote1 ) shows the area intersections between Dakar neighborhood polygons and Voronoi polygons of cell phone towers. Let be a neighborhood polygon,
the area of the neighborhood polygon,
a Voronoi polygon of cell phone tower j,
the area of this Voronoi polygon, and
the color value of
. We compute the color value of the neighborhood polygon,
, based on the proportion of the area of intersections with other Voronoi polygons, see Eq. (3):
Then, we can obtain a land use map for the neighborhoods in Dakar, which is shown in ).
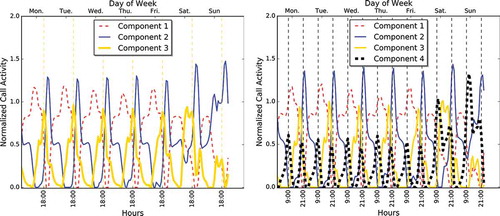
Furthermore, we also apply NMF to analyze more nuanced classes of activities. shows the three- and four-basis vectors. It can be seen that these two new components capture different land use characteristics: the third component represents heavy uses at early evenings (i.e. 6 PM) during weekdays and through the day time on Saturday, but shows very low uses on Sunday. We hypothesize that this land may be mainly for leisure activities, such as shopping or retail. Here, we consider this land use type as leisure. To test this hypothesis, we compare our predicted land use results with the distribution of shopping POIs. For each cell tower, we obtained four weights, , corresponding to the four components. If
is the maximum value, we classify this cell tower polygon’s land use type as leisure. Here, we filter out cell towers with a small
(i.e.
), as they do not show a strong leisure-land characteristics. Within these remaining 124 cell towers’ polygons, there are 113 Facebook shopping/retail POIs: among which 86% (or 97/113) is found to be in the predicted leisure land. The fact that most shops in Dakar are closed on Sunday may explain the lowest call activities on Sunday from these areas. Different from the first three components, the fourth one is characterized by two peaks on each day (9 AM and 9 PM). We find that 95% (or 87/92) of the cell towers with a large weight in the fourth component (i.e.
) are located in the suburbs – Pikine (60%) and Rufisque (35%). This may suggest that the fourth component represents a sub-urban or rural land use type.
Figure 8. Multiple basis vectors obtained from decomposing the 24-h/7-day call pattern matrix using non-negative matrix factorization. (a) Three components and (b) four components.
Since detailed official land use data is missing and multiple types of POI data are limited, especially in suburb areas, it is difficult to evaluate nuanced classifications of land use in Dakar. So, we focus on the results obtained from two fundamental basis vectors (C/B/I and residential) for the in-depth evaluation in the following section.
3.2. Evaluation based on the POI data from OSM
The original call activities are recorded at the location of cell towers, and Voronoi polygons are used to approximate their service areas. The POI data sets of OSM are available at three geometry formats: points, lines, and polygons. So, the spatial partitions of our mobile phone data and the POI data are not congruent. To reconcile different data sets for the evaluation, we transform all the data into the same uniform grid at a resolution of 100 m.
Two resulting basis vectors obtained from Section 3.1 capture C/B/I and residential characteristics, respectively. The original call patterns of a given cell phone tower can be approximated by the linear combination of two basis vectors weighted by and
. Here, we classify an area as C/B/I if
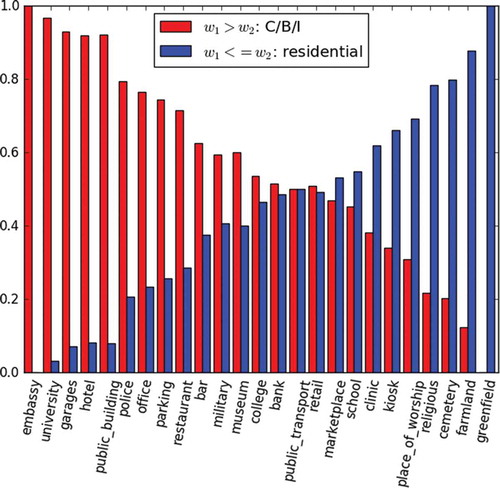
, and residential, otherwise. To evaluate the result, we compare the prediction with human-labeled POI data from OSM. shows the comparison of two-class predictions with POI features, commercial, office, industrial and residential. We find that a majority of commercial, office, industrial areas are under the predicted C/B/I class, while over 60% of residential places are within the predicted residential class. In addition, shows the distributions of more POI features under these two classes. When
, dominating features include embassy, garage, hotel, university, public building, restaurant, and military, whereas POIs, such as religious, cemetery, clinic, kiosk, farmland, and greenfield, take the larger proportions when
. These findings are well aligned with the actual land use characteristics: for instance, embassies, public buildings, and offices are usually located in the commercial and business areas; religious places, clinics, and kiosks (i.e. very small shops) are usually located at residential neighborhoods. Also, cemeteries, farmland, and greenfield, which are often close to residential instead of work areas, are found to be more present when
.
Table 1. Comparing land use estimation with POI (‘commercial/office/industrial/residential/’) from OSM.
Figure 9. Comparing land use estimation with multiple types of POI from OSM.
Overall, our results demonstrate the promise of our method for land use detection, especially, there is a 90.4% detection rate for commercial area and 76.6% for office area, but the detection rates for residential (60.7%) and industrial (63.6%) areas are relatively low. This is perhaps due to the fact that residential and industrial areas often co-locate with other land use types in Dakar. Future work needs finer-scaled human activity data and contextual information to improve mixed land use inference further.
3.3. Evaluation based on the POI data from Facebook
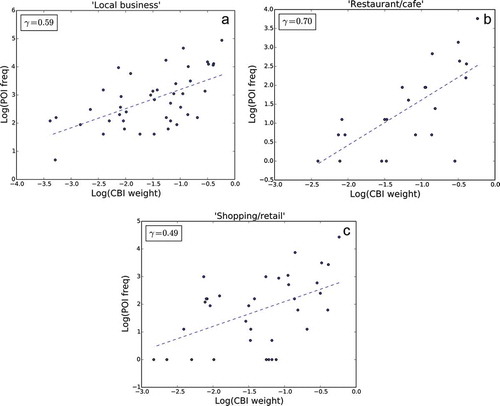
The top three most frequently tagged POIs from Facebook include 1,152 local business, 423 shopping/retail, and 171 restaurant/cafe. Here, we assume that areas with a larger C/B/I weight may contain more business/commercial related POIs. To test this assumption, we correlate land use weights with the number of business, shopping, and restaurant POIs at the level of neighborhoods in Dakar (see the 45 neighborhoods in )). As the cell tower’ Voronoi polygon is small, the POI data at the level of Voronoi polygon can be sparse. Therefore, we conduct the correlation analysis at the level of neighborhood. The neighborhood land use weights ( and
) can be estimated based on the area intersection between cell tower’s Voronoi polygons and neighborhood polygons (see the illustration in .) The format of Facebook’s POIs includes only points, so it is straightforward to check if the point is within a certain neighborhood polygon. For each of the neighborhood in Dakar, we check how many POI points it contains. shows the scatter plots between estimated land use weights and number of POIs. As it can be seen, there is a significant positive correlation between C/B/I weights and number of local business points (
), restaurant/cafe (
), and shopping/retail (
). This finding suggests our method is promising to predict the level of mixed land use, for example, larger C/B/I weights indicates more work related or business use of the land.
Figure 10. Scatter plots of land use weights and number of POIs: (a) ‘Local business’, (b) ‘Restaurant/cafe’, and (c) ‘Shopping/retail’.
3.4. Tracking daily land use changes
Since humans use the land differently overtime, we aim to track the dynamic change of land uses. Our mobile phone data is available on an hourly basis from 1 January 2013 to 31 December 2013. For each day, we construct a hourly call pattern matrix, , where
is the spatial residual of normalized call volume of cell phone tower i at the hour j (
), m is the number of cell phone towers times the number of days, and n is the length of call pattern vector. Here the call pattern vector is derived for 24 h per day, so
. Similar to Section 3.1, we aim to factorize the original call pattern matrix to identify basis vectors and weight matrix, which are represented by two reduced-dimensional matrices: H and W in Eq. (1). shows the patterns of two basis vectors extracted from the original call pattern matrix. As it can be seen, Component 1 demonstrates C/B/I characteristics with more activities in the day but fewer in the night, while Component 2 shows the opposite pattern, which captures residential characteristics.
Figure 11. Two basis vectors obtained from decomposing the 24-h call pattern matrix using non-negative matrix factorization.
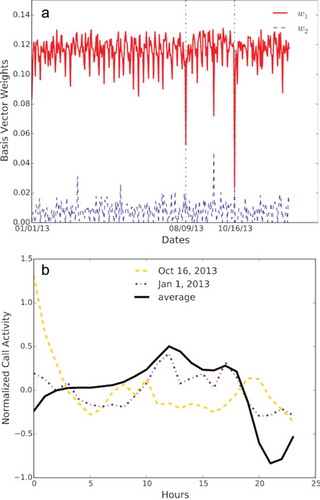
We obtain a call pattern matrix for each day, and apply NMF to find basis vectors and weights. Based on the daily weight changes, we can track land use differences over time. shows an example of daily weight variations of a cell tower (ID: 191), which displays a C/B/I land use type with its being much larger than
during most of the time (see )). However, we observe significant changes on a few days (such as 1 January, 9 August, 16 October), marked by vertical lines in the graph. In ), we compare the average call pattern of this cell tower through the whole period with call patterns on 1 January and 16 October, from which we find that the average call pattern shows a strong C/B/I characteristic with peaks during the day and troughs during the night, while the call patterns on 1 January and 16 October are significantly different from the average pattern. This suggests the land is used differently on these abnormal days: The New Year Day is quite obvious, and we find that 16 October was the country’s biggest festival (Tabaski or Eid al-Adha), when people usually get up very early to prepare for the biggest Muslim celebration of the year; interestingly, we observe call spikes in the early morning of the day, see ).
Figure 12. An example of tracking daily land use changes for Antenna 191. (a) Weights of two basis vectors through the year 2013 and (b) hourly call pattern comparisons: average versus abnormal.
The above example shows the possibility of tracking land use changes by monitoring daily call weights. We acknowledge that the concept of daily land use change that we use here is equivalent to the temporal place affordance change, not necessarily a fundamental land use change. But with a longer period of human activity data being available, it will be possible for us to track land use evolution and identify permanent land use changes.
4. Conclusion and discussion
In this paper we proposed to identity land use in Dakar, Senegal, by the use of mobile phone communication data. A 24-h/7-day call pattern matrix is constructed to represent human activity patterns during days and nights as well as weekdays and weekends. Non-NMF is applied to decompose the call pattern matrix and extract two basis vectors, which show C/B/I (or work pattern) and residential (or out-of-work pattern) characteristics, respectively. Then, we estimated the mixed land use of the service area of a given cell tower based on the weights ( and
) assigned for each basis vector. Our prediction results are compared with crowdsourced POI labeling on OSM and Facebook. It has shown that a larger proportion of POI features like embassies, public buildings, offices, and hotels, appear in our estimated C/B/I areas, while religious places, cemeteries, and small shops tend to be in the predicted residential areas. Also, we have found that there is a significant positive correlation between C/B/I weights and number of business, restaurant, and shopping POIs. Moreover, our method demonstrates the promise of tracking daily land use changes based on the NMF analysis for the 24-h call pattern matrix derived from each day. In addition to two basis vectors, our method is able to identify additional patterns, which may represent land use types of business/leisure and suburbs.
Unlike remote sensing techniques, our work focuses on human activity patterns instead of biophysical characteristics for land use detection. Compared to existing work (Pei et al., Citation2014; Reades et al., Citation2009; Soto & Frías-Martínez, Citation2011; Toole et al., Citation2012) that leverage novel data sources (e.g. CDR and social media data) for land use analysis, our study is different: first, we extend the study to a low-income country, where mixed land use is common and official land use data is rare due to the expensive cost of collecting such data. With more and more human activity data being generated, our method may provide a cost-effective option for land use measurement in resource-constrained nations. Second, the NMF technique used in our paper that can separate mixtures of call patterns is well suited for mixed land use inference. Plus, based on the weights generated for basis vectors, we can track land use changes over time. Third, the crowdsourced POI data obtained from OSM is used to evaluate our results, while official zoning data is usually adopted as the ground truth (Pei et al., Citation2014; Toole et al., Citation2012). Since zoning data reveals planned land use, it may not be necessarily the actual land use. Instead, crowdsourcing data like OSM’ and Facebook’s POI may serve as a more realistic land use data source.
Last but not the least, several limitations in our study should be noted. First, the land use inference is conducted at the level of Voronoi polygons associated with the cell towers. The region of Voronoi polygons is influenced by the tower density, so some Voronoi tessellations are coarse. This limitation is restricted by the CDR data used. High-resolution data, such as satellite imagery, may be coupled with CDR data to improve land use inference on a finer scale. Second, due to the data availability, our study only focuses on Dakar, Senegal. With more human activity data being available, which include not only mobile phone data, but also geo-referenced social media data, our method may be applied to study land uses across countries.
Overall, our results show the promise of using mobile phone data to infer land use and detect land use changes. In future work, high-resolution satellite imagery data will be combined with human activity data to improve multiple land use classification on a finer scale.
Acknowledgments
The authors would like to acknowledge the financial support for this research from the US government for Oak Ridge National Laboratory’s Laboratory Directed Research and Development (LDRD) project number 7677. Yong-Yeol Ahn thanks the support from Microsoft Research. We especially thank Dr. Jiangye Yuan, Eric Weber, and Dr. Vladimir A. Protopopescu from the Oak Ridge National Laboratory, and Dr. Xin Shuai from the Research and Development at Thomson Reuters for their insightful comments on an earlier version of the manuscript.
At least one or more of the authors of this manuscript are employees of UT-Battelle, LLC, under contract DE-AC05-00OR22725 with the US Department of Energy. Accordingly, the US government retains and the publisher, by accepting the article for publication, acknowledges that the United States Government retains a non-exclusive, paid-up, irrevocable, worldwide license to publish or reproduce the published form of this manuscript, or allow others to do so, for US government purposes.
Disclosure statement
No potential conflict of interest was reported by the authors.
Additional information
Funding
Notes on contributors
Huina Mao
Dr. Huina Mao received the Ph.D. degree in Informatics from Indiana University in Bloomington in 2014. She is currently a Liane Russell Fellows at the Oak Ridge National Laboratory in the US. Her research interest include big data, natural language processing, machine learning, social science, and urban science.
Yong-Yeol Ahn
Dr. Yong-Yeol Ahn is an Assistant Professor at Indiana University School of Informatics and Computing. He received his Ph.D. degree in Statistical Physics from KAIST in 2008. He develops and leverages mathematical and computational methods to study complex systems such as cells, the brain, society, and culture.
Budhendra Bhaduri
Dr. Budhendra Bhaduri is a Corporate Research Fellow and leads the Geographic Information Science and Technology group at Oak Ridge National Laboratory. He is the founding director of the Urban Dynamics Institute at ORNL. His research interests and experience include novel implementation of geospatial science and technology in sustainable development research, including population dynamics, urbanization and watershed impacts, energy resource assessment, and disaster management. He received his Ph.D. in Earth & Atmospheric Sciences from Purdue University.Dr. Gautam Thakur is a research scientist at Oak Ridge National Laboratory. He received his Ph.D. degree in computer information and science engineering from University of Florida in 2012. His research focuses on population dynamics, urban morphology, network science, and transportation simulation and modeling.
Gautam Thakur
Dr. Gautam Thakur is a research scientist at Oak Ridge National Laboratory. He received his Ph.D. degree in computer information and science engineering from University of Florida in 2012. His research focuses on population dynamics, urban morphology, network science, and transportation simulation and modeling.
Notes
References
- Berry, M.W., Browne, M., Langville, A.N., Pauca, V.P., & Plemmons, R.J. (2007). Algorithms and applications for approximate nonnegative matrix factorization. Computational Statistics & Data Analysis, 52(1), 155–173. doi:10.1016/j.csda.2006.11.006
- Calabrese, F., Reades, J., & Ratti, C. (2010). Eigenplaces: Segmenting space through digital signatures. IEEE Pervasive Computing, 9(1), 78–84. doi:10.1109/MPRV.2009.62
- Di Gregorio, A. (2005). Land cover classification system: Classification concepts and user manual: LCCS, 8. Rome: Food & Agriculture Org.
- Donnay, J.P., & Unwin, D. (2001). Modelling geographical distributions in urban areas. Remote Sensing and Urban Analysis, 205–224.
- Frias-Martinez, V., & Frias-Martinez, E. (2014), “Crowdsourcing land use maps via Twitter,” Workshop on Data Science for Social Good, 20th ACM SIGKDD Conference on Knowledge Discovery and Data Mining.
- Gong, P., & Howarth, P. (1990). The use of structural information for improving land-cover classification accuracies at the rural-urban fringe. Photogrammetric Engineering and Remote Sensing, 56(1), 67–73.
- Gonzalez, M.C., Hidalgo, C.A., & Barabasi, A.L. (2008). Understanding individual human mobility patterns. Nature, 453(7196), 779–782. doi:10.1038/nature06958
- International Telecommunication Union (2015) “Telecommunication/ICT Development Report and Database,” http://data.worldbank.org/indicator/IT.CEL.SETS.P2.
- Lee, D.D., & Seung, H.S. (1999). Learning the parts of objects by non-negative matrix factorization. Nature, 401(6755), 788–791. doi:10.1038/44565
- Lin, C.B. (2007). Projected gradient methods for nonnegative matrix factorization. Neural Computation, 19(10), 2756–2779. doi:10.1162/neco.2007.19.10.2756
- Liu, Y., Wang, F., Xiao, Y., & Gao, S. (2012). Urban land uses and traffic ‘source-sink areas’: Evidence from GPS-enabled taxi data in Shanghai. Landscape and Urban Planning, 106(1), 73–87. doi:10.1016/j.landurbplan.2012.02.012
- Lu, D., & Weng, Q. (2006). Use of impervious surface in urban land-use classification. Remote Sensing of Environment, 102(1), 146–160. doi:10.1016/j.rse.2006.02.010
- Mesev, V. (1998). The use of census data in urban image classification. Photogrammetric Engineering and Remote Sensing, 64(5), 431–436.
- Meyer, W.B., & BL Turner, I. (1994). Changes in land use and land cover: A global perspective (Vol. 4). Cambridge Cambridge University Press.
- Pei, T., Sobolevsky, S., Ratti, C., Shaw, S.L., Li, T., & Zhou, C. (2014). A new insight into land use classification based on aggregated mobile phone data. International Journal of Geographical Information Science, 28(9), 1988–2007. doi:10.1080/13658816.2014.913794
- Platt, R.V., & Rapoza, L. (2008). An evaluation of an object-oriented paradigm for land use/land cover classification. The Professional Geographer, 60(1), 87–100. doi:10.1080/00330120701724152
- Reades, J., Calabrese, F., & Ratti, C. (2009). Eigenplaces: Analysing cities using the space-time structure of the mobile phone network. Environment and Planning B: Planning and Design, 36(5), 824–836. doi:10.1068/b34133t
- Soto, V., & Frías-Martínez, E. (2011), “Automated land use identification using cell-phone records,” In Proceedings of The 3rd ACM International Workshop on MobiArch, ACM, pp. 17–22.
- Tatem, A.J., Nayar, A., & Hay, S.I. (2006). Scene selection and the use of NASA’s global orthorectified Landsat dataset for land cover and land use change monitoring. International Journal of Remote Sensing, 27(14), 3073–3078. doi:10.1080/01431160600589195
- Thakur, G.S., Bhaduri, B.L., Piburn, J.O., Sims, K.M., Stewart, R.N., & Urban, M.L. (2015), “PlanetSense: A real-time streaming and spatio-temporal analytics platform for gathering geo-spatial intelligence from open source data,” in Proceedings of the 23rd SIGSPATIAL International Conference on Advances in Geographic Information Systems, ACM, p. 11.
- Toole, J.L., Ulm, M., González, M.C., & Bauer, D. (2012), “Inferring land use from mobile phone activity,” in Proceedings of the ACM SIGKDD international workshop on urban computing, ACM, pp. 1–8.
- Wu, S.S., Qiu, X., Usery, E.L., & Wang, L. (2009). Using geometrical, textural, and contextual information of land parcels for classification of detailed urban land use. Annals of the Association of American Geographers, 99(1), 76–98. doi:10.1080/00045600802459028
- Yin, J., Yin, Z., Zhong, H., Xu, S., Hu, X., Wang, J., & Wu, J. (2011). Monitoring urban expansion and land use/land cover changes of Shanghai metropolitan area during the transitional economy (1979–2009) in China. Environmental Monitoring and Assessment, 177(1–4), 609–621. doi:10.1007/s10661-010-1660-8
- Yuan, F., Sawaya, K.E., Loeffelholz, B.C., & Bauer, M.E. (2005). Land cover classification and change analysis of the twin cities (Minnesota) metropolitan area by multitemporal Landsat remote sensing. Remote Sensing of Environment, 98(2), 317–328. doi:10.1016/j.rse.2005.08.006
- Yuan, J., Wang, D., & Li, R. (2014). Remote sensing image segmentation by combining spectral and texture features. IEEE Transactions on Geoscience and Remote Sensing, 52(1), 16–24. doi:10.1109/TGRS.2012.2234755