
 ?Mathematical formulae have been encoded as MathML and are displayed in this HTML version using MathJax in order to improve their display. Uncheck the box to turn MathJax off. This feature requires Javascript. Click on a formula to zoom.
ABSTRACT
Many armed conflicts worldwide occur in biodiversity hotspots and nearly 50% of those conflicts occur in forested regions. In Colombia, the armed conflict has implied the clearing of large forest tracts for the establishment of illicit crops. The aim of this study was to assess the role that illicit crops played in the deforestation dynamics in Colombia between 2001 and 2014. We established a database with the annual deforestation rates and nine predictors for 1120 municipalities and built fixed effects models that take spatial autocorrelation into account. Model selection with AIC suggested that the area cultivated with coca crops was the best predictor of annual rates of deforestation, whereas coca crop removal was associated with increasing forest cover.
According to our results, coca crops promoted deforestation in Colombia between 2001 and 2014 through indirect (spilling-over to nearby areas), immediate and temporally-lagged mechanisms.
KEYWORDS:
Introduction
Colombian forests have been recognized as biodiversity hotspots due to the great variety of taxa they harbor, including endemic and highly endangered species (Baptiste et al., Citation2017; Myers et al., Citation2000). The country has a long history of human landscape transformation and degradation of its ecosystems that has been characterized by the conversion of forests to cattle pastures and monocultures such as oil palm (Elaeis guineensis) and coca (Erythroxylum coca). In this region, forest loss is caused by an interplay of different factors, including agriculture, cattle ranching, the construction of roads and mining, which are known causes of deforestation in many regions of the world (Armenteras et al., Citation2013, Citation2017; González-González et al., Citation2021; Lim et al., Citation2017). However, given the history of armed conflict and drug trafficking in Colombia, illicit crops have been recognized as an important cause of deforestation in the country as well (Álvarez, Citation2002; Armenteras et al., Citation2013, Citation2011). The logging and burning of native vegetation for the establishment of illicit crops, either for their expansion or the substitution of the crops that are eradicated by the government, produces a rapid conversion of forest ecosystems to pastures. Soil depletion leads to the search for, and permanent destruction of new areas (Álvarez, Citation2007). This phenomenon has a negative impact on tropical ecosystems, mainly in terms of forest fragmentation, which can lead to the loss of species with limited distribution ranges, to population reduction and to the loss of genetic diversity due to the low or null connectivity between the remnant patches (Hobbs & Yates, Citation2003; Lowe et al., Citation2004; Schlaepfer et al, Citation2018).
Illicit crop eradication programs also have negative impacts on species, which could increase their risk of extinction. For example, there may be a fragmentation of ecosystems caused by the substitution of illicit crops with alternative crops and the construction of infrastructure that generally requires deforestation of larger areas (Álvarez, Citation2007).
Given the importance of Colombian forests as biodiversity hotspots (Baptiste et al., Citation2017; Myers et al., Citation2000), their geographical coincidence with war-zones (Baptiste et al., Citation2017), and the current context of the implementation of the peace agreements with the former FARC guerrilla, there is a pressing need to elucidate the role that illicit crops has played in deforestation dynamics in Colombia and to identify which factors, if any, have led to that relationship. Understanding the causes and mechanisms of deforestation in the framework of illicit crops will help better prepare policymakers, state institutions and the society as a whole to face the new challenges that peace-building processes pose for ecosystems.
In the Colombian context, three non-exclusive mechanisms have been proposed to explain how coca crops can promote deforestation: 1) in the zones that are directly affected by armed conflict and drug trafficking, coca growers may be forced to migrate and establish new growing areas where there is native forest (Álvarez, Citation2003), 2) the increase in cocaine demand can encourage more farmers to grow coca and that those who already grow it, expand their growing areas. (Young, Citation1996); and 3) the eradication measures can force growers to migrate and establish coca crops in new areas, which will directly affect forest cover (Álvarez, Citation2003., Bradley & Millington, Citation2008).
The logging and burning of native vegetation for the establishment of illicit crops, either for their expansion or the substitution of the crops that are eradicated by the government in other places in the region, produces a rapid loss of forest ecosystems. Soil depletion leads to the search for, and permanent destruction of new forest areas (Álvarez, Citation2007). This has a negative impact on tropical ecosystems, mainly in terms of forest fragmentation, which can lead to the loss of species with limited distribution ranges, to population reduction and to the loss of genetic diversity due to reduction in, or lack of, connectivity between remnant patches (Schlaepfer et al, Citation2018; Hobbs & Yates, Citation2003; Lowe et al., Citation2004).
In this paper we study the role that illicit crops played in deforestation dynamics in Colombia between the years 2001 and 2014. Specifically, we assess the following: (1) the direct effect of illicit crops (coca and poppy crops) on forest cover in Colombia at the municipal level; (2) the effect of eradication measures (aerial fumigation and manual eradication) on forest cover; (3) the spread of deforestation within municipalities (lagged effect); and (4) the potential displacement of crops to neighboring municipalities (spillover effect).
We are focusing on illicit crops as the key variable of interest and we regard it as a proxy for armed conflict. This approach is justified by the fact that illegal crop expansion in Colombia can be largely explained by the activities of illegal armed groups (Díaz & Sanchez, Citation2004).
Materials and methods
Study area and unit of analysis
The study area comprises all 1120 municipalities of the continental land of Colombia. The Islands of San Andres, Providencia y Santa Catalina were excluded from the analyses because they were assumed to be less affected by the armed conflict.
Data and statistical analyses
We compiled a data base with annual information (2001–2014) for each of the 1120 municipalities (), for 9 explanatory variables and the amount of deforestation as response variable. The explanatory variables, which were not transformed, included the area planted with coca and poppy crops and forced displacement. Forced displacement was defined as the number of people expelled as a consequence of the armed conflict from each municipality per year.
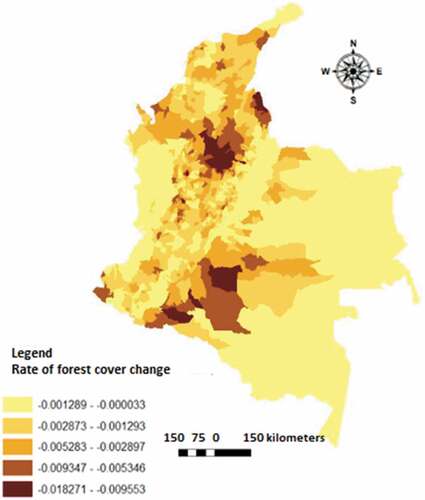
Figure 1. Forest cover change rate between 2000 and 2014. The legend colors indicate the deforestation value ranges. The darkest colors correspond to the highest deforestation rates and, the lighter colors correspond to the lower deforestation rates.
Deforestation was assessed from the global time series of forest change, which Hansen et al. (Citation2013) derived from Landsat satellite images. These annual raster data, with a resolution of 30 m x 30 m, classified each cell as either forested or non-forested based on vegetation height, considering forest as any vegetation taller than 5 m. In ArcMAP (version 10.4; ESRI, Citation2011), we used zonal statistics to quantify the annual amount of forest cover loss for each municipality for each year (2001–2014), and the total amount of forest cover in 2000. The polygon map of municipalities (Instituto Geográfico Agustin Codazzi [IGAC], Citation2016) was codified with the DANE code, which defines a unique ID for each municipality in Colombia. With raster calculator, we selected the values between 1 and 14 from the forest change raster, which indicate an event of forest loss in the year 2001–2014, respectively. Values of 0 indicated no forest loss. We then used ‘zonal statistics as table’ to calculate the deforested area in each municipality and year by multiplying the number of cells corresponding to the deforested category by 900 (=30 x 30) to obtain the deforested area in m2.
The average annual deforestation rate r for each municipality between 2000 and 2014 was calculated with the following formula developed by Puyravaud (Citation2003):
where A1 is the forest area at time t1 = 2000 and A2 is the forest area at time t2 = 2014. Note that deforestation will be indicated by negative values of r, whereas positive values indicate reforestation. This average rate may mask fluctuations among years, where forest cover could decrease one year and increase another year.
A polygon map of the average annual deforestation rates r was overlaid with a layer of the presence of FARC and ELN guerrillas and a layer of the coca and poppy crops between the years 2010 and 2013 to facilitate the visual analysis of deforestation dynamics in relation to the armed conflict. The data on the presence of the guerrilla groups was supplied by the Statistical Information Group of the National Defense Ministry. The data on illicit crops was obtained from the Illicit Crops Monitoring System of the United Nations (SIMCI), which has a rich database built from the analysis of satellite images (Oficina de las Naciones Unidas contra la Droga y el Delito [UNODC], Citation2016).
Additional explanatory variables were included to estimate the impact of illicit crops with greater reliability by controlling for demographic and socio-economic factors that have been recognized in the literature as determinants of deforestation, especially in tropical countries like Colombia (Geist & Lambin, Citation2001; Etter et al., Citation2006; Armenteras et al., Citation2011; Dávalos et al., Citation2011; Sánchez-Cuervo & Aide, Citation2013; Alvarez-Berríos & Aide, Citation2015; Armenteras et al., Citation2011; reviewed by Clerici et al., Citation2020). presents the variables included in this study and the sources from where they were obtained.
Table 1. Explanatory variables included in deforestation modelling
We conducted all the statistical analyses with the Stata software v. 12.1 (StataCorp, Citation2014). The data form a panel, with a time series of annual data for each municipality and the potential for cross-sectional dependence, where municipalities may be correlated, creating spatial autocorrelation in the dataset. We ran the Pesaran and Frees tests (De Hoyos & Sarafidis, Citation2006) to test for the presence of spatial autocorrelation. The latter is the coincidence between the values of a variable and the location of the spatial units, so that the attributes of a spatial unit are affected by the attributes of the neighboring spatial units. Spatial autocorrelation can be significant inside a country, where the socio-economic, political and environmental conditions can be shared by multiple spatial units (municipalities), generating common responses in them.
Since we detected statistically significant spatial autocorrelation in our data (p < 0.001 for both tests), we ran a set of models that take spatial autocorrelation into account to model the deforestation dynamics in Colombia between 2001 and 2014. Not taking spatial autocorrelation into account could lead to a violation of the statistical assumption of the independence and identical distribution of the residuals in a statistical model that is built based on this data (Dormann et al., Citation2007). So, to avoid this, we first built a spatial contiguity matrix that assigns a value of 1 or 0 to each pair of spatial units, depending on whether or not they are neighbors. We used this kind of spatial matrix because a distance- based neighbor matrix is not really applicable to contiguous polygons.
Then, we ran a set of fixed effects models (; spatial autoregressive model (SAR), spatial autocorrelation model (SAC), Spatial Durbin Model (SDM) and Spatial error model (SEM)) that incorporate spatial autocorrelation in different ways, with the xsmle command in Stata, using the annual deforestation values as the response variable and clustered standard errors. Models were fitted with a maximum likelihood approach, which can tolerate small deviations from normality (Fischer & Wang, Citation2011; LeSage & Pace, Citation2004). Because we used the absolute forest loss in terms of hectares, changes in areas of very little forest will have only a small effect on the results. In each of the models we included all the explanatory variables shown in . In some cases, a lagged effect of one year of deforestation was included using a dynamic panel model to test whether the amount of deforestation at time t depends on its value at time t-1. The dynamic-model specification was also applied in some models to determine the possible lagged effect of some explanatory variables on deforestation. The best model was selected based on the Akaike information criterion. The best combination of explanatory variables within that model was selected based on the AIC as well. Selecting for the best model and set of regressors with the AIC allowed us to test which implementation of spatial autocorrelation modelling is the best one for explaining relationship between the response and the explanatory variables.
Table 2. Spatial autocorrelation models with different specifications and their corresponding AIC value
Results
Change in forest cover at the municipality level
Between 2001 and 2014, the greatest loss of forest cover occurred in the following municipalities (): Macarena municipality (Meta department, central region); La Montañita (Caquetá department, central region); Puerto Guzman (Putumayo department, South-West region); Simacota, Puerto Parra, Cimitarra (Santander department, North-East region); Remedios, Segovia, Yondo, Zaragoza, Puerto Berrío, Caracolí, Retiro, maceo (Antioquia department, North-West region); Tibú (Norte de Santander department, North-East region) and Palestina (Caldas department, Eastern region). Other municipalities of the Antioquia, Caqueta, Putumayo, Nariño, Cauca, Meta, Santander, Norte de Santander and Magdalena presented considerable deforestation rates as well.
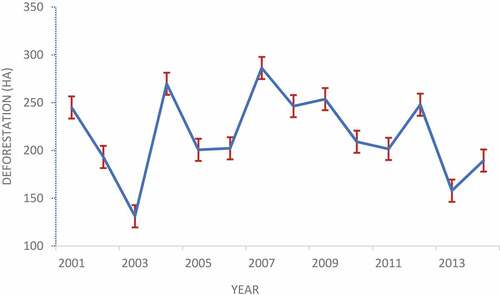
The annual deforestation rates, averaged across all municipalities (), showed considerable variation between 2001–2014. The years 2002 and 2013 presented the lowest amounts of deforestation, whereas the period between 2004–2012 had the higher rates of deforestation, with a maximum rate of forest loss in 2007.
Figure 2. Average deforestation in Colombia at the municipality level by year between 2001 and 2014. Red bars: SE.
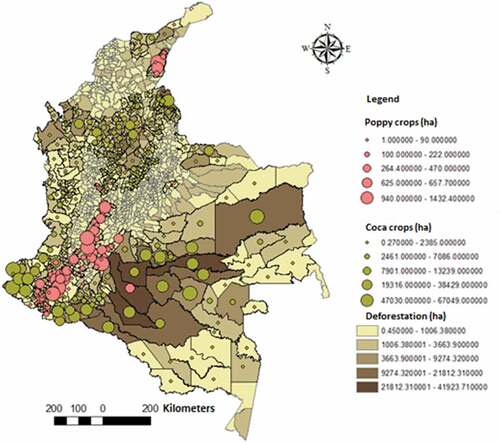
Compared to coca crops, poppy crops were less abundant, less wide-spread, and associated with lower values of deforestation (). Coca crops were concentrated in many of the areas with the highest deforestation rates in the country, such as the Amazon region. The spatial association between deforestation rates and the presence of the FARC and ELN guerrillas was not uniform (Figure S1), since some areas such as the region that goes from the Southwest to the Northwest of the country concentrated the presence of both guerrillas and presented less deforestation in comparison to other regions such as the central and Eastern regions of the country.
Figure 3. Deforestation, coca cops, and poppy crops in Colombia between 2010 and 2013.
Statistical analyses
According to the models that were evaluated (), the variables associated with illicit crops are the ones that better explain the deforestation dynamics in Colombia at the municipality level between 2001 and 2014. Given that the dynamic Durbin spatial model (SDM) with a spatially and temporally dependent response variable had the lowest AIC value, we selected it as the best model to explain those dynamics.
All the spatial Durbin models explained more than 50% of the variation in deforestation in the period between 2001 and 2014 (). The model with the lowest AIC value was Model 1 (R2 = 57%), which included the coca crops, poppy crops, coca crops eradicated by aerial fumigation, manually-eradicated coca crops, and forced displacement. According to this model, the manually-eradicated coca crops and poppy crops favored forest cover, while coca crops fostered deforestation. shows the coefficients for each of the explanatory variables included in this model.
Table 3. Spatial Durbin autocorrelation models with different regressors that explain deforestation included, with their corresponding Akaike information criterion value (AIC)
Table 4. Type of effect, explanatory variables and their corresponding coefficients for the selected Spatial Durbin model. The abreviations and explanation for the types of effects correspond to those in . * Significant at p < 0.05, ** Significant at p < 0.01, *** Significant at p < 0.001. (+): positive correlation. (-): negative correlation
According to the evaluation of the different regressors in the spatial regression Durbin models, the models that included poppy and coca crops, as well as forced displacement, performed better than those models that excluded these variables. Equally, according to all the Spatial Durbin models that included coca crops, this variable had a significant negative effect on forest cover (). This effect was indirect (spill-over effect), which means that coca crops in a spatial unit fostered deforestation in neighboring units. In only one of the models (model 3), coca crops had a direct effect (i.e. in the same spatial unit). In almost all models, the manually-eradicated coca crops favored forest cover in a local way (i.e. direct effect). In most cases, poppy crops indirectly favored forest cover through spill-over effects.
According to several models, between 2001 and 2014, deforestation had a lagged effect on itself, which means that deforestation in time 1 fostered deforestation after a certain period of time. Coca crops fostered deforestation both immediately and in a lagged way. In most cases, poppy crops favored forest cover both immediately and in a lagged way.
Discussion
Illicit crops and deforestation In Colombia, the use of illicit crops as a source of financing by illegal armed groups has caused an expansion of this crops and the destruction of large forest areas (Álvarez, Citation2007). In our study, in all the models where it was included, as well as in the best-performing deforestation model, the area cultivated with coca crops resulted to be a significant regressor, which indicates that this factor associated to the armed conflict has contributed to the loss of forest cover in Colombia. This is also supported by the fact that the model in which coca crops were excluded had the lowest performance. However, coca crops were not a good direct predictor (i.e. in the same spatial unit were they are located) of deforestation rates at the municipality level, which suggests that complex multivariate processes are the ones that determinate deforestation rates in each municipality. In any case, the analyses don’t support the idea that illicit crops have achieved a better care of the forests. Thus, the environmental impact of illicit crops, as a problem that has been exacerbated by the armed conflict (Díaz & Sanchez, Citation2004), cannot be ignored when measuring and evaluating the consequences of public order issues. Previous studies (Álvarez, Citation2007; Oficina de las Naciones Unidas contra la Droga y el Delito [UNODC], Citation2015, Citation2016) have found similar results, proving the great magnitude of the environmental consequences of illicit crops, especially in terms of deforestation
The explanatory power of our models was up to 57%, which suggests that illicit crops did explain an important part of the deforestation dynamics. In order to establish their role more clearly, further research should include other variables that have proven to be determinant factors of this problematic at different temporal and spatial scales. Among these are socioeconomic variables, such as poverty, infrastructure, agriculture, and cattle raising; and environmental variables, such as temperature and precipitation (Veldkamp et al., Citation1992; Mertens & Lambin, Citation1999; Southworth & Tucker, Citation2001; Laurance et al., Citation2002; Bautista-Cespedes et al., Citation2021; Dávalos et al., Citation2011; Sánchez-Cuervo & Aide, Citation2013). We did not include these variables in our study because there were no complete data bases available at the spatial resolution of our study, which exemplifies one of the many difficulties that must be overcome when modelling deforestation. Thus, the decision to model deforestation at fine spatial and temporal scales implied sacrificing explanatory variables, and as a consequence, possible sources of explanation.
We found pervasive spatial autocorrelation in deforestation rates, indicating indirect (spill-over) effects. This suggests that the mechanisms underlying the loss of forest cover in Colombia at fine spatial scales are complex, both spatially and temporally. Variables such as illicit crops can have direct or indirect, and immediate as well as retarded effects on deforestation. Coca crops, for example, promoted deforestation immediately in each period and with a lagged effect as well. The former is probably the result of the clearing of forest areas by coca growers in order to stablish their crops (Álvarez, Citation2007). The lagged and spatially indirect (spill-over) effects are probably the result of the mobile nature of these crops, because their establishment in a certain area at time t can promote the establishment of new crops at time t + 1 in neighboring areas. Similar patterns of neighbors’ interactions have been observed in other studies. In this context, the decision of an individual to clear the forest in a patch may influence the decision of his neighbors to take the same action (Amin et al., Citation2019). For example, Lobo & Velez (Citation2020) observed what they called a ‘model by contagion’ of the establishment of coca crops from south to north of the country between 2000 and 2016. In this context, the increase in coca crops in an area matched a reduction in a neighboring one. This phenomenon can also be explained by what has been called ‘the balloon effect of illegal crops’, which explains the geographical relocation of illicit crops as a response to repressive policies (López et al., Citation2016). Similarly, abandoned areas that used to have illicit crops are usually recolonized by new human populations that establish more intensive and extensive agricultural systems, which further promotes deforestation (Álvarez, Citation2001).
The importance of spillover effects on deforestation is further demonstrated by the fact that according to our results, the inclusion of a temporal and spatial lag for the dependent variable helped to better explain deforestation dynamics, given that the Spatial Durbin Model that included these lags performed much better than the one that did not ()
Our findings are consistent with those of time-series studies conducted by the United Nations Integrated Illicit Crops Monitoring System (Oficina de las Naciones Unidas contra la Droga y el Delito [UNODC], Citation2015, Oficina de las Naciones Unidas contra la Droga y el Delito [UNODC], Citation2016) and by Dávalos et al. (Citation2011). The latter authors found a negative effect of illicit crops on forest cover at a landscape scale. This effect was diluted at larger spatial scales, which suggests that other factors, which vary greatly in space and whose effects cannot be detected for large spatial units can significantly affect deforestation dynamics. This highlights the importance of working with fine temporal and spatial scales to detect patterns that may go unnoticed at larger scales, which is an advantage of the present study.
The overall positive effect that poppy crops had on forest cover in the analyzed period may be explained by the fact that these crops have a much more limited distribution than coca crops. In fact, their persistence requires more-specific environmental conditions than coca crops, and they are mostly established in the Andean region, where there is a greater State control. Besides, the eradication measures that have been employed for the poppy crops have been more effective, which may have shielded this region of the negative effects of coca crops on forest cover. These effects have been evident in more marginal regions of the country (Observatorio de Drogas de Colombia [ODC], Citation2016). Further research should focus on analyzing whether this relationship holds within regions, for example, to see if there is a difference between the Andean and Amazon regions.
It is important to highlight the direct positive effect that manual eradication had on forest cover as it slowed down deforestation, at least partially. This suggests that manual eradication is more effective than eradication by aerial fumigation, which has been proven to cause immediate defoliation in the forests near the coca crops (Álvarez, Citation2007) and negative effects on human health (Camacho & Mejía, Citation2015). Please note that in the time-series from which the deforestation data was obtained, trees were defined as all vegetation higher than 5 m, and therefore, it is not possible to distinguish between primary and secondary forest in our data, we cannot tell with certainty whether this effect is the result of forest regrowth or not. It is probable that the manual eradication of coca crops led to secondary forest, which does not necessarily harbor the diversity of primary forests (Gibson et al., Citation2011). On the other hand, we can say that the positive effect of manual eradication on forest cover is the result, at least in part, of slowed deforestation because according to our models, manual eradication was associated with smaller values of deforestation.
Other explanatory variables
The models that included forced displacement and coca crops as explanatory variables performed better than the ones that did not include them. However, we found no significant positive or negative effect of forced displacement on deforestation. These results contrast with the ones from previous studies. In Colombia, Fergusson et al. (Citation2014) found that the armed conflict with paramilitaries promoted deforestation in a 20-year period, and attributed this effect to the massive displacement of the civilian population by these illegal armed groups to establish illicit crops, and extensive mining, agriculture and cattle raising. Other studies have found that forced displacement can promote forest regeneration in abandoned lands (Álvarez, Citation2007; Sánchez-Cuervo & Aide, Citation2013; Stevens et al., Citation2011).
The fact that we did not detect any effect of forced displacement on deforestation may be due to contrasting relationships between these two variables in different municipalities. In these sense, in some municipalities forest cover may have been favored by forced displacement, while in others, forced displacement may have promoted deforestation.
Even though gold mining did not turn out to be a very important factor in this study, it is probable that it plays a more important role for the deforestation spatiotemporal dynamics, but that in order to be detected, it is necessary to include a more direct measure of formal mining. For this, a complete national data base would need to be assembled at fine spatial and temporal scales, which was not available for this study. Other authors (González-González et al., Citation2021) found a growing contribution of gold mining to deforestation in Colombia, specially between the years 2016–2018. However, this contribution was not predominant (around 3%), which is coherent with our results.
Conclusions
The factors that control deforestation are the product of complex interactions between political decisions and socioeconomic factors.In comparison to most studies about deforestation modelling (e.g. Dávalos et al., Citation2011; Sánchez-Cuervo & Aide, Citation2013), the present study did not cover a single period as temporal unit but considered each year individually from a wider time window, which reduces the impact of interannual variation in the units of analysis and variables on the statistics of change (Clark et al., Citation2012). This is particularly important when modelling deforestation, which is highly variable both temporally and spatially and depends on many variables (Etter et al., Citation2006).
According to our results, coca crops, played an important role in deforestation dynamics in Colombia between 2001 and 2014, through indirect (spill-over), immediate and temporally-lagged mechanisms. However, we cannot rule out that other factors are important in explaining deforestation in this period as well.
Supplemental Material
Download MS Word (638.3 KB)Acknowledgments
We acknowledge Dr. Fabio Sanchez from Universidad de los Andes for his valuable advice on the statistical analyses.
Disclosure statement
No potential conflict of interest was reported by the author(s).
Supplementary material
Supplemental data for this article can be accessed here.
References
- Alvarez-Berríos, N.L., & Aide, M.T. (2015). Global demand for gold is another threat for tropical forests. Environmental Research Letters, 10(1 014006). https://doi.org/10.1088/1748-9326/10/1/014006
- Álvarez, M.D 2001 Could peace be worse than war for Colombia’s forests? The Environmentalist 21 305–310 https://doi.org/10.1023/A:1012904318418
- Álvarez, M.D. (2002). Illicit crops and bird conservation priorities in Colombia. Conservation Biology, 16(4), 1086–1096. https://doi.org/10.1046/j.1523-1739.2002.00537.x
- Álvarez, M.D. (2003). Forests in the Time of Violence. Journal of Sustainable Forestry, 16(3–4), 47–68. https://doi.org/10.1300/J091v16n03_03
- Álvarez, M.D. (2007). Environmental damage from illicit drug crops in Colombia. In W. De Jong, D. Donovan, & K. Abe (Eds.), Extreme conflict and tropical forests (pp. 133–147). Springer.
- Amin, A., Choumert-Nkolo, J., Combes, J.-L., Combes-Motel, P., Kéré, E.N., Ongono-Olinga, J.-G., & Schwartz, S. (2019). Neighborhood effects in the Brazilian Amazônia: Protected areas and deforestation. Journal of Environmental Economics and Management, 93, 272–288. https://doi.org/10.1016/j.jeem.2018.11.006
- Armenteras, D., Cabrera, E., Rodríguez, N., & Retana, J. (2013). National and regional determinants of tropical deforestation in Colombia. Regional Environmental Change, 13(6), 1181–1193. https://doi.org/10.1007/s10113-013-0433-7
- Armenteras, D., Espelta, J.M., Rodríguez, N., & Retana, J. (2017). Deforestation dynamics and drivers in different forest types in Latin America: Three decades of studies (1980–2010). Global Environmental Change, 46, 139–147. https://doi.org/10.1016/j.gloenvcha.2017.09.002
- Armenteras, D., Rodríguez, N., Retana, J., & Morales, M. (2011). Understanding deforestation in montane and lowland forests of the Colombian Andes. Regional Environmental Change, 11(3), 693–705. https://doi.org/10.1007/s10113-010-0200-y
- Baptiste, B., Pinedo-Vasquez, M., Gutierrez-Velez, V., Andrade, G.I., Vieira, P., Estupiñán-Suárez, L.M., Londoño, M.C., Laurence, W., & Lee, T.M. (2017). Greening peace in Colombia. Nature Ecology and Evolution, 16(9), 1–7. https://doi.org/10.1038/s41559-017-0102
- Bautista-Cespedes, O.V., Willemen, L., Castro-Nunez, A., & Groen, T.A. (2021). The effects of armed conflict on forest cover changes across temporal and spatial scales in the Colombian Amazon. Regional Environmental Change, 2(70). https://doi.org/10.1007/s10113-021-01770-6
- Bradley, A.V., & Millington, A.C. (2008). Coca and colonists: Quantifying and explaining forest clearance under coca and anti-narcotics policy regimes. Ecology and Society, 13(1), 31. https://doi.org/10.5751/ES-02435-130131
- Camacho, A., & Mejía, D. (2015). The health consequences of aerial spraying of illicit crops: The case of Colombia. Working Paper 408. Center for Global Development.
- Clark, M.L., Aide, T.M., & Riner, G. (2012). Land change for all municipalities in Latin America and the Caribbean assessed from 250-m MODIS imagery (2001–2010). Remote Sensing of Environment, 126, 84–103. https://doi.org/10.1016/j.rse.2012.08.013
- Clerici, N., Armenteras, D., Kareiva, P., Botero, R., Ramírez-Delgado, J.P., Forero-Medina, G., Ochoa, J., Pedraza, C., Schneider, L., Lora, C., Gómez, C., Linares, M., Hirashiki, C., & Biggs, D. (2020). Deforestation in Colombian protected areas increased during post-conflict periods. Scientific Reports, 10(4971). https://doi.org/10.1038/s41598-020-61861-y
- Dávalos, L.M., Bejarano, A.C., Hall, M.A., Correa, H.L., Corthals, A., & Espejo, O.J. (2011). Forests and drugs: Coca-driven deforestation in tropical biodiversity hotspots. Environmental Science & Technology, 45(4), 1219–1227. https://doi.org/10.1021/es102373d
- De Hoyos, R., & Sarafidis, V. (2006). Testing for cross-sectional dependence in panel-data models. The Stata Journal, 6(4), 482–496. https://doi.org/10.1177/1536867X0600600403
- Díaz, A.M., & Sanchez, F. (2004). Geografía de los cultivos ilícitos y conflicto armado en Colombia. Documento CEDE. Universidad de los Andes.
- Dormann, C.F., M. Mcpherson, J., B. Araújo, M., Bivand, R., Bolliger, J., Carl, G., G. Davies, R., Hirzel, A., Jetz, W., Daniel Kissling, W., Kühn, I., Ohlemüller, R., R. Peres-Neto, P., Reineking, B., Schröder, B., M. Schurr, F., & Wilson, R. (2007). Methods to account for spatial autocorrelation in the analysis of species distributional data: A review. Ecography, 30 5 , 609–628. https://doi.org/10.1111/j.2007.0906-7590.05171.x
- ESRI. (2011). ArcGIS Desktop. (Release 10) [Computer software]. Environmental Systems Research Institute.
- Etter, A., McAlpine, C., Wilson, K., Phinn, S., & Possingham, H. (2006). Regional patterns of agricultural land use and deforestation in Colombia. Agriculture, Ecosystems & Environment, 114(2–4), 369–386. https://doi.org/10.1016/j.agee.2005.11.013
- Fergusson, L., Romero, D., & Vargas, J.F. (2014). The environmental impact of civil conflict: The deforestation effect of paramilitary expansion in Colombia. Serie de Documentos de Trabajo. No. 165 (Universidad del Rosario, Facultad de Economía).
- Fischer, M.M., & Wang, J. (2011 Modelling Area Data). . Spatial Data Analysis, 31-44 (SpringerBriefs in Regional Science). https://doi.org/10.1007/978-3-642-21720-3_3
- Geist, H.J., & Lambin, E.F. (2001). What drives tropical deforestation? A metaanalysis of proximate and underlying causes of deforestation based on subnational case study evidence. LUCC Report Series, 4. CIACO, Louvain-la-Neuve.
- Gibson, L., Lee, T.M., Kohn, L.P., Brook, B.W., Gardner, T.A., Barlow, J., Peres, C.A., Bradshaw, C.J.A., Laurance, W.F., Lovejoy, T.E., & Sodhi, N.S. (2011). Primary forests are irreplaceable for sustaining tropical biodiversity. Nature, 478, 378–382. https://doi.org/10.1038/nature10425
- González-González, A., Clerici, N., & Quesada, B. (2021). Growing mining contribution to Colombian deforestation. Environmental Research Letters, 16(6), 064046. https://doi.org/10.1088/1748-9326/abfcf8
- Hansen, M.C., Potapov, P.V., Moore, R., Hancher, M., Turubanova, S.A., Tyukavina, A., Thau, D., Stehman, S.V., Goetz, S.J., Loveland, T.R., Kommareddy, A., Egorov, A., Chini, L., Justice, C.O., & Townshend, J.R.G. (2013). High-resolution global maps of 21st-century forest cover change. Science, 342(6160), 850–853. https://doi.org/10.1126/science.1244693
- Hobbs, R.J., & Yates, C.J. (2003). Turner review no. 7. Impacts of ecosystem fragmentation on plant populations: Generalising the idiosyncratic. Australian Journal of Botany, 51(5), 471–488. https://doi.org/10.1071/BT03037
- Instituto Geográfico Agustin Codazzi. (2016). Shapefile del mapa de los municipios de Colombia.
- Laurance, W.F., Albernaz, A.K, Schroth, G, Fearnside, P.M., Bergen, S, Venticinque, E.M., and Da Costa, C 2002 Predictors of deforestation in the Brazilian Amazon J. Biogeogr 29 737–748
- LeSage, J.P., & Pace, R.K. (2004). Introduction. In J.-P. LeSage & R.-K. Pace (Eds.), Advances in econometrics: Volume 18: Spatial and spatiotemporal econometrics (pp. 1–32). Elsevier Ltd.
- Lim, C.L., Prescott, G.W., De Alban, J.D.T., Ziegler, A.D., & Webb, E.L. (2017). Untangling the proximate causes and underlying drivers of deforestation and forest degradation in Myanmar. Conservation Biology, 31(6), 1362–1372. https://doi.org/10.1111/cobi.12984
- Lobo, I.D., & Vélez, A. (2020). From strong leadership to active community engagement: Effective resistance to illicit economies in Afro Colombian collective territories. Documentos CEDE. Universidad de los Andes.
- López, L.R., Castro, J.A., & España, A.D. (2016). Balloon effects in coca crops in the Andean region (1990-2009). Apuntes del CENES, 35(61), 207–236. https://doi.org/10.19053/22565779.3426
- Lowe, A.J., Harris, S.A., & Ashton, P. (2004). Ecological genetics: Design, analysis and application (pp. 326). Blackwell.
- Mertens, B, and Lambin, E 1999 Modeling land cover dynamics: integration of fine-scale land cover data with landscape attributes Int. J. Appl. Earth Observ. Geoinform 1 1 48–52
- Myers, N., Mittermeier, R.A., Mittermeier, C.G., Da Fonseca, G.A.B., & Kent, J. (2000). Biodiversity hotspots for conservation priorities. Nature, 403(6772), 853–858. https://doi.org/10.1038/35002501
- Observatorio de Drogas de Colombia. (2016). Cultivos ilícitos. http://www.odc.gov.co/problematica-drogas/oferta-drogas/cultivos
- Oficina de las Naciones Unidas contra la Droga y el Delito. 2015 Monitoreo de cultivos de coca 2014. 152 p.
- Oficina de las Naciones Unidas contra la Droga y el Delito. (2016). Colombia: Monitoreo de Territorios afectados por cultivos ilícitos 2015 (pp. 146) (Oficina de las Naciones Unidas contra la Droga yel Delito).
- Puyravaud, J.-P. (2003). Standardizing the calculation of the annual rate of deforestation. Forest Ecology and Management, 177(1–3), 593–597. https://doi.org/10.1016/S0378-1127(02)00335-3
- Sánchez-Cuervo, A.M., & Aide, T.M. (2013). Identifying hotspots of deforestation andreforestation in Colombia (2001–2010): Implications for protected areas. Ecosphere, 4(11), 1–21. https://doi.org/10.1890/ES13-00207.1Schlaepfer
- Schlaepfer D R, Braschler B, Rusterholz H and Baur B. (2018). Genetic effects of anthropogenic habitat fragmentation on remnant animal and plant populations: a meta-analysis. Ecosphere, 9(10), e02488 10.1002/ecs2.2488
- Southworth, J, and Tucker, C.J. 2001 The influence of accessibility, local institutions and socioeconomic factors on forest cover change in the mountains of western Honduras Mt. Res. Dev 21 3 276– 283
- StataCorp. (2014). Stata statistical software. (Release 12.1). Computer software, College Station, TX: StataCorp LP.
- Stevens, K., Campbell, L., Urquhart, G., Kramer, D., & Qi, J. (2011). Examining complexities of forest cover change during armed conflict on Nicaragua’s Atlantic Coast. Biodiversity Conservation, 20(12), 2597–2613. https://doi.org/10.1007/s10531-011-0093-1
- Veldkamp, E, Weitz, A.M., Staritsky, I.G., and Huising, E.J. 1992 Deforestation trends in the Atlantic zone of Costa Rica: a case study Land Degrad. Rehab 3 2 71–84
- Young, K.R. (1996). Threats to biological diversity caused by coca/cocaine deforestation. Enivronmental Conservation, 23(1), 7–15. https://doi.org/10.1017/S0376892900038200