
 ?Mathematical formulae have been encoded as MathML and are displayed in this HTML version using MathJax in order to improve their display. Uncheck the box to turn MathJax off. This feature requires Javascript. Click on a formula to zoom.
ABSTRACT
Urban growth boundaries (UGBs) established by urban planning, are common containment strategies to prevent urban sprawl. We analyze the effectiveness of the UGB strategy in the case of the Metropolitan Region of Santiago de Chile, established by the land use plan in 1994. We describe and quantify the annual growth rate and the development of new built-up areas inside and outside the boundary using GIS. The results show that the expansion of built-up areas is greater outside than inside the UGB (75% vs. 49%), and with a higher annual growth rate outside the UGB (14.6% vs. 2.8%). To achieve greater effectiveness in the strategy, it is necessary to overcome those regulatory mechanisms that allow urbanization beyond the boundary, identified as a factor that promotes expansion, contradicting the objective of the plan.
1. Introduction
Urban expansion has been changing the earth’s surface at unprecedented rates over the last sixty years and during the 21st century is expected to become the greatest expansion of built land in all history (Seto et al., Citation2012). Urban sprawl; is an uncoordinated, low-density, dispersed, and rapid growth process, resulting in the fragmentation of territories (Abrantes et al., Citation2016; Gashu & Gebre-Egziabher, Citation2018; Robinson et al., Citation2005); has dominated urban expansion around the world since the mid-20th century. Nowadays, the urban sprawl pattern is a global phenomenon, forecasting that urban expansion will take place mostly in Africa and Asia but also in Latin-American cities, where these city cities will double their size by 2035 (Fuentes & Pezoa, Citation2018; Inostroza et al., Citation2013; De Lima & Da Silveira Neto, Citation2019; De Mattos, Citation2010).
Urban expansion, particularly through sprawling patterns, has been widely associated with negative consequences for the environment by polluting land, promoting deforestation, loss of agricultural lands, threatening biodiversity, but also affecting human health and enhancing spatial inequalities through urban segregation (Viana et al., Citation2019; Wei & Ewing, Citation2018). Urban containment strategies have emerged as potential solutions in urban planning to curb and counteract the negative effects of urban sprawl. One of the most commonly applied strategies is urban growth boundaries (UGBs), established through land-use planning acting as ‘push’ factors and promoting compactness and sustainable urban forms (Rafeq, Citation2006; Fertner et al., Citation2016; Wang et al., Citation2020; Zheng et al., Citation2017). A UGB can be defined as a ‘line drawn around a metropolitan area that delineates where urban development may take place (inside the UGB) and where it may not (outside the UGB)’ (Nelson & Moore, Citation1993, p. 294). UGBs seek to control urban development within an area, protect agriculture and vegetated land and reduce the economic costs of urban infrastructures by promoting high density (Calthorpe & Fulton, Citation2001; Tayyebi et al., Citation2011). These tools divide and assign territories with different regulations, protecting natural areas and establishing areas for agricultural uses outside the boundary, whereas areas inside the boundary receive the new built-up development (i.e. building zone; Gennaio et al., Citation2009). However, low-density developments may still occur beyond urban boundaries despite the prohibitions (Paül & Tonts, Citation2010; Robinson et al., Citation2005; Weber & Puissant, Citation2003).
The Urban Growth Boundary (UGB) strategy, which originated in the USA, has been widely applied in cities of the global north, which also concentrates the largest number of associated studies. In this regard, these studies analyze the role of the governance and decentralization process, the effectiveness of urban growth boundaries through de land use plan, or the mismatch between land regulation and land cover evolution The UGB strategy has proven to be successful in Switzerland and China but, on the other hand, it has not been so in Portugal, where urbanization had occurred beyond the delimited boundary, despite the legal prohibitions (Abrantes et al., Citation2016; Gennaio et al., Citation2009; Shao et al., Citation2020). Nevertheless, studies on the effectiveness of urban growth boundaries in the cities of the global south are limited (Horn, Citation2020). Existing research in countries in Asia, Africa, Latin America, and the Middle East, has generally shown limited success in the application of UGBs boundaries. (Heinrichs & Nuissl, Citation2015; Huang et al., Citation2019; Mubarak, Citation2004). Among others, the unsuccessful implementation of urban growth boundaries in the global south can be explained mostly by the following factors. On the one hand, urban expansion has proven to be currently much more rapid in those regions (Zhao et al., Citation2010). On the other hand, the high rural-urban migration patterns and the high prices of housing in urban centers are due to governmental neoliberal agendas. Thus, has given place to the localization of private housing developments and informal settlements beyond urban growth boundaries (Heinrichs & Nuissl, Citation2015), increasing the lack of access to services of urban developments established (Yunda & Sletto, Citation2020) or the increasing segregation beyond the boundary (Menzori et al., Citation2021). In this regard, the process of urban sprawl in Latin American cities has been widely documented, with the case of the Metropolitan Region of Santiago of Chile (MRS) being no exception (Coq-Huelva & Asián-Chaves, Citation2019; Fuentes & Pezoa, Citation2018; Inostroza et al., Citation2013), academic research has barely been explored the role of UGBs and its relationship with urban growth in cities of the global south (Gennaio et al., Citation2009; Hersperger et al., Citation2018; Horn, Citation2020)
In Chile, the UGB implemented in the MRS was re-established in 1994, after previously-approved neoliberal projects and reforms between 1970 and 1980, with a return to the paradigm of zoning and urban limits with the return of democracy in 1990 (Vicuña, Citation2017). The UGB was established by a land-use instrument in 1994 called ‘Plan Regulador Metropolitano de Santiago’ (PRMS). The main objectives of the PRMS were to promote a ‘compact city’, protect the environment and raise the quality of life of the inhabitants, establish an urban boundary, and a land-use regulation by a zoning strategy (Vicuña, Citation2017). The UGB was defined as an ‘imaginary boundary’ (Article #52, LGUC), which distinguishes the ‘city’ from the ‘non-city’, to prevent the city from sprawl (Petermann, Citation2006). In this sense, the Plan establishes, on the one hand, a building zone inside the urban boundary, expecting to receive the new built-up development called the ‘urban area’. On the other hand, the non-building zone, defined as a ‘non-urban area’, excludes new urban developments to preserve agricultural and natural areas, also establishing risk areas and areas for metropolitan infrastructures (Vicuña, Citation2017). The PRMS originally expected 59,330 Ha from 1994 to 2020 inside the urban growth boundary, but later experienced three relevant modifications (years 1997, 2006, and 2013). Considering these modifications, the PRMS is expected to receive a total of 102,179 Ha of new built-up developments inside the urban boundary by 2030 (Naranjo, Citation2017; Vicuña, Citation2017).
The existing evidence analyzing the evolution and modifications of the UGB strategy in the MRS has been done from both regulatory and policy-oriented points of view since the 1960s (Petermann, Citation2006; Vicuña, Citation2013). According to them, urban sprawl in this region occurred thanks to an alliance between public and private agents, which has promoted the development of a ‘suburban life’ (Barton & Ramírez, Citation2019; Heinrichs et al., Citation2009; Jiménez et al., Citation2018). In addition, other studies have modeled urban expansion prospective scenarios of Santiago using remote sensing (Puertas et al., Citation2014) or analyzed the relationship between land cover change and the protection of ecosystem services (Montoya-Tangarife et al., Citation2017). However, the role of urban planning is not properly integrated into these quantitative land-change assessments of urban expansion (Hersperger et al., Citation2018). Particularly, the effectiveness of the UGB has not been studied properly (Gennaio et al., Citation2009; Kasanko et al., Citation2006; Shao et al., Citation2020). More studies, for instance, quantifying the levels of new built-up developments occurring inside and outside the urban growth boundary in the MRS are needed.
In the context of a fast expansion of the Latin-American metropolis in the last decades, this paper will: (1) quantify urban expansion through changes in the built-up cover and its annual growth rate in the Metropolitan Region of Santiago (MRS) between 1997 and 2013 at both the regional and subregional levels; (2) compare them with the changes in population density; (3) analyze the capacity to control the built-up expansion the urban growth boundary (UGB) established by the PRMS by quantifying the new developments of built-up occurring in the urban area and the non-urban area.
This paper is organized as follows: in section 1 we have discussed the urban growth boundary (UGB) as a containment urban sprawl strategy, focusing on the MRS (Chile); Section 2 presents the study area and data analysis using official spatial data on land use covers and the PRMS from CONAF from 1997 and 2013 to determine the urban growth changes and to delimit the urban growth boundary; In section 3, we present the empirical results related to the quantification of urban sprawl in the period and the difference between population density at the regional and subregional level. Then, we evaluate the effectiveness of the UGB in the analyzed period; in section 4, the results of this study regarding the UGB are discussed and contrasted with related literature, by focusing on the main explanatory factors y. Finally, in section 5 we establish the main conclusions related to the urban delimitation strategy’s effectiveness and propose future research lines.
2. Methods
2.1. Study area
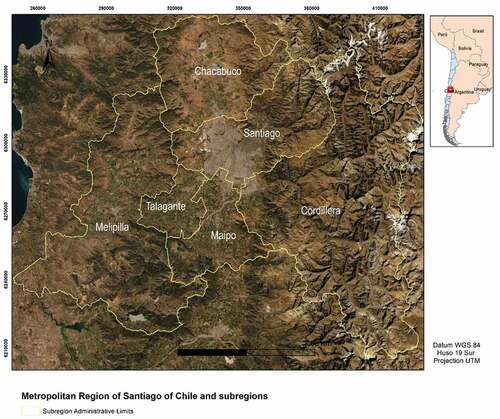
The Metropolitan Region of Santiago (MRS) in Chile is located between latitude 33°15ʹS and latitude 33°40ʹS and accounts for a total of 7,112,808 people (according to the 2017 census) representing 40% of the total population of the whole country (INE, Citation2018). Santiago, the capital city of Chile, is at the center of the region with a total surface of 1,527,962 Ha and is divided into 52 municipalities that can be grouped into 6 subregions or provinces: Chacabuco (in the north), Cordillera (in the Southeast), Maipo (in the South), Melipilla (in the West), Santiago (in the center) and Talagante (in the Southwest; ).
Figure 1. Metropolitan Region of Santiago of Chile and their 6 subregions. Source: Own production based on imagery Landsat /Copernicus Images from Google Earth Pro(Google, Citation2021).
2.2. Built-up and land cover land use classification
For this study, we defined the built-up area as ‘urban land cover and land use, impervious surfaces, and other manifestation of the built environment in an urban area’ excluding population or population density (Seto et al., Citation2011). Built-up definition has also been used in other studies based in the MRS (Hernández-Moreno & Reyes-Paecke, Citation2018; Puertas et al., Citation2014). To determine and quantify the built-up surface in the MRS through land cover change, we used an official land cover database produced by the National Forestry Corporation (CONAF) of Chile, which has been elaborated using satellite images registered in 1997 and 2013 (Montoya-Tangarife et al., Citation2017). This land cover dataset was reclassified from 41 categories in 1997 and 49 in 2013, respectively, to 6 categories using ArcGIS 10.7.1, which can be seen in and . This reclassification was based on land cover uses from previous studies (Henríquez-Dole et al., Citation2018; Puertas et al., Citation2013, Citation2014; Schulz et al., Citation2010). Then, the agriculture land category (category #1), considers the agricultural activities, crops, and agro-industrial infrastructure, and bare soil land cover (Category #2) considers areas without or little vegetation as rocks or land that has been cleared. Regarding the Built-up category (Category #3) CONAF defined urban land cover or built-up area as ‘Cities, towns, industrial zones, industrial mining, agricultural plots’, in the same cadastre with 90% accuracy. According to the rural subdivision law, the Agricultural plots consist of a 0.5-hectare subdivision of agricultural land upon which a house can be built (Abrantes et al., Citation2016; Naranjo, Citation2009). For this reason, they were integrated into Category #3. Related to the vegetated land (category #4), we observed inconsistencies in the dataset of 1997 about that of 2013, especially about the vegetation land cover due to changes in CONAF’s criteria to understand the forest, which affected the categories ‘Forest/Plantations’ and ‘Grasslands/Shrublands’ in 2001. In this sense, CONAF changed its methodology about what it understands as forest between 1997 and 2013. On the one hand, in 1997, a forest was defined as a site with vegetation formations dominated by trees in an area of 5,000 m2, with a tree canopy cover of 25% for the RM. On the other hand, for the year 2013, it considers foresting the sites with tree canopy coverage of 10%. For this reason, these categories were merged into one sole new Category #4 (Montoya-Tangarife et al., Citation2017). Related to ‘Water Bodies’ (category #5) and ‘Wetland’ (category #6), there was an increment in this surface between 1997 and 2013, because in 1997 there was a greater lack of knowledge of the glacier and wetland surface, and in 2014 an inventory was carried out, using this information for the land cover data set in 2013. Additionally, the temporal and spatial resolution of the satellite images was improved by the year 2013, because the remote sensing technology improved. In this regard, for CONAF (Citation1997), aerial photography with a digital photographic coverage scale of 1:20,000 and 1:30,000 from 1995 was used. The material was in paper format, to aid visual interpretation Related to CONAF (Citation2013), the SPOT 5 multispectral satellite images, with a resolution of 10 meters per pixel (green, red, and near-infrared bands) and at 20 m (mid-infrared) in UTM projection Huso 19 Datum WGS84 was utilized. In some marginal sectors and without image coverage, LANDSAT 8 (Citation2013) images were used.
Figure 2. Change in a built-up area in the metropolitan region of Santiago (MRS), Chile, between 1997 and 2013 and the urban growth boundary. Source: Own production based on land cover layers obtained from CONAF (Citation1997, Citation2013).
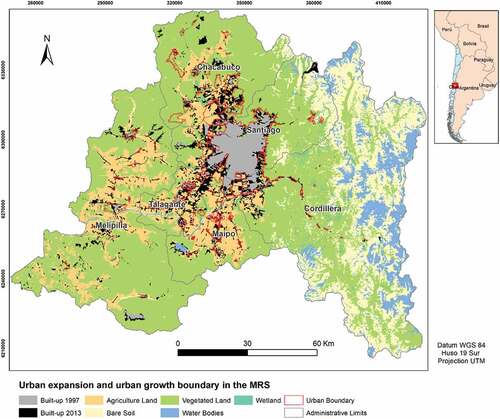
Table 1. Land cover land use categories of metropolitan region of Santiago (MRS), Chile, using CONAF land cover dataset from 1997 and 2013.
2.3. Annual growth rate (AGR) of built-up area and population density
To measure and compare the urban growth in the MRS at the regional and subregional levels, we used a standardized metric to quantify the built-up area and population density by year (Gennaio et al., Citation2009; Robinson et al., Citation2005). The annual growth rate was calculated as:
where the start is the extent of the urban area at the initial period, UEend is the extent of the study in the final period, and the period of the study is in years (Seto et al., Citation2011, p. 3). We quantified the built-up expansion intersecting CONAF land cover layers from 1997 and 2013, comparing changes in the population density between 1992 and 2017 from the National Statistics Institute (INE) of Chile census. The density of developed land was calculated using the CONAF built-up surface in 1997 and 2013 and dividing this surface by the total population density in 1992 and 2017 respectively, at the regional and subregional levels (Gennaio et al., Citation2009).
2.4. The built-up surface and the urban growth boundary (UGB) established by the PRMS
The Regulatory Plan of the Metropolitan Region of Santiago (PRMS) in 1994 planned 59,300 Ha in the building zone by 2020 (Petermann, Citation2006). However, the urban boundary was changed several times, with the last modification in 2013 in which a total of 102,179 Ha of built land inside the urban boundary were expected (MINVU, Citation2022). In addition to this, we calculated the annual growth rate as 2.9% of the built-up area expected by the PRMS in the building zone, between 1994 to 2013 also using the annual growth rate (AGR) of expected new developments (Seto et al., Citation2011). These data were useful to compare the built-up expansion against the built-up planned by the PRMS and their annual growth rate, at the regional level.
Regarding the urban growth boundary, we used the latest modification of the UGB of the MRS to evaluate the effectiveness of the PRMS in controlling the built-up expansion within and outside the building zone. To do so, we used the official urban boundary established by MINVU in 2013, which defines the urban and non-urban areas. Using this urban growth boundary, we intersected it with the layer of built-up areas of 1997 and 2013 using GIS, to quantify how many built-up areas existed in the urban and non-urban areas in 1997 and later in 2013, to determine the difference in a built-up area in these areas in the 16-year period, according to other studies (Gennaio et al., Citation2009; Kasanko et al., Citation2006). Additionally, we calculated the annual growth rate of the built-up expansion and the density per Ha inside and outside the urban boundary at the regional and subregional levels to analyze its relationship, as seen in previous studies (Fuentes & Pezoa, Citation2018; Torrens & Alberti, Citation2000).
3. Results
3.1. Land use land cover changes in the MRS for the period 1997 and 2013
The built-up surface in the Metropolitan Region of Santiago (MRS), Chile, increased by 124% between 1997 and 2013, growing from 60,130 to 134,750 Ha (), representing an annual growth rate (AGR) of (5.2%) (3,860 Ha/year; ).
Table 2. Land use land cover change by categories in the MRS (1997–2013).
Table 3. Built-up and population density in MRS and the Urban growth boundary, between 1997 and 2013.
At the subregional level (), all subregions increased their built-up surface during this period in two tendencies. On the one hand, four subregions expanded their building area by more than 400% for this period and showed an annual growth rate (AGR) greater than +11%: Chacabuco (12.7%), Melipilla (12.1%), Talagante (11.4%), and Maipo (11.1%). On the other hand, they were followed by Cordillera and Santiago, with lower overall growth (176% and 38%, respectively) and lower annual rates of growth (6.5% and 2%, respectively) in their built-up area.
In terms of the population density (), we also detected two tendencies related to changes in the built-up. First, the subregions with higher AGR of built-up area (over +11%), lost population density between (−5%) and (−8%) by year, highlighting Melipilla who lost density at the higher annual rate in the period (−8% vs +12.1%), even higher than Chacabuco which has the higher AGR of built-up (−5% vs +12.7%). Second, Cordillera and Santiago, which had the lower annual rate of built-up, also had the lower annual rate of decrease in population density (Cordillera: −1% vs +6.5%; Santiago: −1% vs +2%, respectively).
3.2. Urban growth boundary (UGB) and the built-up expansion in the MRS
The developed built-up area in the MRS increased by 74,620 Ha between 1997 and 2013, indicating that there was a higher growth than it was planned by the PRMS (134,750 Ha vs. 102,179 Ha). Also confirmed by the annual growth rate of developed built-up areas, which almost doubled that of the AGR planned in the PRMS (+5.2% vs. +2.9%), as noted in .
Furthermore, the newly built-up area was located to a greater extent in the non-urban area (75% out of 124%) than in the urban area (49% out of 124%; ). An additional 44,933 Ha of built-up area in the non-urban area (44,933 Ha out of 74,620 Ha) and 29,687 Ha in the urban area (29,687 Ha out of 74,620 Ha) were incorporated (). More importantly, while the AGR of built-up expected by the PRMS in the urban area was similar to the increase by year of the built-up area observed (+2.9% vs. +2.8%), it was almost five times less in the non-urban area (+2.9 vs. +14.6%). As a result, the built-up area in the urban area in 2013 occupied a total of 82% of the urban surface expected by the PRMS by the year 2030, with 17 years still to come (84,128 Ha vs. 102,179 Ha). Additionally, when these changes are contrasted with changes in population density, inside the urban boundary the density almost did not vary (−0.8%). However, outside the urban growth boundary, this difference was higher, with the AGR of population density decreasing at a higher rate than inside the urban area (−11.1% vs. −0.8%).
Figure 3. Percentage (%) of built-up change between 1997 and 2013 in the MRS and the subregions, according to the urban growth boundary (UGB) of the PRMS.
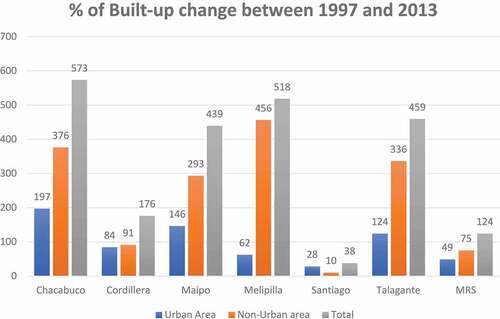
At the subregional level, the built-up surface of all subregions increased more in the non-urban area than the urban area, except for Santiago (urban area 28% vs. non-urban area 10%; ). Melipilla’s growth is noteworthy since it proved to be the subregion with the highest difference of built-up between inside and outside the urban growth boundary (urban area 62% vs. non-urban area 456%; ). In annual terms, when comparing the AGR of observed built-up with the expected built-up by the PRMS inside the urban area, Santiago was the only subregion in which the built-up grew less than that forecasted by the Plan (+1.6% vs. +2.9%). On the other hand, the rest of the subregions showed a superior AGR in their actual built-up area compared to what was expected. Chacabuco was the subregion with the highest difference, being the actual growth three times higher than the expected built-up (+8.9% vs. +2.9%). Moreover, all the subregions increased their built-up area in the non-urban areas of the urban growth boundary (UGB) at a higher pace than inside. In this line, Maipo showed the highest AGR outside the UGB (+23.9%), followed by Talagante (21%), Chacabuco (17.1%), Melipilla (14.3%), Cordillera (12.4%), and, finally, Santiago (7.7%; ).
In contrast with the AGR of population density, inside the UGB, this indicator decreased for almost all the subregions, except for Cordillera which was the only subregion that gained population density (+0.6% and an AGR of built-up of +6.5%). Melipilla and Maipo were the subregions with the highest decrease in the AGR of population density (−3.1% and −2.7%) that coincided with a high AGR of built-up (+6.2%) inside the UGB. Whereas, Chacabuco had the higher AGR of built-up inside the UGB and the second-highest rate of population density decrease (+8.9% vs. −1.8%). On the other hand, in the non-urban area, all the subregions decreased their population density at a higher rate than the urban area, highlighting Maipo and Talagante, which showed the highest AGR of built-up (+23.9% and +21%, respectively) while they also showed the higher AGR in losing population density (−16.6% and −14.2%, respectively).
4. Discussion
4.1. The urban expansion process in MRS
As we expected, our findings show how the urban area in the Metropolitan Region of Santiago (MRS) expanded between 1997 and 2013, as seen in other studies based in this region (Fuentes & Pezoa, Citation2018; Jiménez et al., Citation2018; De Mattos et al., Citation2004). This territory has especially expanded the built-up area and decreased its population density in its peri-urban areas (Heinrichs & Nuissl, Citation2015), following similar sprawling patterns to other Latin-American cities in Mexico, Argentina, and Brazil (Heinrichs & Nuissl, Citation2015; Menzori et al., Citation2021). Besides, it was less dense than other Latin American cities, such as Bogotá or Lima but similar to Buenos Aires (Yunda & Sletto, Citation2020).
The annual growth rate of built-up area in this region was particularly accelerated in the period of study, by doubling the annual growth rate of the 1980s or 1990s (Petermann, Citation2006). However, there exist differences at the subregional level. As seen in previous studies (Fuentes & Pezoa, Citation2018; De Mattos, Citation2010), the higher growth rates (+11%) were detected in the 4 subregions located in the peri-urban metropolitan areas: Chacabuco, Melipilla, Maipo, and Talagante. Among these, Chacabuco, located in the north, was the subregion with the highest annual growth rate of built-up expansion, most of this, due to the development of privately-promoted low-density urbanizations allowed by the DL 3,516 Act and the expansion of the highway network in the region (Naranjo, Citation2009; Vicuña, Citation2017). The subregions of Cordillera and Santiago showed an annual growth rate at slower paces for two reasons as other studies had documented (De Mattos, Citation2010; Puertas et al., Citation2014). In the case of the Cordillera subregion, the lower growth rate can be explained by the fact that the Andean Mountains operate as a natural barrier adding to the fact that the PRMS restricts all construction above an elevation of 1000 m.a.s.l (Puertas et al., Citation2014). On the other hand, the Santiago subregion concentrates the consolidated urban zone, characterized by vertical growth and densification (Fuentes & Pezoa, Citation2018; Vicuña, Citation2020). In general terms, there was a population density loss in the whole region, accounting for the trend identified in other studies exploring its urban growth patterns (De Mattos et al., Citation2004; Naranjo, Citation2009). This coincides with the fact that the four subregions that expanded at the highest rate were those that also lost density at the highest rate: Melipilla, Maipo, Talagante, and Chacabuco.
4.2. The effectiveness of the Urban growth boundary in the MRS
When focusing on the role of the urban growth boundary (UGB) established by PRMS, findings in this study have shown that the growth of built-up in the MRS mainly occurs in the non-urban area (75%) compared to the urban area (49%), with similar or even higher than the forecasted in previous studies (Hernández-Moreno & Reyes-Paecke, Citation2018; Puertas et al., Citation2014). In this line of thought, it can be said that the PRMS proved to have not successfully controlled the urban expansion in the MRS. Moreover, other studies even claim that the UGB strategy could promote further urbanization in the way of ‘leapfrog’ development (Silva & Ma, Citation2021; Zhang et al., Citation2017).
In the MRS and other Latin-American urban areas such as Bogota, Buenos Aires o Sao Paulo, the implementation of a UGB has been debated, highlighting the negative impacts on the prices of land and its inability to reduce urban growth (Menzori et al., Citation2021; Silva & Ma, Citation2021; Vicuña, Citation2017). In these areas, urban expansion occurs beyond the allowed limits through the construction of informal settlements characterized by a shortage of infrastructure services and limited public services (Yunda & Sletto, Citation2020). In addition, privately promoted clusters of single-family housing condominiums with controlled access aimed at middle- or high-income families beyond the UGB limits occur (Hidalgo, Citation2004; Yunda & Sletto, Citation2020), and are facilitated by the construction of highways that enhanced car accessibility and the potential new land valuation (Hidalgo & Borsdorf, Citation2007; De Mattos et al., Citation2004; Vicuña, Citation2013).
The main reason behind the inability to control urban growth in the non-urban area in the MRS is the State itself which establishes a ‘planned urban expansion’ (Barton & Ramírez, Citation2019; Jiménez et al., Citation2018; Pagliarin, Citation2018). The built-up expansion in the non-building zone in the MRS is allowed by the State, establishing different regulatory mechanisms that allow the uncontrolled expansion. In this sense, studies identified them as ‘regulatory weakness’ (Silva & Vergara-Perucich, Citation2021, p. 16; Vicuña, Citation2013). Furthermore, other studies state that built-up expansion is hence not necessarily an ‘un-planned phenom, but rather a different planned local and regional land-use strategy’ (Pagliarin, Citation2018, p. 3650). Four norms that produce these ‘regulatory weaknesses’ and promote urban expansion in the non-urban area have been identified. First, Decree-Law #3,516 of 1980 regarding rural properties allows the subdivision of rural properties into lots of 0.5 Ha each known as agricultural plots, allowing low-density urban development beyond the urban boundary, especially in Chacabuco and Maipo subregions (De Mattos et al., Citation2004; Naranjo, Citation2009; Vicuña, Citation2013). In this regard, this type of regulation allows low-densities houses in rural areas, to consume natural habitats greater than compact developments, similarly to the case of Seattle, USA (Robinson et al., Citation2005). Second, the modification of the PRMS in 1997 by incorporating the concept of ‘planning with conditions’ in Chacabuco, allowed the converting of non-urban areas into urban areas, especially agricultural land (Jiménez et al., Citation2018; Vicuña, Citation2013). Third, the urbanism and constructions general law (Article #55, General Law of Urbanism and Construction, Ministry of Housing and Urban Planning, MINVU), allowed the construction of social housing outside the urban limit, opening up the real estate sector offers of land that was banned at the time (Jiménez et al., Citation2018). Finally, the same PRMS in Article #8 related to the ‘macro area excluded for urban development’ (non-building zone), allows the subdivision of agricultural land into lots of 4 Ha with a house for each lot, also allowing to install of public housing complexes for low-income households, allowing to place industrial development with some conditions, and finally to place specific equipment and infrastructure in the non-building zone (Vicuña, Citation2013).
The PRMS, through its UGB, showed less capacity to control the urban expansion inside the urban area than other most successful plans executed in Oregon, China, or Switzerland, receiving more built-up developments inside the building zone than outside (Dempsey & Plantinga, Citation2013; Gennaio et al., Citation2009; Shao et al., Citation2020). Bearing in mind that there exist sociodemographic and urban planning differences between the MRS and North American or European urban areas such as higher pace of urban growth acquires, the rates of rural-urban migration, together with the type of construction that occurs (informal or self-built housing in the peri-urban areas; Heinrichs & Nuissl, Citation2015; Yunda & Sletto, Citation2020), certain aspects of successfully applied UGBs could help explain the inability to control urban growth of the PRMS. The UGB in the MRS was modified three times in less than 20 years, increasing the surface of the planned buildable urban area, which reflects that it was not able to contain the accelerated urban growth (Hidalgo & Borsdorf, Citation2007). However, the UGB applied by the State of Oregon established a 20-year horizon to urban growth, which helped meet population growth for the planned period as it also happened in Zurich through the Swiss Land Use Plan (Dempsey & Plantinga, Citation2013; Gennaio et al., Citation2009; Nelson & Moore, Citation1993). The State of Oregon also established local plans with explicit and coherent objectives that provide clear guidelines for building developments. In addition, the containment strategy was reinforced with a housing policy that achieved affordability in central areas and access to adequate transportation infrastructure. In addition, a law prohibiting development beyond the boundary, except for some supplementary agricultural and forestry zoning, was passed also protecting land reserves for future urban development (Dempsey & Plantinga, Citation2013; Nelson & Moore, Citation1993).
This study is not without limitations. There exists a challenge related to the availability of official land cover data from public institutions such as CONAF. In this sense, in the period 1997–2013, we identified changes in the used methodology of remote sensing of land cover, which may explain why there are differences in some categories of cover changes such as wetlands. In addition, CONAF prepared the land cover map using different remote sensing technologies at different temporal and spatial resolutions, which may influence the results obtained. Moreover, more updated spatial information is needed since CONAF’s land cover classification has not been renovated since 2013. It is of key importance to have standardized and periodically published public land cover quality data to implement efficient and well-designed urban planning tools and decision-making processes. In this regard, the built-up category used in this study remained equally calculated in the selected period and has been supported by the land use land cover literature, being useful to quantify the built-up expansion in the building and non-building zone in the MRS. This study contributes to spatial planning literature, being one of the few pieces of evidence exploring the effectiveness of UGBs in global south cities, putting the focus on a region with a particularly accelerated urban growth and which had not been previously analyzed from this perspective (Puertas et al., Citation2014). Although urban expansion and sprawl related to the MRS have been widely documented in the literature, the main contribution of this study was to analyze the effectiveness of the UGB of the PRMS as an urban containment tool by quantifying the newly built developments inside and outside the urban buildable area.
5. Conclusions
This study has quantified urban expansion and its relationship with density changes in the Metropolitan Region of Santiago (MRS), Chile, between 1997 and 2013 at both regional and subregional levels. In addition, the effectiveness of the strategy of the Regulatory Plan of the Metropolitan Region of Santiago (PRMS) to control built-up growth through the application of an urban growth boundary has also been analyzed, by comparing the actual new built-up areas with the urban and non-urban areas established in the Plan. The results showed that urban expansion in this region was particularly accelerated in the study period with remarkable increases in the built-up of the MRS at both the regional and subregional levels. This urban expansion occurred at a higher rate outside the urban growth boundary (non-urban area) than inside (urban area), showing the ineffectiveness of this regional and urban planning tool established by the PRMS. In addition, we note that for both the entire region and subregions, the evidenced reduction in population density, especially in the non-urban area, confirms the presence of sprawling patterns, which, consequently, has led to a loss of agricultural and vegetative land for the period studied.
This study has provided evidence of how planning instruments that present a normative weakness, that is, regulations that allow urbanization beyond the limit, can enhance urban sprawl rather than control it. To better understand the urban growth boundary as a containment strategy, future studies should consider the ‘regulatory weakness’ problem during the implementation of land use instruments and why they occur. Moreover, it is necessary to analyze in depth what kind of new built-up areas and their spatial patterns occur beyond the urban growth boundary. Besides, we identified which land-use regulations allow this, such as the DL 3,516 that allows single-family housing in non-urban areas.
Future studies should analyze the phenomenon of urban sprawl beyond the urban growth boundary, using a smaller scale of analysis through more standardized and updated remote sensing information. In addition, future studies should delve deeper into the role of regulatory and urban planning factors in the orientation and densification of new urban developments, to overcome the regulatory weaknesses identified in the Chilean case. Especially in the cities of the global south, due to their rapid expansion and the promotion of neoliberal reforms in recent decades.
The identified regulatory mechanisms have been shown to contradict the main objective of the PRMS and the UGB strategy, which is to promote a compact city. To avoid the negative socioeconomic and environmental consequences of uncontrolled urban growth, urban planners and decision-makers must increase efforts to work towards the development of clear regulations and planning tools that promote compact urban growth in metropolitan regions. In this regard, authorities should develop planning tools that prohibit low-density developments outside the UGB and promote a process of balancing permitted and actual densification, as well as promoting densification of developments in already-built areas within the UGB. In addition, they should facilitate housing affordability in core areas through housing policies that complement the UGB strategy with adequate access to transportation infrastructure, as in the case of Oregon.
Disclosure statement
No potential conflict of interest was reported by the author(s).
Correction Statement
This article has been republished with minor changes. These changes do not impact the academic content of the article.
Additional information
Funding
References
- Abrantes, P., Fontes, I., Gomes, E., & Rocha, J. (2016). Compliance of land cover changes with municipal land use planning: Evidence from the Lisbon metropolitan region (1990-2007). Land Use Policy, 51 May 2015 , 120–134. https://doi.org/10.1016/j.landusepol.2015.10.023
- Barton, J.R., & Ramírez, M.I. (2019). the role of planning policies in promoting urban sprawl in intermediate cities: Evidence from Chile. Sustainability (Switzerland), 11(24), 1–17. https://doi.org/10.3390/su11247165
- Calthorpe, P., & Fulton, W. (2001). The regional city: Planning for the end of sprawl. ISLAND PRE.
- CONAF. (1997). Land use and vegetation cadastre of Metropolitan Region of Santiago.
- CONAF (2013). Monitoring of changes, cartographic correction, and updating of the native forest cadastre in the regions of Valparaiso, Metropolitan, and Libertador Bernardo O’higgins. [dataset].
- Coq-Huelva, D., & Asián-Chaves, R. (2019). Expansión Urbana y políticas urbanas sostenibles. Una revisión de los casos de Lima, Ciudad de México y Santiago de Chile [Urban sprawl and sustainable urban policies. A review of the cases of Lima, Mexico City and Santiago de Chile]. Sustainability (Switzerland), 11(20), 5835. https://www.mdpi.com/2071-1050/11/20/5835
- De Lima, R.C.A., & Da Silveira Neto, R.M. (2019). Zoning ordinances and the housing market in developing countries: Evidence from Brazilian municipalities. Journal of Housing Economics, 46(August 2018), 101653. https://doi.org/10.1016/j.jhe.2019.101653
- De Mattos, C., Ducci, M.E., Rodríguez, A., & Yañez, G. (2004). Santiago en la globalización: ¿Una nueva ciudad? (Carlos De Mattos, M. E. Ducci, A. Rodríguez, & G. Yáñez (eds.). Ediciones).
- De Mattos, C. (2010). Globalización y metamorfosis metropolitana en América Latina . De la ciudad a lo urbano generalizado. Revista de Geografia Norte Grande, 104 Marzo 2010 , 81–104 doi:10.4067/S0718-34022010000300005.
- Dempsey, J.A., & Plantinga, A.J. (2013). How well do urban growth boundaries contain development? Results for Oregon using a difference-in-difference estimator. Regional Science and Urban Economics, 43(6), 996–1007. https://doi.org/10.1016/j.regsciurbeco.2013.10.002
- Fertner, C., Jørgensen, G., Sick Nielsen, T.A., & Bernhard Nilsson, K.S. (2016). Urban sprawl and growth management – Drivers, impacts, and responses in selected European and US cities. Future Cities and Environment, 2 September 2016 , 9. https://doi.org/10.1186/s40984-016-0022-2
- Fuentes, L., & Pezoa, M. (2018). Nuevas geografías urbanas en Santiago de Chile 1992 - 2012. Entre la explosión y la implosión de lo metropolitano. Revista de Geografia Norte Grande, 2018(70), 131–151. https://doi.org/10.4067/S0718-34022018000200131
- Gashu, K., & Gebre-Egziabher, T. (2018). Spatiotemporal trends of urban land use/land cover and green infrastructure change in two Ethiopian cities: Bahir Dar and Hawassa. Environmental Systems Research, 7(January 2018 1–15). https://doi.org/10.1186/s40068-018-0111-3
- Gennaio, M.P., Hersperger, A.M., & Bürgi, M. (2009). Containing urban sprawl-Evaluating effectiveness of urban growth boundaries set by the Swiss Land use plan. Land Use Policy, 26(2), 224–232. https://doi.org/10.1016/j.landusepol.2008.02.010
- Google. (2021) . Google Earth Pro 7.3.4.8248. Satellite Image Landsat/Copernicus.
- Heinrichs, D., Nuissl, H., & Rodríguez, Y.C. (2009). Dispersión urbana y nuevos desafíos para la gobernanza (metropolitana) en América Latina: El caso de Santiago de Chile. Eure, XXXV Agosto 2008 , 29–46. https://doi.org/10.4067/S0250-71612009000100002
- Heinrichs, D., & Nuissl, H. (2015). Suburbanization in Latin America : Towards new authoritarian modes of governance at the urban margin Pierre Hamel and Roger Keil . In Suburban Governance. University of Toronto Press 1–23 . doi:https://doi.org/10.3138/9781442663565
- Henríquez-Dole, L., Usón, T.J., Vicuña, S., Henríquez, C., Gironás, J., & Meza, F. (2018). Integrating strategic land use planning in the construction of future land use scenarios and its performance: The Maipo River Basin, Chile. Land Use Policy, 78(May), 353–366. https://doi.org/10.1016/j.landusepol.2018.06.045
- Hernández-Moreno, Á., & Reyes-Paecke, S. (2018). The effects of urban expansion on green infrastructure along an extended latitudinal gradient (23°S–45°S) in Chile over the last thirty years. Land Use Policy, 79(December 2017), 725–733. https://doi.org/10.1016/j.landusepol.2018.09.008
- Hersperger, A.M., Oliveira, E., Pagliarin, S., Palka, G., Verburg, P., Bolliger, J., & Grădinaru, S. (2018). Urban land-use change: The role of strategic spatial planning. Global Environmental Change, 51(June 2017), 32–42. https://doi.org/10.1016/j.gloenvcha.2018.05.001
- Hidalgo, R. (2004). De los pequeños condominios a la ciudad vallada: Las urbanizaciones cerradas y la nueva geografía social en Santiago de Chile (1990-2000). Eure, 30(91), 29–52. https://doi.org/10.4067/s0250-71612004009100003
- Hidalgo, R., & Borsdorf, A CEPAL 10 April . (2007) Taller Nacional sobre “Migración interna y desarrollo en Chile: diagnóstico, perspectivas y políticas” 1–17 .https://www.cepal.org/sites/default/files/courses/files/rhidalgo.pdf .
- Horn, A. (2020). Reviewing implications of urban growth management and spatial governance in the global south. Planning Practice and Research, 35(4), 452–465. https://doi.org/10.1080/02697459.2020.1757228
- Huang, D., Huang, J., & Liu, T. (2019). Delimiting urban growth boundaries using the CLUE-S model with village administrative boundaries. Land Use Policy, 82(September 2018), 422–435. https://doi.org/10.1016/j.landusepol.2018.12.028
- INE. (2018). Instituto Nacional de Estadísticas Junio/2018. 27. https://www.censo2017.cl/descargas/home/sintesis-de-resultados-censo2017.pdf
- Inostroza, L., Baur, R., & Csaplovics, E. (2013). Urban sprawl and fragmentation in Latin America: A dynamic quantification and characterization of spatial patterns. Journal of Environmental Management, 115 March 2012 , 87–97. https://doi.org/10.1016/j.jenvman.2012.11.007
- Jiménez, V., Campesino, A.J., Hidalgo, R., & Alvarado, V. (2018). Normalización del modelo neoliberal de expansión residencial más allá del límite urbano en Chile y España. Eure, 44(132), 27–46. https://doi.org/10.4067/s0250-71612018000200027
- Kasanko, M., Barredo, J.I., Lavalle, C., McCormick, N., Demicheli, L., Sagris, V., & Brezger, A. (2006). Are European cities becoming dispersed? A comparative analysis of 15 European urban areas. Landscape and Urban Planning, 77(1–2), 111–130. https://doi.org/10.1016/j.landurbplan.2005.02.003
- Menzori, I.D., De Sousa, I.C.N., & Gonçalves, L.M. (2021). Urban growth management and territorial governance approach: A master plans conformance analysis. Land Use Policy, 105(September 2020), 105436. https://doi.org/10.1016/j.landusepol.2021.105436
- (MINVU), M. of H. and U. P. (2022). PRMS. PRMS. https://metropolitana.minvu.gob.cl/pag-m/prms/
- Montoya-Tangarife, C., De la Barrera, F., Salazar, A., & Inostroza, L. (2017). Monitoring the effects of land cover change on the supply of ecosystem services in an urban region: A study of Santiago-Valparaíso, Chile. PLoS ONE, 12(11), 1–22. https://doi.org/10.1371/journal.pone.0188117
- Mubarak, F.A. (2004). Urban growth boundary policy and residential suburbanization: Riyadh, Saudi Arabia. Habitat International, 28(4), 567–591. https://doi.org/10.1016/j.habitatint.2003.10.010
- Naranjo, G. (2009). El rol de la ciudad infiltrada en la reconfiguration de la periferia metropolitana de Santiago de Chile. Estudios Geograficos, 70(266), 205–229. https://doi.org/10.3989/estgeogr.0448
- Naranjo, G. (2017 La Expansión Urbana de Chacabuco: Hacia la Redefinición de un nuevo Territorio, 1980 - 2010 (PONTIFICIA UNIVERSIDAD CATÓLICA DE CHILE)). . http://doctoradofadeu.uc.cl/es/tesis/la-expansion-urbana-de-chacabuco-hacia-la-redefinicion-de-un-nuevo-territorio-1980-2010
- Nelson, A.C., & Moore, T. (1993). Assessing urban growth management. The case of Portland, Oregon, the USA’s largest urban growth boundary. Land Use Policy, 10(4), 293–302. https://doi.org/10.1016/0264-8377(93)90039-D
- Pagliarin, S. (2018). Linking processes and patterns: Spatial planning, governance and urban sprawl in the Barcelona and Milan metropolitan regions. Urban Studies, 55(16), 3650–3668. https://doi.org/10.1177/0042098017743668
- Paül, V., & Tonts, M. (2010). Containing urban sprawl: Trends in land use and spatial planning in the Metropolitan Region of Barcelona. Journal of Environmental Planning and Management, 48(1), 7–35. https://doi.org/10.1080/0964056042000308139
- Petermann, A. (2006 ¿Quién extendió a Santiago? Una breve historia del límite urbano, 1953-1994 Alexander Galetovic). . Santiago. Dónde Estamos y Hacia Dónde Vamos 1 1 (CENTRO DE ESTUDIOS PÚBLICOS), 207–230 https://www.cepchile.cl/cep/site/docs/20160304/20160304094228/libro_santiago_version_en_baja.pdf.
- Puertas, O.L., Brenning, A., & Meza, F.J. (2013). Balancing misclassification errors of land cover classification maps using support vector machines and Landsat imagery in the Maipo river basin (Central Chile, 1975-2010). Remote Sensing of Environment, 137 January 2013 , 112–123. https://doi.org/10.1016/j.rse.2013.06.003
- Puertas, O.L., Henríquez, C., & Meza, F.J. (2014). Assessing spatial dynamics of urban growth using an integrated land-use model. Application in Santiago metropolitan area, 2010-2045. Land Use Policy, 38 June 2013 , 415–425. https://doi.org/10.1016/j.landusepol.2013.11.024
- Rafeq, Y. (2006). Sustainable urban forms: Their typologies, models, and concepts. Journal of Planning Education and Research, 26(1), 38–52. https://doi.org/10.1177/0739456X05285119
- Robinson, L., Newell, J.P., & Marzluff, J.M. (2005). Twenty-five years of sprawl in the Seattle region: Growth management responses and implications for conservation. Landscape and Urban Planning, 71(1), 51–72. https://doi.org/10.1016/j.landurbplan.2004.02.005
- Schulz, J.J., Cayuela, L., Echeverria, C., Salas, J., & Rey Benayas, J.M. (2010). Monitoring land cover change of the dryland forest landscape of Central Chile (1975-2008). Applied Geography, 30(3), 436–447. https://doi.org/10.1016/j.apgeog.2009.12.003
- Seto, K.C., Fragkias, M., Güneralp, B., & Reilly, K. (2011). A meta-analysis of global urban land expansion. PloS One, 7(4), 1–10. https://doi.org/10.1371/Citation
- Seto, K.C., Güneralp, B., & Hutyra, L.R. (2012). Global forecasts of urban expansion to 2030 and direct impacts on biodiversity and carbon pools. Proceedings of the National Academy of Sciences of the United States of America, 109(40), 16083–16088. https://doi.org/10.1073/pnas.1211658109
- Shao, Z., Bakker, M., Spit, T., Janssen-Jansen, L., & Qun, W. (2020). Containing urban expansion in China: The case of Nanjing. Journal of Environmental Planning and Management, 63(2), 189–209. https://doi.org/10.1080/09640568.2019.1576511
- Silva, C., & Vergara-Perucich, F. (2021 Determinants of urban sprawl in Latin America: evidence from Santiago de Chile). . In SN social sciences (Vols. 1, January 2021 1–35 doi:10.1007/s43545-021-00197-4 Issue 8). . https://doi.org/10.1007/s43545-021-00197-4
- Silva, C., & Ma, J. (2021). A sustainable urban sprawl?. DisP - the Planning Review, 57(3), 50–67. https://doi.org/10.1080/02513625.2021.2026667
- Tayyebi, A., Pijanowski, B.C., & Tayyebi, A.H. (2011). An urban growth boundary model using neural networks, GIS and radial parameterization: An application to Tehran, Iran. Landscape and Urban Planning, 100(1–2), 35–44. https://doi.org/10.1016/j.landurbplan.2010.10.007
- Torrens, P.M., & Alberti, M Centre for Advanced Spatial Analysis University College London November . (2000). Measuring sprawl. , , 43. http://eprints.ucl.ac.uk/1370/
- Viana, C.M., Oliveira, S., Oliveira, S.C., & Rocha, J. (2019). Land use/land cover change detection and urban sprawl analysis Hamid Reza Pourghasemi . In Spatial modeling in GIS and R for earth and environmental sciences. Elsevier Inc 621–651 . doi:10.1016/b978-0-12-815226-3.00029-6
- Vicuña, M. (2013). El marco regulatorio en el contexto de la gestión empresarialista y la mercantilización del desarrollo urbano del Gran Santiago, Chile. Revista INVI, 28(78), 181–219. https://doi.org/10.4067/S0718-83582013000200006
- Vicuña, M. (2017). Planificación metropolitana de santiago Cambios de estilo frente a las recientes transformaciones urbanas. Iberoamericana de Urbanismo, 13 Febrero 2017 , 47–64. https://upcommons.upc.edu/bitstream/handle/2117/108616/13_03_RIURB_Vicuña.pdf?sequence=1&isAllowed=y
- Vicuña, M. (2020). Densidad y sus efectos En La Transformación Espacial De La Ciudad Contemporánea: Cinco Tipologías Para Interpretar La Densificación Residencial Intensiva En El Área Metropolitana De Santiago. Revista, 180 Junio 2019 , 45. https://doi.org/10.32995/rev180.num-45.(2020).art-659
- Wang, W., Jiao, L., Zhang, W., Jia, Q., Su, F., Xu, G., & Ma, S. (2020). Delineating urban growth boundaries under multi-objective constraints. Sustainable Cities and Society, 61 January 2020 , 102279. https://doi.org/10.1016/j.scs.2020.102279
- Weber, C., & Puissant, A. (2003). Urbanization pressure and modeling of urban growth: EXAMPLE of the Tunis metropolitan area. Remote Sensing of Environment, 86(3), 341–352. https://doi.org/10.1016/S0034-4257(03)00077-4
- Wei, Y.D., & Ewing, R. (2018). Urban expansion, sprawl, and inequality. Landscape and Urban Planning, 177(May), 259–265. https://doi.org/10.1016/j.landurbplan.2018.05.021
- Yunda, J.G., & Sletto, B. (2020). Densification, private sector-led development, and social polarization in the global south: Lessons from a century of zoning in Bogotá. Cities, 97(December 2019), 102550. https://doi.org/10.1016/j.cities.2019.102550
- Zhang, W., Wrenn, D.H., & Irwin, E.G. (2017). Spatial heterogeneity, accessibility, and zoning: An empirical investigation of leapfrog development. Journal of Economic Geography, 17(3 547–570). https://doi.org/10.1093/jeg/lbw007
- Zhao, P., Lü, B., & De Roo, G. (2010). Performance and dilemmas of urban containment strategies in the transformation context of Beijing. Journal of Environmental Planning and Management, 53(2), 143–161. https://doi.org/10.1080/09640560903529097
- Zheng, Q., Yang, X., Wang, K., Huang, L., Shahtahmassebi, A.R., Gan, M., & ValerieWeston, M. (2017). Delimiting urban growth boundary through combining land suitability evaluation and cellular automata. Sustainability (Switzerland), 9(12) 1–22. doi:10.3390/su9122213 .