ABSTRACT
Biological invasions are complex processes requiring coordinated and spatially targeted management. This study assessed spatiotemporal trajectories and determinants of Prosopis cover in Baringo County, Kenya. Land cover data for every seven years between 1988 and 2016 revealed the presence of Prosopis. We tested for trajectory clusters using spatial autocorrelation and overlaid the trajectory categories with landscape features. Generally, most plots were only temporarily managed or not managed at all, while continuous management of Prosopis occurred mainly near rivers and on plots suitable for cultivation. Parcels within 250 m from roads, which are dispersal pathways for Prosopis seeds, were rarely cleared of Prosopis. We conclude that successful management requires incentives for stakeholders’ engagement in collective management action at a landscape level. Trajectory mapping should be integrated into planning tools to foster the prioritization of timely and context-specific response mechanisms.
1. Introduction
Invasive alien species (IAS) have a complex pattern of spread in time and space (Nehrbass et al., Citation2007). Their spread extends beyond geographic and jurisdictional boundaries, thus affecting multiple actors who sometimes have conflicting values, priorities, and goals (Bagavathiannan et al., Citation2019). Thus, there is a need for well-structured, collective, and coordinated management by relevant stakeholders (Gill et al., Citation2018)). However, IAS management strategies are often guided by plot-level decisions of individual land users and these decisions are rarely aggregated into more effective and sustainable management strategies at the landscape level (Bagavathiannan et al., Citation2019).
The evergreen tree, Prosopis juliflora (Sw.) DC. (Hereafter referred to as Prosopis), is recognized as an invasive plant in almost all parts of the world’s Arid and Semi-Arid Lands (ASALs; Shackleton et al., Citation2015). Prosopis proliferates fast owing to its ability to produce numerous seeds that are viable for years (Shackleton et al., Citation2014; Shiferaw et al., Citation2004; H. G. Zimmermann, Citation1991). It can cope with extreme climatic conditions and soil types since its long roots extract groundwater during the dry season (Dzikiti et al., Citation2013).
A native to South and Central America, Prosopis was introduced to East Africa in the early 1970s to combat desertification, and as a source of fodder and fuelwood (Mwangi & Swallow, Citation2008). However, since its introduction, Prosopis has had severe negative impacts on the environment and livelihoods in East Africa (Maundu et al., Citation2009; Mbaabu et al., Citation2019; Shiferaw, Bewket et al., Citation2019). A recent study (Shiferaw, Schaffner et al., Citation2019) concluded that a single Prosopis tree consumes 7 liters of water per day translating into 3 billion cubic meters annually in the Afar Region of Ethiopia. According to Linders et al. (Citation2019), Prosopis is directly associated with losses in native species richness when its cover exceeds 40%. This is supported by Mwangi and Swallow (Citation2005) who reported that nothing grows where Prosopis is well established as it encroaches on native vegetation ().
Figure 1. A photo of dense Prosopis shrubs limiting the establishment of undergrowth (top), and native acacia trees within grasslands (bottom) in Awash, Ethiopia.
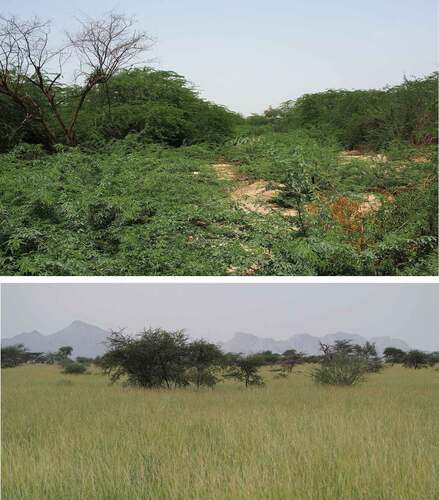
Further, the thorns of Prosopis inflict physical injury to humans, and livestock (Maundu et al., Citation2009; Mwangi & Swallow, Citation2008). Prosopis leaves are unpalatable but livestock are feeding on its sugary pods, which causes decay and loss of teeth. Animals become unable to feed and die (Mwangi & Swallow, Citation2008). Following the above-mentioned adverse impacts, the management and control of Prosopis are increasingly being prioritized in Eastern Africa. In Kenya, a National Prosopis Strategy (NPS) was formulated in 2020 to curtail its spread and reduce its densities in the invaded areas.
The process of Prosopis invasion is fast and complex, making successful management difficult particularly at advanced stages (Shiferaw, Schaffner et al., Citation2019). Furthermore, Prosopis management is expensive as it can readily coppice (Shiferaw et al., Citation2004), and requires both mechanical and chemical (herbicide) treatment for it to be sustainably managed. Since neglected plots often act as propagule sources to the managed lands, the success of invasion management at individual farms depends on management decisions taking place on neighbouring and sometimes on more distant plots (Epanchin-Niell et al., Citation2010). A well-coordinated approach that goes beyond individual farm boundaries, especially where communally shared land neighbours private plots is therefore needed (The National Invasive Species council, N, Citation2012). However, such collective actions require a common understanding of invasion dynamics to enable stakeholders to pursue a common management objective (Gill et al., Citation2018).
This paper aims to assess determinants of the distribution of Prosopis in Baringo County, Kenya, management decisions by land users, and the consequences of these for invasion dynamics. We analysed Prosopis invasion trajectories and related their spatial occurrence to relevant landscape features. Specifically, we asked 1) whether the spatiotemporal trajectories of Prosopis invasion reflect different management decisions by land users, and 2) how the distribution of landscape features such as rivers, roads, irrigation schemes, and various land cover classes are associated with Prosopis management decision. Our findings provide evidence of the significance of land users’ management decisions on spatiotemporal invasion patterns. It, therefore, informs policymakers and land managers on the need to integrate land users in designing a context-based management strategy.
2. Materials and Methods
2.1. Study Area
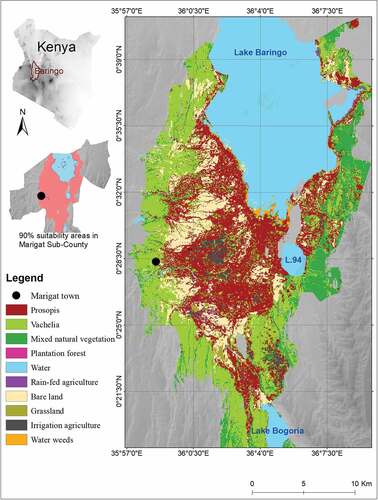
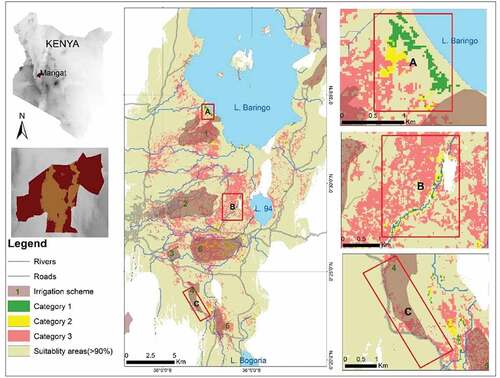
The study was conducted in Marigat Sub-County, a flat plain covering an area of roughly 170,000 hectares (ha) in the eastern lowlands of Baringo County, Kenya ().
Figure 2. Map of the land cover in the study area in 2016. Source: Adapted from (Mbaabu et al., Citation2019) and (Eckert et al., Citation2020).
Marigat Sub-County has a population of approximately 100ʹ000, 91% of whom have agropastoral livelihoods that heavily depend on land resources (KNBS, 2009) and therefore particularly affected by rangeland degradation through overgrazing and Prosopis invasion.
Before the introduction of Prosopis in 1982/83, the area was dominated by native vegetation comprising of Acacia trees (mainly Vachellia tortilis in association with Boscia spp), Balanites aegyptiaca, bushes of Salvadora persica, and grasslands (Mwangi & Swallow, Citation2008). However, the native vegetation has been displaced by Prosopis whose cover is dense where human livelihood activities are concentrated, in the lowland regions of Marigat County between Lake Baringo and Lake Bogoria (Mbaabu et al., Citation2019).
In Marigat Sub-County, we restricted our study to areas that fulfill at least 90% of the suitability criteria for Prosopis establishment and invasion (Eckert et al., Citation2020). This area covers 45,509 ha or 27% of Marigat Sub-County. Habitat suitability was assessed using an ensemble species distribution model consisting of a random forest regression and boosted regression tree models. The modelling approach was based on several datasets; global Prosopis distribution records in the native and invasive range, randomly generated pseudo-absence points, seven bioclimatic variables, two MODIS 16-day NDVI variables, slope, elevation, two surface water-related variables, and the Global Human Footprint Index (WCS & CIESIN, Citation2005). For further details see (Eckert et al., Citation2020).
The 90% suitability threshold falls within the high suitability areas (75–100%) defined by Sintayehu et al. (Citation2020). Successful clearance of Prosopis in such areas indicates an intentional effort to keep land free of Prosopis invasion ().
2.1. Input Data
The study makes use of five land cover maps covering the period from 1988 (i.e. five years after Prosopis was introduced in the area) to 2016. The maps are spaced at regular intervals of 7 years. The data is adapted from Mbaabu et al. (Citation2019), who used the Random Forest (RF) algorithm approach to perform a supervised classification of atmospherically corrected Landsat imagery with a spatial resolution of 30 m. To enhance the spectral distinction of Prosopis, which so far exclusively establishes at altitudes below 1500 m, the authors selected data for both dry and wet seasons and integrated a digital elevation model from the Shuttle Radar Topography Mission (SRTM). Primary training data were collected from the field and used to perform pixel-level cross-validation to assess the accuracy of the RF model. The accuracy of the land cover classification was 98.1% and 98.5%, respectively, while kappa coefficients were 0.93% and 0.96% (Mbaabu et al., Citation2019).
Thematic vector files for overlay analyses were derived from the World Resources Institute (WRI) and OpenStreetMap websites, and the Regional Centre for Mapping of Resources for Development. These open-source vector files include roads, water bodies, irrigation schemes, and settlements.
2.2. Analysis of Spatiotemporal Invasion Trajectories
To generate spatiotemporal trajectories of Prosopis invasion over the selected period, we reclassified each of the five land cover maps to binary maps, i.e. the presence or absence of Prosopis in each pixel. We used the ‘combine’ function in ArcMap 10.4 to assign a new pixel value for every unique combination of input pixel values from the 5 input layers. The output of this analysis was a map showing one of 32 distinct temporal trajectories of Prosopis cover for each 30 × 30 m pixel, i.e. distinct successions of Prosopis presence and absence between 1988 and 2016. For example, the sequence 0 – 0 – 0 – 1 – 1 indicates the absence of Prosopis from 1988 to 2002 and its presence in 2009 and 2016 for the concerned pixel. Out of these 32 trajectories, we were interested in three categories of trajectories that broadly reflect and therefore allow formulating conclusions on three possible types of Prosopis management practices by land users:
Systematic adoption and implementation of management practices: areas that remained free from Prosopis since they were first cleared. Trajectories within this category had a sequence of the initial presence of, followed by a continuous absence of Prosopis.
Adoption but subsequent abandonment of management practices: areas that were cleared but later re-invaded by Prosopis. This category was represented by trajectories including the initial presence of Prosopis, followed by its absence, and a subsequent re-emergence.
No attempt to adopt and implement management practices: areas where Prosopis has never been cleared since they were first invaded. The sequence of trajectories selected for this category indicated an initial absence, followed by the constant presence of Prosopis.
Out of the 32 identified trajectories, 13 of them were assigned to one of these three categories based on their relevance for invasion management decisions, and the patterns of their distribution. Invasion patterns had to meet three criteria to be included in the assessment:
Their temporal patterns had to reflect one of the three management decisions mentioned above.
Each sequence (presence or absence of Prosopis) had to be recorded for a minimum of two consecutive timeframes. This helped to eliminate classification errors, as the probability of misclassification of a particular pixel in two consecutive seven-year timeframes is small (< 1%).
We disregarded the second condition above, for trajectories that are highly clustered in precise locations, which is an indication that they might represent a particular management strategy within a definable locality.
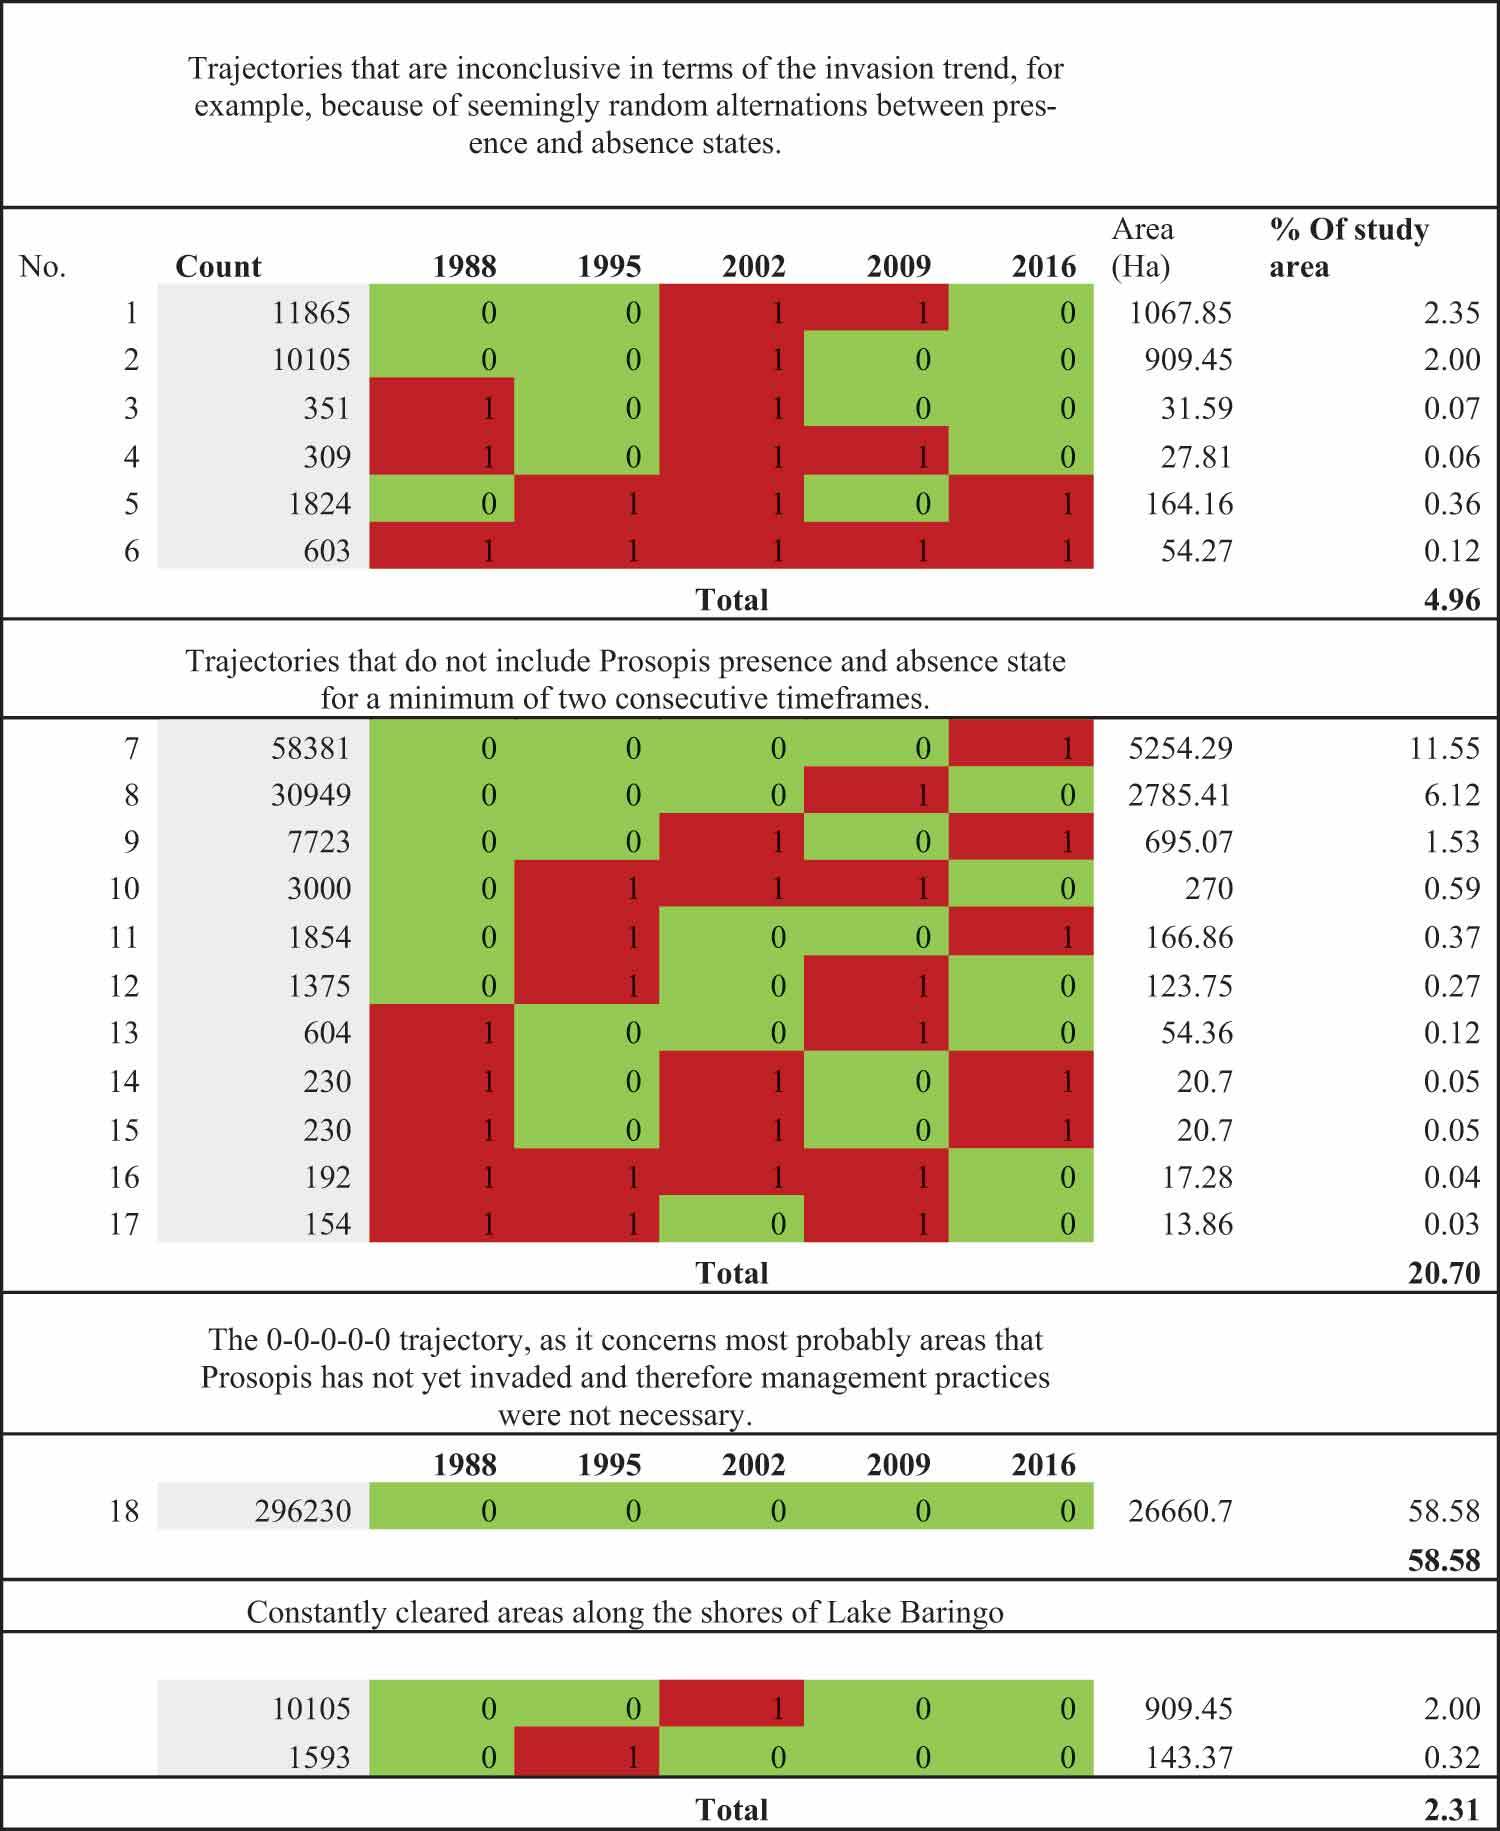
The remaining nineteen trajectories were excluded for the following reasons (see also the table in Annex 1 giving details on trajectories excluded from the analysis):
Inconclusiveness in terms of invasion trend, for example, because of seemingly random alternations between presence and absence states.
Random distribution
No inclusion of Prosopis presence and absence for a minimum of two consecutive timeframes.
The 0-0-0-0-0 trajectory, as it concerns areas where management practices were not necessary because they were not yet invaded by Prosopis.
Areas that were never re-invaded since they were first cleared along the shores of Lake Baringo, as they are due to the natural flooding of Prosopis by the rising water levels and do not represent active clearing based on land users’ decisions.
Block statistics were applied to produce more distinct polygons with minimal variation among pixels. Block statistics are neighbourhood operations to subdivide pixels into non-overlapping blocks and assign the value of the majority of pixels within that block to the central pixel.
2.3. Classification Accuracy Assessment
We calculated the accuracy of our approach by comparing the re-classified datasets with pre-classified images used as the ground-truthing data. The confusion matrix contains the conventional three types of accuracies and kappa coefficients. The kappa values evaluate the performance of classification as compared to the random assignment of values. They measure how closely the classified land cover classes are from the reference classes and have values between 0 and 1. The higher the value, the more accurate the classification, with a value of 1 indicating complete similarity between the classified and ground-truthing data. Our total classification accuracy ranged from 99 to 99.5 while the kappa coefficients were between 0.7 and 0.8 ().
Table 1. A confusion matrix describing the performance of reclassification of land cover data between 1988 to 2016.
2.4. Spatial Autocorrelation of Trajectory Categories
2.4.1. Global Moran’s Index
Moran’s index is the most common indicator of global spatial autocorrelation, which elucidates the spatial distribution of a phenomenon and whether spatial patterns are significantly aggregated (Wang et al., Citation2019). The coefficient of Moran’s index is a standardized value between −1 and +1. Positive values indicate positive spatial autocorrelation, i.e. aggregation or clustering of values for the phenomenon being investigated. Likewise, negative coefficients indicate a negative spatial autocorrelation, suggesting dispersion or spatial heterogeneity. Zero indicates a random distribution of the phenomenon. The p-values and z-score values are used to assess the significance and strength of spatial clustering, respectively (Ye et al., Citation2020). Moran’s autocorrelation index was used to analyse the spatial clustering of trajectory categories to assess whether land users’ decisions to manage or not to manage Prosopis are randomly dispersed across the landscape or not.
2.4.2. Spatial Association of Landscape Features and Trajectory Categories
The features used to evaluate factors defining the occurrence of the three trajectory categories are proximity to rivers, roads, irrigation schemes, and land cover classes. We calculated Euclidean distances for roads and rivers and clipped them with the three trajectory categories. The land cover for the five timeframes was also clipped with the trajectory categories. We calculated each trajectory coverage within and outside irrigation schemes. We then exported the data to the R software (ver. 4.1.2), where we used the ggplot2 package for plotting the data to analyse their association with each trajectory category. The land cover data was exported from ArcGIS to the open-source software Dislayr to analyse the temporal flow of land cover classes within each trajectory category.
3. Results
3.1. Categories of Spatiotemporal Invasion Trajectories and their Abundance
3.1.1. Category 1: Systematic Adoption and Implementation of Management Practices
This category includes four trajectories and covers only 110 ha or 2% of the considered area (). The first successful clearance, which constitutes 55% (61 ha) of this category, took place between 1988 and 1995. Trajectory four shows that there are only a few areas (17 ha), where long-term Prosopis cover was cleared in more recent years (between 2009 and 2016).
Table 2. Categories of spatiotemporal invasion trajectories: Zeros (0) and ones (1) represent the absence and presence of Prosopis in each census year. ‘Pixel Count’ indicates the number of 30 m x 30 m pixels in the study area falling under a certain trajectory. Hence, the most widespread trajectory (no. 11) covers an area of approximately 4,067 ha representing 8.9% of the study area. Calculations based on Mbaabu et al. (Citation2019).
3.1.2. Category 2: Adoption but Subsequent Abandonment of Management Practices
This category consists of six trajectories but only covers 4% of the assessed area. Some 82% (244 ha) of this category were first cleared between 1988 and 1995 but later re-invaded at different times (Trajectory 4,5, and 6 of ). Between 1995 and 2002 almost half (44%) of this category was cleared (5 and 9; ).
3.1.3. Category 3: No Attempt to Adopt and Implement Management Practices
This is the most widespread category in the study area. It covers 6,329 ha (14% of the study area), even though it includes only three trajectories (). Trajectory 13 shows that, although Prosopis invasion was slow between 1988 and 1995, it invaded 373 ha of land, which is more than three times the total area where land management has been continuously adopted and implemented (Category 1) for the whole period considered in this study. The rate of invasion increased more than four times in the following 7-year period (1995–2002), covering an area of 1889 ha. This value doubled in the subsequent 7-year period as illustrated by trajectory eleven which has the largest coverage (4067 ha). When comparing trajectories eleven with trajectories five and eight of category two (), it appears that a strong wave of (re-) invasion took place between 2002 and 2009. It also shows a wave of Prosopis clearing roughly between 1995 and 2009 followed by a reinvasion that is visible in trajectory eleven.
3.2. Spatial Distribution of Trajectory Categories
Moran’s I statistics (I > 0) indicates that similar trajectory categories are spatially clustered (z-score >2.58; p < 0.01)). Their spatial occurrence may therefore be attributed to other explanatory variables than chance. Hereafter, we briefly describe the spatial occurrence of trajectory categories with respect to selected landscape features.
3.2.1. Distance to the Nearest River
Generally, the occurrence of the three categories declines with increasing distance from rivers, but categories one and two are over-represented within 800 meters from the closest river, relative to category three (). However, the plots that are likely to be cleared are also prone to be re-invaded as illustrated by the high representation of category two (adoption and subsequent abandonment of management practices).
Figure 3. The relation between the occurrence of trajectory categories with proximity to rivers (left), and roads (right). Category one represents areas that have remained free of Prosopis since their initial clearance, category two represents areas that were re-invaded following their clearance, and category three represents areas that have never been cleared since their initial invasion by Prosopis.
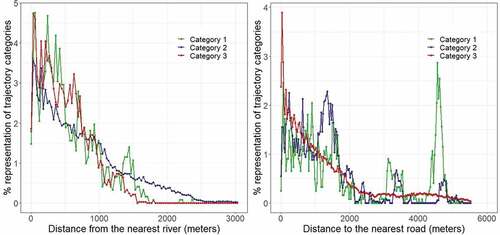
3.2.2. Distance to Roads
Trajectory category three is overrepresented within the first 250 m from roads (). Its presence steadily declines beyond that distance and levels off at around 2800 m. The distribution of categories one and two along roads is irregular. The majority of categories one and two are found within the first 1700 m from roads, but 33% of category one are located more than 3000 m away from roads. These are the areas cleared on the southwestern side of Lake Baringo for cultivation purposes ().
Figure 4. Distribution of trajectory categories in the study area (Main map in the second column), along the shorelines (A), rivers (B), and roads (C). Category one represents areas that have remained free of Prosopis since their initial clearance, category two represents areas that were re-invaded following their clearance, and category three represents areas that have never been cleared since their initial invasion by Prosopis.
3.2.3. Relation between Trajectories and land cover
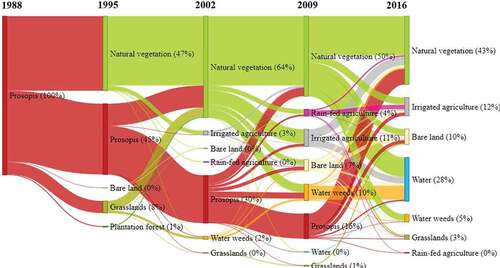
The main initial clearance of Prosopis between 1988 and 1995 gave way to natural vegetation (which was subsequently diversified into different land cover classes), some grassland, water bodies, and bare land. Unlike grasslands and plantation forests, which were mainly converted directly from Prosopis, plots under irrigated agriculture were initially gained from natural vegetation, which, in turn, replaced Prosopis cover (). Between 2002 and 2009, substantial Prosopis areas were converted to bare land and the proportion of water weeds increased five times. Likewise, close to 1% of the 2002 Prosopis cover changed to water, constituting 0.2% of the total land cover in 2009 ().
Figure 5. Temporal Changes of land cover in areas that have remained free of Prosopis since they were first cleared (category one). The values in brackets indicate a percentage of the total land cover rounded off to the nearest whole number. Thus, land cover classes representing 0% had less than 0.5% of the total land cover.
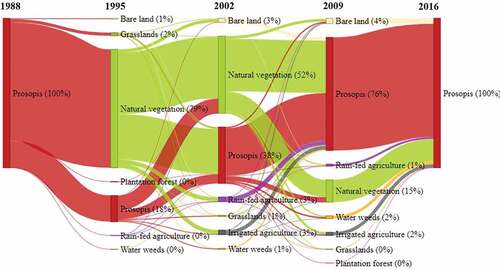
In the re-invaded areas, clearance mainly took place between 1995 and 2002, with a high re-invasion rate between 2009 and 2016 (). The high wave of re-invasion in 2009 mainly occurred on plots under rain-fed agriculture, natural vegetation, irrigated agriculture, grasslands, and water weeds.
Figure 6. Temporal changes of land cover within re-invaded areas (category two). The values in brackets indicate a percentage of the total land cover rounded off to the nearest whole number. Thus, land cover classes representing 0% had less than 0.5% of the total land cover.
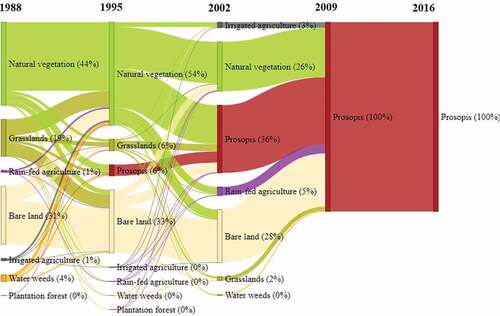
Areas that ended up being constantly invaded by Prosopis after the first invasion was initially converted between 1988 to 1995 from different land cover classes (). All other plots of this category were invaded within the subsequent 14 years, illustrating a rapid progression of Prosopis invasion. This figure shows that Prosopis invasion took place in all land cover classes except in water bodies.
Figure 7. Temporal Changes of land cover in areas where Prosopis has never been cleared since they first had been invaded (category three). The values in the bracket indicate a percentage of the total land cover rounded off to the nearest whole number. Thus, land cover classes representing 0% had less than 0.5% of the total land cover.
3.2.4. Relation between Trajectory Categories and Irrigation Schemes
Our findings show that only 15% of category one is found within irrigation schemes. The oldest irrigation scheme in the region (Perkerra; number two in Figure four) includes very few areas that were either permanently cleared or cleared and re-invaded (categories one and two), whereas these categories are more dominant in the Loboi and Eldume irrigations schemes (numbers five and six in ). Interestingly, these two irrigation schemes have rivers passing through them. Eldume, which has the highest share of categories one and two, has a network of river tributaries crisscrossing its boundaries.
40% of the areas that were cleared and reinvaded (category two) are also found in irrigation schemes ().
Figure 8. Distribution of trajectory categories with respect to irrigation schemes.
Even though just a quarter of the constantly invaded areas (category three) are found inside irrigation schemes, this category, nevertheless, occupies around one-third (31%) of the total area of these irrigation schemes.
4. Discussion
By analyzing the spatial pattern of Prosopis presence and absence for 28 years, we could identify Prosopis invasion trajectories that reflect management decisions by local land users, and which are associated with landscape features. Both continuous clearances, as well as initial clearance but subsequent abandonment of Prosopis management, were primarily found near water bodies. On most of the plots invaded by Prosopis, including communally owned land along roads, we found no evidence for the implementation of management practices.
4.1. Categories of Spatiotemporal Trajectories of Prosopis
Once established, Prosopis does not disappear on its own, and thus temporal changes in Prosopis cover can be traced to land users’ decisions to adopt or not land management practices. Therefore, invasion trajectories offer a temporal monitoring system of management decisions and actions (Liu & Cai, Citation2012). The use of reclassified land cover data did not compromise the quality of our data and also saved us from expensive duplication of data collection, processing, and classification (Hsiao & Cheng, Citation2016). However, while trajectories enabled us to detect complex non-linear changes in temporal invasion patterns (Liu & Cai, Citation2012), the analysis of 7-year-interval land cover data could have missed out on short periods of management or rapid response.
Our study revealed a small and steadily decreasing area in category one (continuous implementation of management practices), and a significant increase in category three (no attempt to adopt management practice), indicating that Prosopis management is rather the exception than the rule and that the prevailing efforts to sustainably manage the invasion are not effective (Mbaabu et al., Citation2019). The uptake of Prosopis management occurred in the early years of invasion and became less likely with time. Possibly, land users felt increasingly overwhelmed by the increasing densities and sizes of Prosopis trees (Pérez-Serrano et al., Citation2021; Shackleton et al., Citation2016).
This highlights the importance of Early Detection and Rapid Response (EDRR), owing to the lower costs and higher chances of adoption of such measures compared to tedious and costly removal efforts (Kariyawasam et al., Citation2021) at later stages of invasion. Accordingly, the mapping of invasion trajectories and the assessment of their underlying drivers should be further developed into planning tools that allow the prioritization of EDRR efforts based on the likeliness of future invasion patterns (Manzoor et al., Citation2021). Due to the complex nature of invasion dynamics that requires a collective effort and joint technological and economic investment to curtail spread (Martinez et al., Citation2020), the implementation of EDRR is recommended for large areas rather than individual farms. However, the decision to engage in EDRR and invasion management lies at the community level (Adoyo et al., Citation2022). This presents an opportunity for integrating multiple approaches in managing invasions.
We also found that initial Prosopis clearance (1988–1995) coincided with a major drought in Marigat Sub-County. Owing to the drought, land users turned to charcoal production for economic survival, relying heavily on Prosopis as raw material (Kosonei et al., Citation2017). However, to sustainably manage Prosopis, the removal of above-ground biomass must be combined with uprooting or killing of the rootstocks, because Prosopis can rapidly resprout (Dzikiti et al., Citation2013). During the same period, demand for maize seed production increased, leading to the expansion of agricultural activities and hence increased Prosopis management (Mbaabu et al., Citation2019). However, the demand for seeds declined again in 1995, which resulted in the abandonment of agricultural practices and (re-)invasion by Prosopis. This may explain the wave of invasion experienced during this period, which is reflected in the trajectories. These temporal patterns are in line with Pérez-Serrano et al. (Citation2021) who found that community members rarely invest in Prosopis management unless they anticipate deriving rapid economic benefits from their management efforts.
4.2. Association of Trajectory Categories with Spatial Features
The overlay of spatiotemporal trajectories with landscape variables enhanced the explanatory potential of our mapping. The selection of roads and rivers was informed by previous findings (Dzikiti et al., Citation2013; Eckert et al., Citation2020; Mbaabu et al., Citation2019), while the spatial relationship between invasion trajectories with irrigation schemes and land cover followed recommendations by Schirpke et al. (Citation2020), who found that the overlay of functional spatial units is fundamental in revealing a combined effect of drivers on land cover trajectories.
Based on our results, a vast majority of successful clearances (Category one) took place within 800 meters from the nearest rivers where Prosopis was often replaced by cropland (Mbaabu et al., Citation2019). Thus, land users preferentially cleared land in riverine corridors as this allowed them to cultivate crops with access to water for irrigation, a crucial advantage, especially during drought events. In other words, the availability of key resources – water in this particular case – is a major incentive for agricultural land use and, indirectly, the implementation of Prosopis management practices (Wiesmann et al., Citation2011).
Despite being a major driver of Prosopis clearance, agricultural land itself was not shielded from invasion. According to Kariyawasam et al. (Citation2021), agricultural lands are prone to invasion once the implementation of management activities is halted or weakened, making them vulnerable to re-invasion. For example, despite their economic significance to local communities, irrigation schemes had a high proportion of re-invaded areas and a low share of areas that remained free of Prosopis since their initial clearance, despite substantial differences from one irrigation scheme to another. The time of establishment and different management practices among the schemes are the most likely reasons behind these differences. On the one hand, Perkerra commenced its operations in the early 1960s (Nadeiwa & Koring, Citation2017), just before Prosopis invasion started being recognized as a problem and when community members still had little experience with invasion management. This contributed to delayed implementation or even a lack of preventive measures and the subsequent abandonment of invaded land due to the high costs associated with reclaiming invaded plots. On the other hand, Loboi and Eldume schemes (5 and 6 in ) were established later by farmers who benefited from the lessons learned in Perkerra. This is reflected in a higher occurrence of Categories one (free of Prosopis since their initial clearance) and two (cleared and reinvaded) in these two schemes ().
The lessons learned from the different spatiotemporal patterns in Perkerra, Loboi, and Eldume echo the finding of previous studies (Gill et al., Citation2018; Kariyawasam et al., Citation2021; Shackleton et al., Citation2016; The National Invasive Species council, N, Citation2012), which highlight the importance of EDRR. Indirectly, they also point to the crucial importance of effective rural advisory systems to support land users to set up a workable EDRR system, to take the right management decisions at an early stage, and adopting farming practices that maintain the productive potential of land. Indeed, a substantial share of the plots that were abandoned in irrigation schemes had lost part of their productive potential because of salinization (Mbaabu et al., Citation2019), leading to low returns on investment and thus to a lack of motivation to invest in management practices (Kropf et al., Citation2020).
The concentration of Category three near roads reflects two distinct trends: (a) roads, trails, livestock routes, and footpaths are known dispersal pathways for Prosopis (del-Val et al., Citation2015; Eckert et al., Citation2020; Sintayehu et al., Citation2020), and (b) there is limited incentives for land users to clear invasive species from roadsides, as the latter are shared resources for the management of which no one is personally held accountable. This shows that the decision to manage land against Prosopis invasion depends on land users’ expectations that their investments are likely to be compensated by benefits (Bagavathiannan et al., Citation2019; Epanchin-Niell et al., Citation2010; De Graaff et al., Citation2008).
Based on our assessment of land cover changes in different trajectory categories, we found that there are no clear transitions from one land cover to Prosopis or vice-versa. In many cases, changes between different land cover classes precede invasion with Prosopis. Thus, strategies only focusing on one type of change, e.g. only from bare land to Prosopis would miss the target.
4.3. Implications for Prosopis Management at the Landscape Scale
The findings and discussions above resonate with those of previous studies (Gill et al., Citation2018; Shackleton et al., Citation2016) which illustrated that presence of economic incentives is the key motivator for land users to continuously engage in invasion management. While this indicates that continuous clearance of Prosopis is more probable on plots where land users anticipate their management efforts to be compensated by benefits (Cowie et al., Citation2018), Kariyawasam et al. (Citation2021) report that IAS losses on agricultural lands, where direct benefits may be derived, is enormous worldwide. This indicates that successful clearance of invasive species may only be guaranteed at the landscape level since invasion occurs in large areas within short periods, hence affecting many people. This approach requires coordinated and collective management by land users at the landscape level (Bagavathiannan et al., Citation2019). To achieve this, landscape invasion patterns and the assessment of their contributing factors should be understood.
Our results suggest that spatiotemporal trajectories help understand invasion dynamics, relating such dynamics to possible drivers, and informing spatially explicit management decisions. The identified invasion dynamics show that – so far – management efforts are inadequate and confined to small areas in which land users expect to derive economic benefits such as in the form of access to agricultural land (Bagavathiannan et al., Citation2019; Gill et al., Citation2018). On the other hand, Prosopis management efforts are almost absent in areas for which no one is personally held accountable (such as communal grazing land and roadside corridors), and in areas that are perceived as being of too little value to justify investing in management practices. While such neglected plots are the ones vulnerable to invasion, they often neighbor the valuable land where land users tend to invest resources to manage. This presents a key challenge to invasion management, as neglected plots are likely to act as propagule sources to neighboring lands (Epanchin-Niell et al., Citation2010). This also justifies the need for a collective Prosopis management strategy at the landscape rather than at the individual plot level.
For communally owned land, where economic benefits are not guaranteed, invasion management may only be successful if economic incentives are made available to land users participating in this management effort. This, however, seems to be challenging for financially constrained local authorities, which partly explains the low success rates of previous local-scale invasion management strategies. With this in mind, two aspects deserve particular attention: (1) external support from either national or County authorities, or development agencies, might be unavoidable to help local authorities and communities to deal with Prosopis invasions, particularly at an advanced stage; and (2) the mapping of spatiotemporal Prosopis invasion trajectories could be further developed into a tool helping to improve the quality of decision-making of Prosopis management priorities.
Finally, past experiences have shown that management at the landscape level is only possible if land users are assured of social cooperation from community members (Kropf et al., Citation2020). While this is possible, achieving collective actions in invasion management is a social dilemma owing to existing conflicts of interest and motivation among stakeholders (Epanchin-Niell et al., Citation2010). Following the recorded success rates and benefits of biological control, previous studies (Bagavathiannan et al., Citation2019; A. Zimmermann & Maennling, Citation2007) have recommended the use of biological agents as an alternative for coordinated management of IAS at a landscape level. This is because biological control is self-sustaining and independent of stakeholder management actions (Bagavathiannan et al., Citation2019). Despite the strengths of biological control, it has only been applied in South Africa and Australia where seed-feeding insects (Algarobius spp.) and leaf-tying moths (Evippe spp.) were introduced. Despite the massive destruction of Prosopis seeds, the invasive tree continues to spread (Shackleton et al., Citation2015; Zachariades et al., Citation2011). Owing to the trade-offs associated with management interventions, an integrated strategy that combines chemical, physical, and biological approaches is therefore highly recommended (York, Citation2009) for the sustainable management of invasive species.
5. Conclusions
We conclude that trajectories of invasive species reflect spatiotemporal variations in land management actions, which can provide insight into designing policy interventions for invasion management. Since invasion management is more successful at the early stages of invasion, EDRR mechanisms should be integrated into planning tools for management strategies. Likewise, the existing stakeholder motivation has proved inadequate in sustainably managing invasion, calling for a landscape approach to managing invasions. However, management at the landscape level may not be easily attained unless land users are incentivized to engage in collective and coordinated management approaches.
Owing to the widespread nature of the invasion process, the analysis of spatial-temporal invasion trajectories may be upscaled and applied at a higher scale to inform sub-national and national management strategies. It would be useful in assessing hotspot areas where management should be prioritized and could become a useful planning tool for evaluating the spatial distribution of invasion patterns as well as assigning appropriate management interventions.
Data availability
The data that support the findings of this study are available from the corresponding author upon request.
Disclosure statement
No potential conflict of interest was reported by the author(s).
Correction Statement
This article has been republished with minor changes. These changes do not impact the academic content of the article.
Additional information
Funding
References
- Adoyo, B., Schaffner, U., Mukhovi, S., Kiteme, B., Mbaabu, P.R., Eckert, S., Choge, S., & Ehrensperger, A. (2022). Pathways towards the Sustainable Management of Woody Invasive Species: Understanding What Drives Land Users’ Decisions to Adopt and Use Land Management Practices. Land, 11(4), 4. https://doi.org/10.3390/land11040550
- Bagavathiannan, M.V., Graham, S., Ma, Z., Barney, J.N., Coutts, S.R., Caicedo, A.L., De Clerck-Floate, R., West, N.M., Blank, L., Metcalf, A.L., Lacoste, M., Moreno, C.R., Evans, J.A., Burke, I., & Beckie, H. (2019). Considering weed management as a social dilemma bridges individual and collective interests. Nature Plants, 5(4), 343–351. https://doi.org/10.1038/s41477-019-0395-y
- Cowie, A., Orrb, B.J., Sanchezc, V., Chasekd, P., Crossmane, N., Erleweinf, D., Louwagieg, G., Maron, M., Metternicht, G.I., Minelli, S., Tengberg, A.E., Walter, S., & Welton, S. (2018). Land in balance: The scientific conceptual framework for Land Degradation Neutrality. Environmental Science and Policy, 79 (January) , 25–35. https://doi.org/10.1016/j.envsci.2017.10.011.
- de Graaff, J., Amsalu, A., Bodnár, F., Kessler, A., Posthumus, H., & Tenge, A. (2008). Factors influencing adoption and continued use of long-term soil and water conservation measures in five developing countries. Applied Geography, 28(4), 271–280. https://doi.org/10.1016/j.apgeog.2008.05.001
- del-Val, E., Balvanera, P., Castellarini, F., Javier Espinosa-García, F., Murguía, M., & Pacheco, C. (2015). Identifying areas of high invasion risk: A general model and an application to Mexico. Re-Vista Mexicana de Biodiversidad, 86(1), 208–216. https://doi.org/10.7550/rmb.44743
- Dzikiti, S., Schachtschneider, K., Naiken, V., Gush, M., Moses, G., & Le Maitre, D.C. (2013). Water relations and the effects of clearing invasive Prosopis trees on groundwater in an arid environment in the Northern Cape, South Africa. Journal of Arid Environments, 90(January), 103–113. https://doi.org/10.1016/j.jaridenv.2012.10.015
- Eckert, S., Hamad, A., Kilawe, C.J., Linders, T.E.W., Ng, W.T., Mbaabu, P.R., Shiferaw, H., Witt, A., & Schaffner, U. (2020). Niche change analysis as a tool to inform management of two invasive species in Eastern Africa. Ecosphere, 11(2), 2. https://doi.org/10.1002/ecs2.2987
- Epanchin-Niell, R.S., Hufford, M.B., Asian, C.E., Sexton, J.P., Port, J.D., & Waring, T.M. (2010). Controlling invasive species in complex social landscapes. Frontiers in Ecology and the Environment, 8(4), 210–216. https://www.jstor.org/stable/20696490
- Gill, N.J., Graham, S., Cross, R., & Taylor, E.M. (2018). Weed hygiene practices in rural industries and public land management: Variable knowledge, patchy implementation, inconsistent coordination Journal of Environmental Management, 223(1), 140–149. https://doi.org/10.1016/j.jenvman.2018.06.017
- Hsiao, L.H., & Cheng, K.S. (2016). Assessing uncertainty in land cover classification accuracy by using bootstrap resampling. Remote Sensing, 8(9), 9. https://doi.org/10.3390/rs8090705
- Kariyawasam, C.S., Kumar, L., & Ratnayake, S.S. (2021). Potential risks of invasive alien plant species on agriculture under climate change scenarios in Sri Lanka. Current Research in Environmental Sustainability, 3 (February) , 100051. https://doi.org/10.1016/j.crsust.2021.100051
- Kosonei, R.C., Abuom, P.O., Bosire, E., & Huho, J.M. (2017). Vegetation Cover in Marigat Sub- Vegetation Cover in Marigat Sub-County, Baringo County Kenya. International Journal of Scientific and Research Publications, 7(5), 89–98. https://www.researchgate.net/publication/316715524
- Kropf, B., Schmid, E., Schönhart, M., & Mitter, H. (2020 Exploring Farmers’ Behavior toward Individual and Collective Measures of Western Corn Rootworm Control– ACase Study in south-east Austria. Journal of Environmental Management). Journal of Environmental Management. 264(August), 110431. https://doi.org/10.1016/j.jenvman.2020.110431
- Linders, T.E.W., Schaffner, U., Eschen, R., Abebe, A., Choge, S.K., Nigatu, L., Mbaabu, P.R., Shiferaw, H., & Allan, E. (2019). Direct and indirect effects of invasive species: Biodiversity loss is a major mechanism by which an invasive tree affects ecosystem functioning. Journal of Ecology, 107(6), 2660–2672. https://doi.org/10.1111/1365-2745.13268
- Liu, D., & Cai, S. (2012). A Spatial-Temporal Modeling Approach to Reconstructing Land-Cover Change Trajectories from Multi-temporal Satellite Imagery. Annals of the Association of American Geographers, 102(6), 1329–1347. https://doi.org/10.1080/00045608.2011.596357
- Manzoor, S.A., Griffiths, G., & Lukac, M. (2021). Land use and climate change interaction triggers contrasting trajectories of biological invasion. Ecological Indicators, 120 , 106936. https://doi.org/10.1016/j.ecolind.2020.106936
- Martinez, B., Reaser, J.K., Dehgan, A., Zamft, B., Baisch, D., McCormick, C., Giordano, A.J., Aicher, R., & Selbe, S. (2020). Technology innovation: Advancing capacities for the early detection of and rapid response to invasive species. Biological Invasions, 22(1), 75–100. https://doi.org/10.1007/s10530-019-02146-y
- Maundu, P., Kibet, S., Morimoto, Y., Imbumi, M., & Adeka, R. (2009). Impact of Prosopis juliflora on Kenya’s semi-arid and arid ecosystems and local livelihoods. Biodiversity, 10(2–3), 33–50. http://dx.doi.org/10.1080/14888386.2009.9712842
- Mbaabu, P.R., Ng, W.T., Schaffner, U., Gichaba, M., Olago, D., Choge, S., Oriaso, S., & Eckert, S. (2019). Spatial evolution of Prosopis invasion and its effects on LULC and livelihoods in Baringo, Kenya. Remote Sensing, 11(10), 10. https://doi.org/10.3390/rs11101217
- Mwangi, E., & Swallow, B. (2005). Invasion of Prosopis Juliflora and Local Livelihoods: Case Study from the Lake Baringo Area of Kenya. ICRAF Working Paper - no. 3. World Agroforestry Center. http://dx.doi.org/10.5716/WP13657.PDF
- Mwangi, E., & Swallow, B. (2008). Prosopis juliflora invasion and rural livelihoods in the Lake Baringo Area of Kenya. Conservation and Society, 6(2), 130–140. https://doi.org/10.4103/0972-4923.49207
- Nadeiwa, K., & Koring, J. (2017). Influence of Small-scale Irrigation Schemes on Improving Livelihood of Rural Farm Households ; A Case of Perkerra Irrigation Scheme, Baringo County. American Scientific Journal for Engineering, Technology and Sciences, 38(2), 200–213. https://www.researchgate.net/publication/331048358
- Nehrbass, N., Winkler, E., Müllerová, J., Pergl, J., Pyšek, P., & Perglová, I. (2007). A simulation model of plant invasion: Long-distance dispersal determines the pattern of spread. Biological Invasions, 9(4), 383–395. https://doi.org/10.1007/s10530-006-9040-6
- Pérez-Serrano, D., Cabirol, N., Martínez-Cervantes, C., & Rojas-Oropeza, M. (2021). Mesquite management in the Mezquital Valley: A sustainability assessment based on the view point of the Hñähñú indigenous community. Environmental and Sustainability Indicators, 10(March), 100113. https://doi.org/10.1016/j.indic.2021.100113
- Schirpke, U., Leitinger, G., Tasser, E., Rüdisser, J., Fontana, V., & Tappeiner, U. (2020). Functional spatial units are fundamental for modelling ecosystem services in mountain regions. Applied Geography, 118(May), 102200. https://doi.org/10.1016/j.apgeog.2020.102200
- Shackleton, R.T., Le Maitre, D.C., Pasiecznik, N.M., & Richardson, D.M. (2014). Prosopis: A global assessment of the biogeography, benefits, impacts and management of one of the world’s worst woody invasive plant taxa. AoB PLANTS, 6(July), 1–18. https://doi.org/10.1093/aobpla/plu027
- Shackleton, R.T., Le Maitre, D.C., & Richardson, D.M. (2015). Prosopis invasions in South Africa: Population structures and impacts on native tree population stability. Journal of Arid Environments, 114(March), 70–78. https://doi.org/10.1016/j.jaridenv.2014.11.006
- Shackleton, R.T., Le Maitre, D.C., van Wilgen, B.W., & Richardson, D.M. (2016). Identifying barriers to effective management of widespread invasive alien trees: Prosopis species (Mesquite) in South Africa as a case study. Global Environmental Change, 38(April), 183–194. https://doi.org/10.1016/j.gloenvcha.2016.03.012
- Shiferaw, H., Bewket, W., Alamirew, T., Zeleke, G., Teketay, D., Bekele, K., Schaffner, U., & Eckert, S. (2019). Implications of land use/land cover dynamics and Prosopis invasion on ecosystem service values in Afar Region, Ethiopia. Science of the Total Environment, 675(July), 354–366. https://doi.org/10.1016/j.scitotenv.2019.04.220
- Shiferaw, H., Schaffner, U., Bewket, W., Alamirew, T., Zeleke, G., Teketay, D., & Eckert, S. (2019). Modelling the current fractional cover of an invasive alien plant and drivers of its invasion in a dryland ecosystem. Scientific Reports, 9(1), 1–12. https://doi.org/10.1038/s41598-018-36587-7
- Shiferaw, H., Teketay, D., Nemomissa, S., & Assefa, F. (2004). Biological characteristics that foster the invasion of Prosopis juliflora (Sw.) DC. at Middle Awash Rift Valley Area, northeastern Ethiopia. Arid Environments, 58(2), 135–154. https://dx.doi.org/10.1016/j.jaridenv.2003.08.011
- Sintayehu, D.W., Egeru, A., Ng, W.‐.T., & Cherenet, E. (2020). Regional dynamics in distribution of Prosopis juliflora under predicted climate change in Africa. Tropical Ecology, 61(4), 437–445. https://doi.org/10.1007/s42965-020-00101-w
- The National Invasive Species council, N. (2012). National Invasive Species Management Plan 2008–2012. 35. https://www.doi.gov/sites/doi.gov/files/migrated/invasivespecies/upload/2008-2012-National-Invasive-Species-Management-Plan.pdf
- Wang, W.C., Chang, Y.J., & Wang, H.C. (2019). An application of the spatial autocorrelation method on the change of real estate prices in Taitung city. ISPRS International Journal of Geo-Information, 8(6), 6. https://doi.org/10.3390/ijgi8060249
- WCS, & CIESIN. (2005). Last of the Wild Data Version 2, 2005 (LWP-2): Global Human Footprint Dataset (Geographic). Wildlife Conservation (WCS) and Center for International Earth Science Information Network (CIESIN). NASA Socio economic Data and Applica-tions Center (SEDAC).
- Wiesmann, U., Ott, C., Ifejika Speranza, C., Kiteme, B.P., Müller-Böker, U., Messerli, P., & Zinsstag, J. (2011). A Human Actor Model in Interdisciplinary Research for Sustainable Development. Research for Sustainable Development, (1), 231–256. https://doi.org/10.5167/uzh-61718
- Ye, P., Zhang, G., & Wu, J. (2020). Hotspots and conservation gaps: A case study of key higher plant species from Northwest Yunnan, China. Global Ecology and Conservation, 23(September), e01005. https://doi.org/10.1016/j.gecco.2020.e01005
- York, N. (2009 Integrated pest and invasive species managementlan for the Abany Rapp road landfill ecosystem mitigation , restoration & enhancement project (New York: Clough Harbour & Associates, LLP). https://docslib.org/doc/12364202/integrated-pest-and-invasive-species-management-plan
- Zachariades, C., Hoffmann, J.H., & Roberts, A.P. (2011). Biological control of Mesquite (Prosopis Species) (Fabaceae) in South Africa. African Entomology, 19(2), 402–415. http://dx.doi.org/10.4001/003.019.0230
- Zimmermann, H.G. (1991). Biological control of Mesquite, Prosopis spp.(Fabaceae), in South Africa. Agriculture, Ecosystems & Environment, 37(1–3), 175–186. https://doi.org/10.1016/0167-8809(91)90145-N
- Zimmermann, A., & Maennling, C. (2007). . Promoting Participatory Development in German Development Coperation (Germany: Imprint Published by Deutsche Gesellschaft für Technische). http://www.fsnnetwork.org/sites/default/files/en-svmp-instrumente-akteuersanalyse.pdf
Annex 1.
List of trajectories that were excluded from the analysis