
ABSTRACT
Despite the many examples where simulation has successfully demonstrated its capability in modelling patient flow, there is little evidence of enduring widespread use. Bespoke academic projects provide little scope for repeatable practical application and efforts to develop generic reusable solutions have neither clearly identified the end users nor fully appreciated their multifaceted requirements. Influenced by a review of existing findings and recommendations in addition to a customised survey of prospective end users, a set of practical design principles were elicited in guiding development of a new open-source and versatile tool. Capturing variability in arrivals and length of stay as well as the stochastic nature of dynamic delays in patient discharge and transfer, the PathSimR tool can be used to model various user-defined configurations of outpatient and inpatient pathways. In addition to reporting on early use and engagement initiatives to promote the tool, this study also offers a blueprint for how simulation models can be developed and deployed within the healthcare setting.
1. Introduction
There is evidence to suggest that simulation modelling has successfully demonstrated its capability in the healthcare sector. When it comes to decisions concerning the flow of patients through a care system or process, the ability to diagnose performance issues and examine hypothetical scenarios not possible to assess in real life has promoted it as a valuable approach in strategic and operational decision-making (Bardsley et al., Citation2019). The variety of projects undertaken have showcased a versatility of approaches with regard to the broad range of important questions and problems faced by those tasked with planning, managing, and delivering healthcare services (Salleh et al., Citation2017). These range from identifying bottlenecks in patient flow (Babashov et al., Citation2017) to estimating capacity requirements such as the optimal number of beds (Griffiths et al., Citation2013) or outpatient slots required to meet performance targets (Cayirli & Veral, Citation2003).
Despite these benefits, however, there is limited evidence to suggest that these projects have created an enduring legacy or culture of widespread, routine use (Brailsford et al., Citation2009; Fone et al., Citation2003; Mohiuddin et al., Citation2017; Pitt et al., Citation2016; Tako & Robinson, Citation2015). So why have analysts working as part of healthcare organisations locally, regionally or nationally – many of whom have long been familiar with the concept of demand and capacity modelling (Harper & Shahani, Citation2002) – not embraced simulation as a weapon in their armoury? One may presume that the freedoms and inherent depth of understanding of such self-sufficiency would be desirable, if not preferable to reliance on externally led undertakings (Bardsley et al., Citation2019). Some reports suggest analytical capability is to blame (Bardsley et al., Citation2019; Pitt et al., Citation2016), with analysts lacking experience in computer coding and quantitative techniques. This – alongside tight turnaround timescales (Brailsford et al., Citation2013, Citation2009) – would explain why bespoke models are not being developed on the ground, but it does not explain the poor take-up in “off-the-shelf” solutions. Other studies refer to cost and poor user experience as barriers to such tools (Jahangirian et al., Citation2015; Vasilakis et al., Citation2013), but Scenario Generator, launched in 2009 to many UK National Health Service (NHS) organisations, was cost-free with an established graphical user interface (GUI) and still did not enjoy the widespread use envisaged. Instead, respondents to a follow-up survey cited barriers relating to ease of use, versatility, and concerns around how effective the tool would be in meeting their needs (Brailsford et al., Citation2013).
It would therefore appear that there is a mismatch between the needs and skills of analysts on the ground and the current offering of “go to” modelling tools. Ultimately, analysts find themselves between the barriers to flexible yet costly proprietary software, potentially unfamiliar healthcare-unspecific open-source solutions, and otherwise out of reach bespoke pieces of academic work. It is posited that analysts do not make routine use of computer simulation because, to date, such tools have not, from the outset, been effectively shaped around their needs (note a lack of evidence for any prospective surveying of analysts having taken place in previous efforts, e.g., Brailsford et al., Citation2013; Palmer et al., Citation2019; Vasilakis et al., Citation2013). While identification of this disparity is not new (Eldabi, Citation2009), it would appear to have remained unresolved through the second decade of this century. This disparity certainly represents the views of the authors, based on experience working across a large and diverse Business Intelligence department within the UK NHS.
The purpose of our study was twofold. Firstly, we sought to understand the requirements of end-users with regard to simulation software, as well as the current demands, competencies, and available resources of frontline healthcare analysts on the ground. Secondly, we sought to address the identified gap by creating an open-source simulation tool informed by design principles focussed on meeting the needs of the analysts. By combining these two aspects together, our aim is to better illuminate the underlying problems and solutions to simulation uptake within the healthcare analyst community.
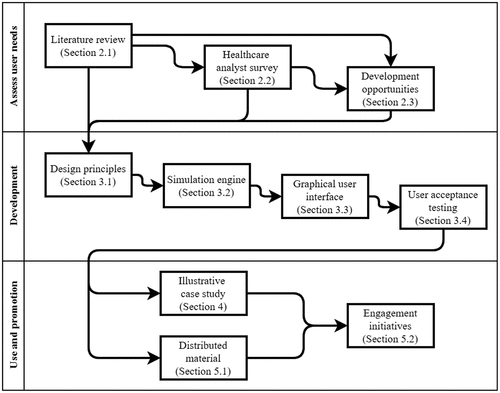
The paper is organised in a manner to reflect, to some extent, the lifecycle of our study and tool development (). First, we report on a thorough review and survey of prospective user requirements to understand the current state-of-play within the industry (Section 2). Based on the reviews, several key design principles are distilled and used in the construction of the model and accompanying GUI (Section 3). An illustrative case study is then included to showcase a direct application of the tool in an active healthcare setting and problem (Section 4). In Section 5, we give a brief account of our activities to promote the tool and facilitate end-user engagement before concluding with a summary of our findings, limitations, and further work (Section 6).
Figure 1. Lifecycle of tool development, illustrating the precedence of work packages.
2. End user requirements
We reviewed the relevant literature with the aim of assessing the needs of the prospective end user (Section 2.1). We augmented the findings of the review by conducting a survey of analysts from within the authors’ healthcare system (Section 2.2). Finally, some consideration is given to opportunities for the technical development of analysts (Section 2.3).
2.1. Literature review
Little evidence could be found within the literature of generic healthcare simulation efforts in which the needs of the user were thoroughly assessed prior to any model development. Yet for a tool to be effective, it must meet the needs of its target end user, in this case, the frontline healthcare analyst. The literature assessing impediments to simulation take-up is mostly developed from an academic perspective concerning the extent to which results or learnings from bespoke academic modelling efforts have been implemented (Brailsford et al., Citation2009; Jahangirian et al., Citation2015). From such studies, it is, however, possible to glean some inferences as to what a frontline analyst would require from a given tool should they be acting as modeller.
First and foremost, the tool should empower the user in addressing a concern frequently raised as a barrier to effective implementation: a lack of engagement with the problem owner (Kotiadis et al., Citation2014). This is typically a healthcare manager or lead clinician who is responsible for the overall programme of work and who commissions the modelling from the analyst. In one study, the key driver is found to be communication between the simulation and stakeholder groups, specifically due to a technical language barrier, irregular contact, and poor awareness of the other group’s roles (Jahangirian et al., Citation2015). Yet with careful thought and design, an appropriately developed tool operated directly by the analyst should inherently reduce these boundaries and improve coordination.
Working backwards, another need of the end user is to ensure simulation outputs are fully appreciated by the problem owner. This is where academic-driven initiatives have run into difficulty, with many studies reporting on “the potential practical applicability of the model, even though the model had never actually been implemented” (Brailsford et al., Citation2009). This is attributed to a mismatch in objectives, where academics need to demonstrate “theoretical or methodological advances”, whereas the problem owner wants simplicity, ease of use, and accessible model outputs (Brailsford et al., Citation2009; Jahangirian et al., Citation2015). Indeed, a systematic review of surgical care patient flow simulation studies found that “only half of the publications reported that models were constructed to address the needs of policy-makers, and only 26% reported some involvement of health system managers and policy-makers in the simulation study” (Sobolev et al., Citation2011). Furthermore, users need flexibility in the variety and granularity of output metrics, in order to ensure those sought by the problem owner can be provided (Wood & Murch, Citation2019). Timeliness is also an issue, both in terms of project timescales (Eldabi, Citation2009; Jahangirian et al., Citation2015) and availability of analysts (Brailsford et al., Citation2013, Citation2009; Vasilakis et al., Citation2013). Thus, users need an agile and responsive tool that can be readily learned, deployed, customised, and used as and when required.
Moving on to the tool itself, many studies in the literature have highlighted the importance of the trade-off between ease of use and sophistication. Overly simplistic approaches based on averages are widely known to perform poorly (Harper & Shahani, Citation2002; Wood & Murch, Citation2019), and so the tool has to be based on an underlying methodology that captures variability in its parameters and modelled processes (Bardsley et al., Citation2019). The downside of introducing concepts such as stochastic modelling, warm-up periods, and distribution fitting is that the tool could become more difficult to understand for a number of users and therefore impact ease of use (Bardsley et al., Citation2019; Fillingham et al., Citation2016; Pitt et al., Citation2016).
In a similar vein, proficiency in the kind of programming and statistical expertise associated with computer simulation cannot be assumed, with analysts typically using spreadsheet-based solutions and database management systems (Bardsley, Citation2016). Thus, there may be a barrier associated with command-line offerings such as the R-based simmer and Python-based SimPy and ciw tools (Palmer et al., Citation2019; Ucar et al., Citation2019). Furthermore, some of these tools – and more interactive alternatives such as the Java-based JaamSim – are not health specific, and this is thought to dissuade take-up in the health service. Indeed, active users of such tools have cited “fit with intended task and goals” and “compatibility with current work practices” as key to retention, with users who stopped using the tools citing “perceived usefulness” as a contributory factor (Brailsford et al., Citation2013; Eldabi, Citation2009). This issue extends to more established specialised simulation software packages such as Simul8 – although an additional barrier here is the cost, which is also known to affect use (Jahangirian et al., Citation2015; Tako & Robinson, Citation2015). In further promoting accessibility, installation of the tool should be possible with minimal impediments, given evidence that difficulties here can affect take-up (Brailsford et al., Citation2013). What appears to be required by the user is therefore a cost-free tool, which has a sound mathematical and statistical underpinning, and yet is easy to instal and navigate through a health-tailored user interface.
Another requirement is versatility. Considering the types of question and decision support that could be asked of such a simulation tool, it is clear that there is a broad range of patient pathways the user could need to evaluate. Across the world, healthcare systems are adapting to new pressures such as rapidly increasing populations or growing numbers of older people with multiple conditions. With medicinal and technological advances, this means reconfiguration of existing pathways (National Health Service England, Citation2019). To support this, analysts need a tool that is sufficiently flexible, and able to model various combinations of healthcare points of delivery. Without this versatility, the literature suggests that analysts will struggle to find the tool useful (Brailsford et al., Citation2013; Jahangirian et al., Citation2015), and “perceived usefulness” is cited as a key factor in whether analysts persevere with a modelling tool (Brailsford et al., Citation2013; Vasilakis et al., Citation2013). A key concern with “off-the-shelf” tools or packages must extend to whether sufficient versatility is offered (given that making modifications may be difficult or impossible).
Finally, the user needs a tool that is properly hosted and well supported. No matter the ultimate quality of the tool, it would be optimistic to think that analysts with limited experience in modelling could make the most of a tool without some form of support. Indeed, studies concerning patient flow and simulation have highlighted the importance of training and support (Brailsford et al., Citation2013; Fillingham et al., Citation2016; Pitt et al., Citation2016; Vasilakis et al., Citation2013). Given also the relatively low awareness of simulation (Jahangirian et al., Citation2015; Tako & Robinson, Citation2015) and that analysts can become “isolated” in fragmented healthcare systems (Bardsley et al., Citation2019), it would also be optimistic to think that they would encounter such a tool without special efforts made in its promotion. As has been recognised (Tako & Kotiadis, Citation2015), the academic publication route is unlikely to be effective, due to lack of library access, familiarity with writing style, and the bias towards novel vs practically valuable results. Instead, the physical and virtual networks increasingly used by analysts should be leveraged (Bardsley et al., Citation2019).
2.2. Healthcare analyst survey
While the literature covers many aspects of prospective user needs, it may overlook a number of other factors important to tailoring the development of the tool. To address this gap, a survey of analysts working within the healthcare service was conducted. The survey involved 32 volunteer respondents working in the UK NHS, predominantly within the authors’ healthcare system in South West England with a catchment area of around one million residents.
The results from the survey corroborate previous thinking that capacity for advanced patient flow modelling is currently limited in the healthcare service (Section 2.1), with just over one in five respondents (22%) reporting to have used a non-Excel-based tool for such purpose. At the same time, 25 and 27 (78% and 84% respectively) respondents reported having little or no experience with respect to stochastic modelling and discrete event simulation, respectively. Interestingly, however, there appears to be broad baseline knowledge with 23 respondents out of 32 (72%) possessing an undergraduate degree in a numerate discipline, and one in three (34%) having a postgraduate degree. This has not always been fully appreciated (Bardsley et al., Citation2019; Pitt et al., Citation2016) and is a useful guide to help decide on the knowledge level to pitch the tool (i.e., the aforementioned balance between ease of use and sophistication). It is also helpful to know that all analysts are keen to develop their analytical skills (with 100% agreeing or strongly agreeing) but cite a lack of time and resources (59%) and access to tools as barriers (63%). Overall, almost all respondents (31/32, 97%) agreed or strongly agreed that they would use such a capacity planning tool if it increased productivity. This finding, albeit limited given the relatively small sample size, seems to support the need for such a tool, but with a caveat in relation to ease of learning and use.
These insights are helpful in contextualising the main aim of the survey, which, in addressing the aforementioned gaps in the literature, is to understand the user needs with respect to tool features and support options. Respondents were asked to rank the areas of importance, feature preferences, and the type of support they would prefer should such a tool be made available to them ().
Table 1. Summarised results from healthcare analyst survey (N = 32).
There was a strong preference for quality output generated by such a tool such as plots displaying key metrics and automated reports (81% of respondents ranked this option as first or second most important). There was also a preference expressed on the ease of use (56%) and “precision” (50%) of the tool. No difference was observed in these preferences between the different respondent groups. In terms of the kind of features users would like to have available in such a tool, variable arrival rates (79%), time-based capacity changes (54%), and definable queue capacities (54%) were preferred. Some significant differences were also observed across some of the respondent groups for the other features. Finally, in terms of preferred support and out of the four options given to the users, the regional roadshow seems to be the least favourite option, with the other options attracting similar levels of acceptance (i.e., local workshop, virtual workshop, documentation, and guides).
2.3. Development opportunities
While the overriding aim is to create a tool that meets the needs of the envisaged end user, there is also an opportunity to simultaneously address personal development in improving analytical skills and appropriate software use. While professional analysts may not always recognise they need such development, healthcare has historically lagged behind other sectors in reaping the benefits of analytics and other industrial processes (Young et al., Citation2004), particularly with respect to simulation (Fone et al., Citation2003, Jahangirian et al., Citation2010). In leveraging what would appear to be some signs of enthusiasm to upskill (Section 2.2), practical application and interrogation through the tool should therefore help go some way in promoting a greater depth of insight and thus addressing national audit findings such as “some analysts fail to apply reasoning skills – too much handle turning and low level data manipulation tasks” (Bardsley, Citation2016).
With respect to the choice of software used for implementing the tool, this should be guided on the basis of affordability, user base, and recognition, as well as providing capacity to develop appropriate technical solutions that go beyond such historical and technically inadequate staples as Excel and SQL. Coalescing around a common program would represent a reasonable requirement from the user’s perspective, in advancing analytical capabilities while reducing the risk of being overwhelmed given the identified lack of time and previous exposure to programming languages (Sections 2.1 and 2.2). In the UK, there is a nationally organised movement towards using R as the preferred platform to develop and deploy advanced analytics (Bardsley et al., Citation2019). This has seen the setting up of an NHS-R community, including an annual national conference and various online forums where code can be shared. As well as offering increased versatility (Section 2.2), any purpose-built tool in R would provide development opportunities and a support network were adaptations required to the code.
3. Tool development
With the needs of the analyst end user assessed (Section 2), this section outlines a number of resulting design principles that were used to guide the development of the tool (Section 3.1). A specification of the tool is then described, including the simulation engine (Section 3.2) and the graphical user interface (Section 3.3). Following this, verification and testing of the tool is covered (Sections 3.4 and 3.5).
3.1. Design principles
The literature review and survey of the prospective end user (Section 2) were used to determine the following set of design principles through which the tool was developed:
Cost-free and open source
Coded in R and reusable
Simple and interactive graphical user interface (GUI)
Time-variable arrivals and capacity
Insightful output metrics for the problem owner
Stochastic and conceptually/statistically sound
Versatile to current and future envisaged pathways
Educative on patient flow dynamics
Publishable via analyst networks
Integrated instructional help, support, and training
These design principles share some commonality with those previously published. For instance, the three principles defined by Pritsker and Alan (Citation1998) relating to simulation modelling: “conceptualising a model requires system knowledge, engineering judgment, and model-building tools” (i.e., our principles 2, 4–6), “the secret to being a good modeller is the ability to remodel” (our 2), and “the modelling process is evolutionary because the act of modelling reveals important information piecemeal” (our 7). There is also agreement with the principles outlined in Lethbridge (Citation2014) concerning the development of a user modelling tool, such as “focus on usability” (principles 3, 9, 10 on the list above), “the tool gives maximum opportunities for learning” (principle 8), and “the tool is inexpensive” (principle 1). More specifically in the healthcare context, the requirements outlined in Vasilakis et al. (Citation2013), such as “the tool should be available to use at no direct cost” (principle 1) and “it should permit users to construct and evaluate hypothetical services with a wide variety of structures and permissible patient flows” (principle 7).
Our review of the literature on patient flow simulation models found no approach to-date that satisfies the stated design principles (). The candidate review list was adapted from Wood and Murch (Citation2019), which identified published stochastic models for patient flow around a network of service points. Being cost-free, open source, coded in R, and reusable were among the design principles most underserved by models in the current literature (it should be noted, however, that not all of the models surveyed were intended to be reusable tools). Given the identified gaps, we set out to develop a new tool to address these, and improve model selection available to the end user.
Table 2. Review of existing tools and models against established design principles (Section 3.1). Columns (1) Cost-free and open source, (2) Coded in R and reusable, (3) Simple and interactive graphical user interface (GUI), (4) Time-variable arrivals and capacity, (5) Insightful output metrics for the problem owner, (6) Stochastic and conceptually/statistically sound, (7) Versatile to current and future envisaged pathways, (8) Educative on patient flow dynamics, (9) Publishable via analyst networks, and (10) Integrated instructional help, support, and training.
3.2. Simulation engine
The patient flow model was developed on the basis of the iterative three-phase method of discrete event simulation (Pidd, Citation1998), given the capability of this approach to satisfy many of the outlined design principles (evidenced later, in ). Discrete event simulation is a common approach to modelling demand and capacity which is used across various industries. The three-phase method works by executing events from a time-based calendar to approximate changes in the state of the modelled system. With respect to patient pathways, the main types of event are:
Arrival of patient or patient referral (unconditional event)
Patient enters some form of service (conditional event)
Patient is ready for discharge or transfer (unconditional event)
Patient is discharged or transferred (conditional event)
Table 3. Key features of the simulation engine (noting references to Section 3.1 for Rationale and Appendix A for Inputs).
The basis of the three-phased approach is in maintaining a calendar of unconditional events. The first phase is to step to the next chronological event in the calendar. In our case, this could be arrival or readiness for discharge or transfer (i.e., event type a or c as above). In the second phase, this event is executed. The third phase sees any associated conditional event also executed. So, for example, if a patient arrives (event type a) and there is an available service channel in the service node (e.g., a spare bed in a hospital unit), then the conditional event is that the arriving patient is admitted (event type b). If, instead, the unconditional event is that a patient is ready for discharge (event type c) and that this is possible, then the conditional event is that they are discharged (event type d) and, if there is a waiting patient, they are admitted in their stead (event type b). Of course, there need not be any conditional event, e.g., if a patient arrives (event type a) and there is no available capacity. See Supplementary Material A for a more detailed description of the events under consideration during each iteration.
As the simulated events progress with each iteration, it is necessary to capture the state of the system over time. This keeps the event calendar up-to-date – for instance, if one of the events within an iteration involves a patient entering service (event type b), then the time at which they are to be ready for discharge or transfer (sampled from a probability distribution for length of service at that service node) is recorded in the calendar, as a future unconditional event (of type c). Capturing the behaviour of the system is also necessary in the generation of performance measures of interest, such as those relating to waiting times, occupancy, and – crucial to the understanding of pathway efficiency – the level of blocking. These are described further in Section 3.3.
During the simulation, events are iterated in line with the three-phased method until some terminating criterion is met. In our case, this is given by the simulated calendar time having reached some prescribed value (e.g., one year). As is typical in discrete event simulation (Law & Kelton, Citation2000), it is important to account for a warm-up period before this point in time, i.e., preceding the period for which performance results are harvested. This is necessary in order to establish a steady-state period of the simulation such that any transient behaviour associated with the bedding-in from the initial conditions can be appropriately discarded.
Running the simulation a single time offers just one possible explanation of how the pathway dynamics can play out and so, in order to capture the inherent stochasticity, it is necessary to perform a number of replications (Law & Kelton, Citation2000). Each of these repeats the simulation but augments the random numbers from which the simulated arrivals, lengths of service, and transitions are generated. Outputs can thereafter be aggregated across these replications, with central estimates and confidence intervals calculated for the performance measures considered.
The key features of the simulation engine are described in (with full technical detail contained in Supplementary Material B). This is supported by a specification of the required model inputs as outlined in Appendix A for an example patient pathway considered later (Section 4). The next sub-section describes how these can be input into the tool via the purpose-built GUI.
3.3. Graphical user interface
In adhering to design principles 1, 2 and 9, the model was coded in open-source R with the user interface written in the R Shiny package. This provides the user with dedicated functionality for defining the patient pathway to be modelled, configuring global options for the simulation, and inspecting and outputting results of interest (). Both the simulation engine and GUI were written using healthcare-specific terminology throughout to maximise engagement and familiarity with healthcare analysts and overcome the psychological barrier created by many DES tools which typically present a generic framework. Full documentation pertaining to the user interface is contained in Supplementary Material B. A fully illustrated walkthrough of the tool for the example pathway considered in Section 4 (and Appendix A) is provided in Supplementary Material C (noting alignment of the various stages to those of ).
Figure 2. Flow-chart illustrating critical path of user interaction with the tool. The horizontal rows represent the substantive tabs on the program’s navigation bar. An illustrated walkthrough corresponding to these steps is contained in Supplementary Material C for the case study contained in Section 4.
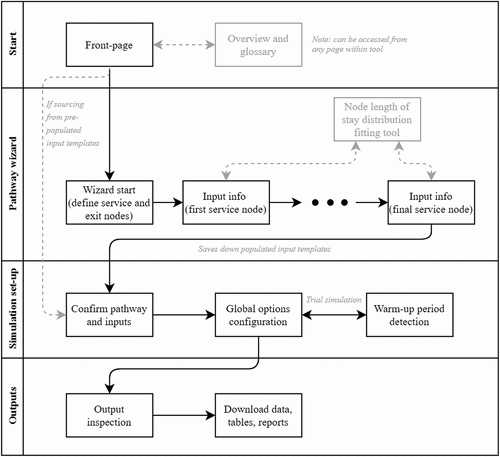
Upon opening the program, the user is presented with a front-page containing an overview of the tool. New users can navigate to a more detailed summary accompanied by a glossary of the terms used. To support the user throughout the program, pop-up information boxes are provided for various key terms and components (design principle 10). This ensures users can readily access any supporting detail they require, without overloading pages with potentially non-essential information, which would compromise perceived simplicity (design principle 3). The information boxes also provide an opportunity to expand on some of the technical terms, in educating the user on key concepts relating to queuing theory and simulation (design principle 8).
In order to define the patient pathway to be modelled, users can enter the pathway wizard, occupying the first substantive tab on the navigation bar. Here, the user is interactively guided (design principle 3) through a number of stages in submitting the required parameters (i.e., those contained in Appendix A). On the first page, the user is required to enter the names of service and exit nodes for the pathway considered. They are then directed in turn to a number of automatically created pages, one for each of the service nodes. These elicit from the user the associated parameters, such as external arrival rates, prescribed discharge delays, and transition probabilities to onward service and exit nodes. For length of service, the user is required to select the distribution type (from a list including the uniform, exponential, log-normal, gamma, and Weibull distributions) alongside the accompanying parameters. To this end, the user is supported through an inbuilt application that can be temporarily accessed through the program. If the user has data for historical lengths of stay at the service node in question, then this can be uploaded with the afore-mentioned distributions automatically fitted (by maximum likelihood estimation). The user is thereafter presented with the ranking of these according to a goodness-of-fit test (by Akaike Information Criterion) alongside the corresponding parameters. Alternatively, if no such data is available, then the user may supply a mean service time and select the clinical speciality of the service node from a pre-populated list, from which they will be supplied with the best-fitting distribution type and corresponding parameters (based on having fitted to England-wide Hospital Episode Statistics data through MLE – note that no other tool is able to provide such functionality). While making this necessary step easier for users (design principle 3), it also helps convey the importance of variability (design principle 8).
Thereafter, on unlocking the second substantive tab on the navigation bar, the inputted information is summarised and relayed to the user with any issues flagged for attention and rectification (e.g., missing values and outward transition probabilities not summing to one). When the consistency checks are satisfied, the user may proceed to configuring the global options. Alongside setting the length of the simulation period and the number of replications, the user is also required to set the warm-up period (Section 3.2). This is addressed through a simple graphical method in which the user visually assesses stability over time from a trial simulation comprising 10 replications. While more sophisticated and automated approaches are available, our findings reflected others’ experience that these are not always reliable (Hoad et al., Citation2010). Requiring the inspection of just a single plot, the approach taken here therefore supports both simplicity (design principle 3) and the opportunity to educate (design principle 8).
Once the simulation has concluded, the third substantive tab of the navigation bar is unlocked. From here, users can access outputs interactively on the program, or through a comprehensive MS Word report compiled automatically (via R Markdown) or direct downloads of the backing data tables and figures. In ensuring outputs are insightful across all considered uses (design principle 5), a range of performance measures are available for reporting. These are summarised in (with illustrated examples in Supplementary Material C).
Table 4. Description of the types of performance measure as output by the tool.
3.4. Verification of the simulation engine and user interface
Implementation of the simulation engine was verified through gaining confidence that outputs were appropriately generated from the given inputs and chosen modelling assumptions. This was supported in part by spot-testing various scenarios against implementations in other software (AnyLogic and simmer) while taking into account the different assumptions and model constructs that underpin the different tools. For instance, the patient flow model of Wood and Murch (Citation2019) has “Structural versatility” and “Stochastic underpinning” yet lacks many other features outlined in . As such, it has been meaningfully used only for verifying certain aspects of model functionality. Additional verification was carried out through testing whether a priori hypothesised outcomes have held over a variety of scenarios based on incremental model developments (i.e., changing only one parameter value each time and inspecting the resulting behaviour). It should be noted that the potential for unwanted coding errors has been somewhat limited given that the main operation of the tool utilises a fairly straightforward looping DES routine based on existing iterative three-phase methodologies and well-established R packages. Furthermore, regular use over a range of real-life case studies (Section 5.1) and analyst engagement activities (Section 5.2) has lessened the chance of any errors going undetected.
With regard to testing of the GUI, a similar strategy was followed whereby tasks were set to explore a complete assessment of the various levels of functionality within the user environment, ensuring that any bugs were promptly identified and remedied. The GUI was stress tested by examining a multitude of input combinations in order to ensure a wide range of use cases were inspected. Routing testing and checks have been performed periodically to ensure the latest external package versions and iterations of R do not cause problems to the tool’s functionality.
3.5. User acceptance testing
Healthcare analysts were engaged at various stages of development, including in evaluating the final working version of the tool prior to release. Analysts were randomly selected from within the wider Business Intelligence department at the authors’ NHS organisation, in order to ensure a broad range of skillsets and modelling experience were covered (as per Section 2.2, the department is considered to be broadly representative of analysts/teams nationwide). Recognising the importance of ease-of-use software (Sections 2.1 and 2.2), the aim was principally to understand the practical navigability of the interface (design principle 3). To this end, they were challenged with an exam-style scenario representing the type of problem that might realistically be encountered within their jobs (specifically, they were provided with information concerning a two-node pathway and asked to answer questions such as “what is the average waiting time at node A given a capacity of 25 beds”, having configured the wizard with the available input data). The participants were each given an hour to complete the scenario and were monitored by a member of the development team to assess use of the tool. All participants managed to recreate the pathway and complete the analysis. On completion, each user was questioned on how easy they felt the tool was to use and whether any additional information or detail was required to complete the task. Responses led to a small number of changes, mostly in terms of the visual components such as font size, position of buttons, and additional information in help boxes.
4. Illustrative case study
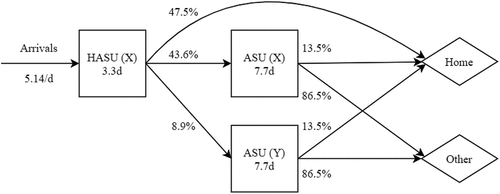
The use of the tool is illustrated through a case study based on real-life application of the tool in supporting the centralisation of stroke services within the Bristol, North Somerset and South Gloucestershire (BNSSG) healthcare system. Centralising stroke services is associated with improved patient outcomes and reduced length of stay (Morris et al., Citation2014) and as such is featured in recommendations contained within the NHS Long-Term Plan (National Health Service England, Citation2019). Within the one million resident BNSSG system, the approximate 1,800 stroke admissions each year are currently cared for in a non-centralised service containing three acute stroke units across the region. Under a centralised pathway, all stroke presentations would be admitted to a single Hyper-acute Stroke Unit (HASU) followed, if required, by transfer to less specialised care at an Acute Stroke Unit (ASU), and then to rehabilitation and community services.
One option under consideration by the Programme Board (overseeing the reconfiguration) involved a single HASU accompanied by two ASUs (), one of which would be co-located at the same hospital as the HASU (X) and the other at a different site (Y). Between the HASU and ASU at hospital Y, a fixed half-day transfer delay (see ) was necessary to account for additional time in transferring the patient (i.e., beyond any delays caused due to a lack of available capacity). No prescribed discharge delays were assumed for “Home” discharges and a gamma-distributed 2-day mean delay was necessary for “Other” discharges in order to account for the realistic possibility of transfer delays to downstream services such as bedded rehabilitation and social care support. Led by a clinical working group, these assumptions, and those relating to the length of stay and the various transition probabilities (detailed in full in Appendix A), were derived from empirical data, expert opinion, and learnings from other reconfigurations (see Wood & Murch, Citation2019 for more detail).
Figure 3. Illustration of considered acute stroke care pathway showing a number of interconnected service nodes (hospital wards) as rectangles and exit nodes (discharge destinations) as diamonds. Note that HASU represents the Hyper-acute Stroke Unit located at hospital X and ASU represents the Acute Stroke Units at hospitals X and Y. For each unit, mean length of stay from admission to discharge readiness is reported in days (d).
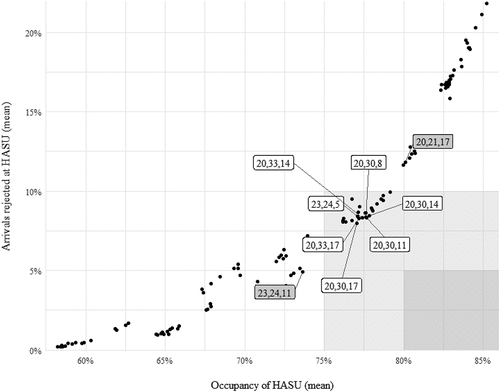
We were tasked with determining the capacity requirements in terms of the number of HASU and ASU beds along this pathway. Specifically, capacity combinations were sought that achieve a HASU occupancy of at least 80% (to ensure adequate utilisation of resources) and ensure that no more than 5% of stroke presentations find the HASU full (and thus have to outlie in a different ward or divert to another HASU at a different hospital). The considered capacity combinations as modelled using the tool were 17 to 29 HASU beds and 21 to 33 and 5 to 17 ASU beds in hospitals X and Y, respectively (noting that the lower bounds of these ranges were deduced through an “averages-based” calculation). See Supplementary Material C for an illustrated walkthrough for calibrating the tool for this application.
Modelled results, obtained through performing 100 replications for each capacity combination with a 50-day warm-up period, suggest that no combination of bed numbers can achieve the desired performance criteria (). The highest achievable occupancy keeping patient rejections below the 5% threshold is 73.6% (for 23 HASU beds and 24 and 11 ASU beds at X and Y, respectively), while the lowest rejections keeping occupancy above 80% is 11.8% (for 20 HASU beds and 21 and 17 ASU beds at X and Y, respectively). Relaxing the thresholds to 10% for rejections and 75% for occupancy yielded a number of feasible capacity combinations that can be investigated further on the grounds of costs relating to the number of beds and associated workforce requirements. Insights such as these have been valuable in the appraisal of options as the Programme Board makes progress towards the full business case.
Figure 4. Association between occupancy and rejected admissions at the Hyper-acute Stroke Unit (HASU), illustrating the Pareto frontier of optimal solutions (each point on the plot corresponds to a given capacity combination). The dark shaded area represents the feasible region for the desired thresholds of >80% occupancy and <5% rejections. The light shaded area represents the feasible region if thresholds are relaxed to >75% occupancy and <10% rejections, with the associated capacity combinations annotated (bed numbers at HASU and ASUs at X and Y). Labels (in dark background) are also provided for the optimal capacity combinations which achieve either >80% occupancy or <5% rejections.
5. Promotion and engagement
In order to promote interest and sustained use, any product should be appropriately branded in generating an association with its envisaged use (Robertson, Citation1989). As such, the tool is named PathSimR in order to account for its key purpose of simulating pathways and being written in R. This section describes how promotion of the tool and engagement with target end users have been approached.
5.1. Distributed material
The tool is implemented through an R script executed on the user’s computer. Accompanying this is the technical and user documentation (Supplementary Material B), an illustrated walkthrough demonstrating the use of the tool (Supplementary Material C), and a library of applied case studies (Supplementary Material D). This library demonstrates the range of available model functionality and provides a blueprint for some of the most common pathways that users may wish to analyse. In addition to the stroke centralisation case study (Section 4), the library details the use of the tool for modelling patient flow in an emergency department (through examination, observation, and treatment rooms), an obstetrics service (through triage, delivery, and recovery), and along a urology pathway (from diagnostics to treatment and follow-up appointments). Material includes an outline of the respective problems, an articulation of the model inputs, and a description and discussion of modelled outputs. Highlighting such applied use is crucially important since previous efforts to develop and deploy simulation tools in analyst communities have provoked feedback that it is “difficult to make the case for investing time in learning something more complicated where the benefit was unknown” (Brailsford et al., Citation2013). It may also help to overcome the psychological barrier of analysts finding it difficult to conceptualise their healthcare pathway as a network of queues and nodes if they are unfamiliar in thinking in such terms.
5.2. Engagement initiatives
The bundled material outlined in Section 5.1 is maintained on a publicly hosted repository (located at github.com/nhs-bnssg-analytics/PathSimR). The constituent electronic files can therefore be openly accessed and linked to from other online sites and social media (design principle 9). In appreciating the recommendations of Bardsley et al. (Citation2019), physical as well as virtual networks have been leveraged, with the tool being launched in a keynote address at the annual NHS-R conference in late 2019. A number of dedicated workshops have since followed, taking healthcare analysts through how the tool can be set up and used to support operational and strategic decisions related to pathway redesign. Being able to readily navigate such a range of analyst-facing channels with on-the-ground knowledge and awareness is particularly important, as is known from previous efforts to disseminate reusable simulation tools to analyst communities – “the project manager was formerly an NHS person and was seen as ‘one of us’ by many respondents” (Brailsford et al., Citation2013).
Stimulating the interest of analysts is a crucial part of promoting the tool but, as is known from other industries, substantive culture shifts – similar to that borne through movement away from simplistic averages-based methods – cannot be isolated, and require backing and buy-in from across an organisation’s hierarchy (Walker & Soule, Citation2017). Managers have therefore been engaged, through regional networks and word of mouth, to help ensure receptiveness to any change in practice and to support in signposting analysts to the tool, given that many can become detached from the wider community (Bardsley et al., Citation2019). While noted that “the academic publication route is unlikely to be effective” with regard to appealing to frontline analysts (Section 2.1), targeting academic channels has been advantageous in promoting the tool to those who can influence the agenda of regional and national analyst networks and events.
6. Discussion
Despite a clear recognition of the importance of understanding and modelling patient flow (Fillingham et al., Citation2016, Bardsley et al., Citation2019), there would appear to be a challenge in encouraging uptake and routine use of simulation tools in healthcare. Some academic efforts have suffered on the grounds of applicability and complexity with commercial solutions held back by cost and lack of healthcare specificity (Brailsford et al., Citation2013; Eldabi, Citation2009; Jahangirian et al., Citation2015; Tako & Robinson, Citation2015). Ultimately, such attempts have not, from the outset, been comprehensively built around the needs of healthcare analysts on the ground, with little evidence of user needs having been prospectively surveyed (Brailsford et al., Citation2013; Palmer et al., Citation2019; Vasilakis et al., Citation2013).
This paper has charted the development of a purpose-built tool, constructed from inception with the needs of the end-user fully in mind. The resulting tool is reusable, generic to a range of problems commonly encountered on the ground, accessible to novices and experts, and written in a language familiar to frontline healthcare analysts (thus enabling onward modifications as new analytical problems arise). The tool also has a capacity to educate users in addressing gaps in knowledge relating to variability, queuing theory, and simulation. The remainder of this section reflects on user feedback, choices made in model construction, and how healthcare simulation modelling may evolve into the future.
6.1. User feedback
Assessing whether the tool meets the needs of the target end user has been approached through an anonymous survey following the first workshop, in which 12 analysts were provided with a case study and corresponding questions to work through using the tool within a four-hour supervised session (Appendix B). Results, in general, were positive in support of the tool meeting the design principles (Section 3.1) with two-thirds of respondents agreeing or strongly agreeing that the tool will allow provision of “more informative insights to the customer or stakeholder” (design principle 5) and 10 of 12 agreeing the tool is “shaped around the kind of demand and capacity problems faced on the ground” (design principle 7). Support was also found for “a good balance between ease-of-use and versatility” with all respondents agreeing this has been achieved. User-friendliness is corroborated with five-sixths of respondents agreeing the “tool is intuitive to navigate”, with one respondent stating, as a free-text comment, “instructions are generally clear” (design principle 3). Users were generally satisfied with the tools’ outputs with three-quarters of respondents agreeing “the range of simulation outputs produced is sufficient to meet typical project requirements”, and all respondents agreeing the “option to output and access results as raw data summaries, automated reports, and interactive dashboards is useful” (design principle 5). While use of the tool does not require any actual R coding, being written in R (design principle 2) leverages an enthusiasm for the software currently enjoyed in the NHS and enables the more competent of users the ability to adjust functionality of the tool through editing the underlying code. Indeed, half of the survey respondents agreed that “being written in R makes it more likely I’ll use the tool”.
The workshop was found to be a “good use of time” by all attendees, corroborating the earlier finding that saw 89% support for the use of workshops in introducing the tool (). Additional surveys will be conducted following future workshops in order to further gauge opinion. These will also consider the extent to which health-specificity of the tool has affected and improved user experience and uptake. Although neither of the conducted surveys has covered this question explicitly, a number of the responses given by those surveyed do relate to healthcare (i.e., satisfaction with tool outputs which are inherently healthcare-specific in design). However, a more forensic analysis of this question would enable investigators to design new tools or develop existing ones (such as ours) to better meet the needs of the end user.
6.2. Model construct and tool design
Patient flow involves a large number of complex behavioural and operational healthcare processes, and as such there are various considerations as to which of these are appreciated within a model. To support such decisions, prospective users were surveyed and asked to rank-score a number of proposed features in terms of their envisaged importance (). This was instrumental in the choices thereafter taken in model development, with those receiving the highest scores being duly implemented in the solution. Of the seven provided, the least supported (by a fair margin) was the incorporation of patient classes and, as such, this was the only feature not implemented. Patient classes relate to the ability to supply and appreciate in the model different attributes for particular cohorts of patient (based, e.g., on age or complexity), whether this be a specific arrival rate, length of stay distribution, or set of transition rates. While this can have benefit for modelling in terms of offering greater realism and additional “handles” to vary as part of scenario analysis (e.g., Griffiths et al., Citation2013), there are obvious complexities associated with representing these many additional degrees of freedom in the input templates (Appendix A), user interface, and fidelity in the data used to populate the input parameters. Such additions would have compromised ease of use (as sought by the user – ), which may be unjustified considering the little aforementioned interest in this feature from prospective users.
There are other features not explicitly considered in the initial survey of users () that also deserve some attention. For instance, the inbuilt distribution fitting tool, which guides users through calibrating the required distributions, was not specifically sought by users, but its addition supports ease of use and is motivated by the findings from previous simulation engagement initiatives that “building a pathway model was considered to be quite easy, taking a relatively short time when compared with the time involved in populating it with data” (Brailsford et al., Citation2013). Another feature of this (and any other simulation) tool is the way in which the warm-up period is detected. Following a thorough review of such literature (Hoad et al., Citation2010) and associated testing, no reliable automated method could be found. Thus, given the known lack of simulation skills in analyst communities, the chosen approach of visual user inspection likely represents the best available solution and additionally has the ability to educate users on such matters – a point borne out through three-quarters of workshop attendees agreeing “the tool has increased my awareness of the need for solutions that appreciate variability” (Appendix B).
6.3. Future of simulation modelling in healthcare
The tool is routinely used at the authors’ healthcare system and, with five-sixths of workshop survey respondents intending to use the tool in future (Appendix B), use is expected to increase. More recently, this has benefitted from additional funding (from The Health Foundation’s Evidence into Practice award) to further demonstrate the applied use of the tool. To date, a diverse range of pathways have been considered for various business cases, including optimising capacity arrangements for a COVID-19 mass vaccination centre in Bristol, the results of which directly informed planning at the site (Wood et al., Citation2021). Outside the authors’ system, there is evidence that engagement initiatives (Section 5.2) have been successful in upscaling the use of the tool. While it is difficult to forensically gauge take-up, there are encouraging amounts of activity on the GitHub repository and email correspondence received. Such correspondence has indicated varied use of the tool, including the estimation of post-discharge social care capacity, patient flow between community mental health services, and hospital ward capacity requirements to meet desired waiting time targets. The nature of a completely open-source tool means that it is difficult to maintain a clear snapshot of the user-base after release. The internal and external surveying and engagement activities are in part biased towards analysts and stakeholders who have actively made themselves known to the authors. As with many open-source tools, there is no automatic feedback facility indicating when the tool is being used and by whom.
In terms of the wider determinants of simulation take-up, there has long been an acknowledgement of a cultural barrier to modelling in the healthcare sector (Pitt et al., Citation2016; Tako & Robinson, Citation2015). In the authors’ experience, this is two-fold. First, analysts should upskill and improve their communication with management. In reviews of the UK health service it has previously been reported that “sometimes our analysts have done great work but they are unable to explain clearly and concisely … so they get ignored” (Bardsley, Citation2016). Through the versatile and interactive outputs of tools such as the one presented in this study, analysts can become better equipped to provide managers with the information sought. Second, managers themselves should become more appreciative of the role in which modelling and simulation tools can play, and gain some familiarity as to their overall functionality, inputs, and outputs. Managers should also understand their role in reducing barriers to use, in prompting IT departments to address frontline experiences such as “getting an open-source application installed on my NHS laptop was a lengthy and arduous process” (Bardsley et al., Citation2019).
Finally, the role which academia can play should be considered. The historical challenges in this regard – alignment in objectives, timescales, and suboptimal stakeholder engagement – have already been reported (e.g., Section 2.1). The concern must be that academic inputs with an overriding motivation for theoretical advancement may not just be underserving any practical objectives but moreover may be dissuading healthcare professionals from any future use of simulation through excessive complexity and protracted timescales. Yet with increasingly sophisticated patient pathways necessitating a growing need for equivalently sophisticated analytical models, there would appear to be a confluence of mutual interests with substantial opportunities for well-considered applied analytical research across this domain into the future.
Supplemental Material
Download PDF (4.9 MB)Acknowledgments
The authors acknowledge the contributions of Andras Varady who performed experimentation associated with automated warm-up period detection. The authors are also grateful to the anonymous reviewers, whose suggestions have improved the quality and legibility of this article.
Disclosure statement
No potential conflict of interest was reported by the author(s).
Supplementary material
Supplemental data for this article can be accessed online at https://doi.org/10.1080/17477778.2022.2081521
Additional information
Funding
References
- Babashov, V., Aivas, I., Begen, M. A., Cao, J. Q., Rodrigues, G., D’Souza, D., … Zaric, G. S. (2017). Reducing patient waiting times for radiation therapy and improving the treatment planning process: A discrete-event simulation model (radiation treatment planning). Clinical Oncology, 29(6), 385–391. https://doi.org/10.1016/j.clon.2017.01.039
- Bardsley, M. (2016). Understanding analytical capability in health care: Do we have more data than insight? Health Foundation.
- Bardsley, M., Steventon, A., & Fothergill, G. (2019). Untapped potential: Investing in health and care data analytics. Health Foundation.
- Bayer, S., Petsoulas, C., Cox, B., Honeyman, A., & Barlow, J. (2010). Facilitating stroke care planning through simulation modelling. Health Informatics Journal, 16(2), 129–143. https://doi.org/10.1177/1460458209361142
- Blasak, R. E., Armel, W. S., Starks, D. W., & Hayduk, M. C. (2003). The use of simulation to evaluate hospital operations between the emergency department and a medical telemetry unit. In Winter simulation conference (Vol. 2, pp. 1887–1893). https://doi.org/10.1109/WSC.2003.1261649
- Brailsford, S. C., Bolt, T., Connell, C., Klein, J. H., & Patel, B. (2009). Stakeholder engagement in health care simulation. In Proceedings of the 2009 Winter Simulation Conference (WSC) (pp. 1840–1849). IEEE. https://doi.org/10.1109/WSC.2009.5429190
- Brailsford, S. C., Bolt, T. B., Bucci, G., Chaussalet, T. M., Connell, N. A., Harper, P. R., and Taylor, M. (2013). Overcoming the barriers: A qualitative study of simulation adoption in the NHS. Journal of the Operational Research Society, 64(2), 157–168. https://doi.org/10.1057/jors.2011.130
- Cahill, W., & Render, M. (1999). Dynamic simulation modeling of ICU bed availability. Paper presented at the proceedings of the 31st conference on winter simulation (Arizona, USA). https://doi.org/10.1109/WSC.1999.816895
- Cayirli, T., & Veral, E. (2003). Outpatient scheduling in health care: A review of literature. Production and Operations Management, 12(4), 519–549. https://doi.org/10.1111/j.1937-5956.2003.tb00218.x
- Cochran, J. K., & Bharti, A. (2006). Stochastic bed balancing of an obstetrics hospital. Health Care Management Science, 9(1), 35–41. https://doi.org/10.1007/s10729-006-6278-6
- Cordeaux, C., Hughes, A., & Elder, M. (2011). Simulating the impact of change: Implementing best practice in stroke care. London Journal of Primary Care, 4(1), 33–37. https://doi.org/10.1080/17571472.2011.11493325
- El-Darzi, E., Vasilakis, C., Chaussalet, T., & Millard, P. H. (1998). A simulation modelling approach to evaluating length of stay, occupancy, emptiness and bed blocking in a hospital geriatric department. Health Care Management Science, 1(2), 143–149. https://doi.org/10.1023/A:1019054921219
- Eldabi, T. (2009). Implementation issues of modeling healthcare problems: Misconceptions and lessons. In Proceedings of the 2009 Winter Simulation Conference (WSC) (pp. 1831–1839). IEEE. https://doi.org/10.1109/WSC.2009.5429192
- Fillingham, D., Jones, B., & Pereira, P. (2016). The challenge and potential of whole system flow. Health Foundation.
- Fone, D., Hollinghurst, S., Temple, M., Round, A., Lester, N., Weightman, A., and Palmer, S. (2003). Systematic review of the use and value of computer simulation modelling in population health and health care delivery. Journal of Public Health, 25(4), 325–335. https://doi.org/10.1093/pubmed/fdg075
- Griffiths, J. D., Williams, J. E., & Wood, R. M. (2013). Modelling activities at a neurological rehabilitation unit. European Journal of Operational Research, 226(2), 301–312. https://doi.org/10.1016/j.ejor.2012.10.037
- Harper, P. R. (2002). A framework for operational modelling of hospital resources. Health Care Management Science, 5(3), 165–173. https://doi.org/10.1023/A:1019767900627
- Harper, P. R., & Shahani, A. K. (2002). Modelling for the planning and management of bed capacities in hospitals. Journal of the Operational Research Society, 53(1), 11–18. https://doi.org/10.1057/palgrave.jors.2601278
- Hoad, K., Robinson, S., & Davies, R. (2010). Automating warm-up length estimation. Journal of the Operational Research Society, 61(9), 1389–1403. https://doi.org/10.1057/jors.2009.87
- Jahangirian, M., Eldabi, T., Naseer, A., Stergioulas, L. K., & Young, T. (2010). Simulation in manufacturing and business: A review. European Journal of Operational Research, 203(1), 1–13. https://doi.org/10.1016/j.ejor.2009.06.004
- Jahangirian, M., Taylor, S. J., Eatock, J., Stergioulas, L. K., & Taylor, P. M. (2015). Causal study of low stakeholder engagement in healthcare simulation projects. Journal of the Operational Research Society, 66(3), 369–379. https://doi.org/10.1057/jors.2014.1
- Koizumi, N., Kuno, E., & Smith, T. E. (2005). Modeling patient flows using a queuing network with blocking. Health Care Management Science, 8(1), 49–60. https://doi.org/10.1007/s10729-005-5216-3
- Kotiadis, K., Tako, A. A., & Vasilakis, C. (2014). A participative and facilitative conceptual modelling framework for discrete event simulation studies in healthcare. Journal of the Operational Research Society, 65(2), 197–213. https://doi.org/10.1057/jors.2012.176
- Law, A. M., & Kelton, W. D. (2000). Simulation modeling and analysis (Vol. 3). McGraw-Hill. https://doi.org/10.1177/003754978203900606
- Lethbridge, T. C. (2014). Teaching modeling using Umple: Principles for the development of an effective tool. In 2014 IEEE 27th Conference on Software Engineering Education and Training (CSEE&T) (pp. 23–28). IEEE. https://doi.org/10.1109/CSEET.2014.6816777
- Mohiuddin, S., Busby, J., Savović, J., Richards, A., Northstone, K., Hollingworth, W., and Vasilakis, C. (2017). Patient flow within UK emergency departments: A systematic review of the use of computer simulation modelling methods. BMJ open, 7(5), e015007. http://dx.doi.org/10.1136/bmjopen-2016-015007
- Monks, T., Worthington, D., Allen, M., Pitt, M., Stein, K., & James, M. A. (2016). A modelling tool for capacity planning in acute and community stroke services. BMC Health Services Research, 16(1), 530. https://doi.org/10.1186/s12913-016-1789-4
- Moreno, L., Aguilar, R. M., Martın, C. A., Piñeiro, J. D., Estevez, J. I., Sigut, J. F., and Jimenez, V. I. (1999). Patient-centered simulation tool for aiding in hospital management. Simulation Practice and Theory, 7(4), 373–393. https://doi.org/10.1016/S0928-4869(99)00007-5
- Morris, S., Hunter, R. M., Ramsay, A. I., Boaden, R., McKevitt, C., Perry, C., and Tyrrell, P. J. (2014). Impact of centralising acute stroke services in English metropolitan areas on mortality and length of hospital stay: Difference-in-differences analysis. Bmj, 349(aug04 4), g4757. https://doi.org/10.1136/bmj.g4757
- National Health Service England. (2019). The NHS long term plan. NHS England. https://www.longtermplan.nhs.uk/
- Palmer, G. I., Knight, V. A., Harper, P. R., & Hawa, A. L. (2019). Ciw: An open-source discrete event simulation library. Journal of Simulation, 13(1), 68–82. https://doi.org/10.1080/17477778.2018.1473909
- Pidd, M. (1998). Computer simulation in management science (No (4th ed.). John Wiley and Sons Ltd.
- Pitt, M., Monks, T., Crowe, S., & Vasilakis, C. (2016). Systems modelling and simulation in health service design, delivery and decision making. BMJ Qual Saf, 25(1), 38–45. http://dx.doi.org/10.1136/bmjqs-2015-004430
- Pritsker, A. A. B., & Alan, B. (1998). Principles of simulation modeling ( pp. 31–51). Wiley. https://doi.org/10.1002/9780470172445.ch2
- Robertson, K. (1989). Strategically desirable brand name characteristics. Journal of Consumer Marketing, 6(4), 61–71. https://doi.org/10.1108/EUM0000000002563
- Rodrigues, F., Zaric, G. S., & Stanford, D. A. (2017). Discrete event simulation model for planning level 2 “step-down” bed needs using NEMS. Operations Research for Health Care, 17, 42–54. https://doi.org/10.1016/j.orhc.2017.10.001
- Salleh, S., Thokala, P., Brennan, A., Hughes, R., & Booth, A. (2017). Simulation modelling in healthcare: An umbrella review of systematic literature reviews. PharmacoEconomics, 35(9), 937–949. https://doi.org/10.1007/s40273-017-0523-3
- Sobolev, B. G., Sanchez, V., & Vasilakis, C. (2011). Systematic review of the use of computer simulation modeling of patient flow in surgical care. Journal of Medical Systems, 35(1), 1–16. https://doi.org/10.1007/s10916-009-9336-z
- Tako, A. A., & Robinson, S. (2015). Is simulation in health different? Journal of the Operational Research Society, 66(4), 602–614. https://doi.org/10.1057/jors.2014.25
- Tako, A. A., & Kotiadis, K. (2015). PartiSim: A multi-methodology framework to support facilitated simulation modelling in healthcare. European Journal of Operational Research, 244(2), 555–564. https://doi.org/10.1016/j.ejor.2015.01.046
- Ucar, I., Smeets, B., & Azcorra, A. (2019). Simmer: Discrete-event simulation for R. Journal of Statistical Software, 90(2), 1–30. https://doi.org/10.18637/jss.v090.i02
- Vasilakis, C., & El-Darzi, E. (2001). A simulation study of the winter bed crisis. Health Care Management Science, 4(1), 31–36. https://doi.org/10.1023/A:1009649615548
- Vasilakis, C., Pagel, C., Gallivan, S., Richards, D., Weaver, A., & Utley, M. (2013). Modelling toolkit to assist with introducing a stepped care system design in mental health care. Journal of the Operational Research Society, 64(7), 1049–1059. https://doi.org/10.1057/jors.2012.98
- Walker, B., & Soule, S. A. (2017). Changing company culture requires a movement, not a mandate. Harvard Business Review, 2–6. https://hbr.org/2017/06/changing-company-culture-requires-a-movement-not-a-mandate
- Wood, R. M., & Murch, B. J. (2019). Modelling capacity along a patient pathway with delays to transfer and discharge. Journal of the Operational Research Society, 71(10), 1–15. https://doi.org/10.1080/01605682.2019.1609885
- Wood, R. M., & Murch, B. J. (2020). Modelling capacity along a patient pathway with delays to transfer and discharge. The Journal of the Operational Research Society, 71(10), 1530–1544. https://doi.org/10.1080/01605682.2019.1609885
- Wood, R. M., Murch, B. J., Moss, S. J., Tyler, J. M., Thompson, A. L., & Vasilakis, C. (2021). Operational research for the safe and effective design of COVID-19 mass vaccination centres. Vaccine, 39(27), 3537–3540. https://doi.org/10.1080/01605682.2019.1609885
- Young, T., Brailsford, S., Connell, C., Davies, R., Harper, P., & Klein, J. H. (2004). Using industrial processes to improve patient care. Bmj, 328(7432), 162–164. https://doi.org/10.1136/bmj.328.7432.162
Appendix A:
Input specification for the simulation model
In order to obtain an adequate specification of the problem, the simulation engine (Section 3.2) requires two user-defined csv tables for the patient pathway under consideration. Example versions of these are given in for the pathway provided in . Note that HASU refers to Hyper-acute Stroke Unit, while ASU refers to Acute Stroke Unit.
Table A1. Example network template input (noting units in days).
Table A2. Example calendar template input.
Appendix B:
Survey responses from the first workshop of the tool
presents anonymous survey responses following the first analyst engagement workshop in which the tool was used by frontline analysts to work through a number of case study questions within a four-hour session.
Table B1. Anonymous feedback from the first analyst engagement workshop (n = 12).