
ABSTRACT
Demand for computed tomography (CT) and CT waiting lists are growing, a problem exacerbated by the postponement of scheduled services during the Covid-19 pandemic. In this case study operational research (OR) methods were used to investigate resource utilisation and CT waiting list growth. Stakeholder involvement was facilitated using system dynamics (SD) for problem conceptualisation and Soft Systems Methodology (SSM) to identify service issues, data requirements, and scenarios for testing. Discrete event simulation (DES) was used to generate metrics pertaining to daily staff work load, process performance (delays) and waiting list evolution, for the current and alternative scenarios. Lessons learnt from the perspective of a clinical modeller are discussed throughout. DES model outputs illustrated the high daily variation in resource utilisation and process delays for the current service where inpatients and outpatients share a single CT scanner. Inpatient examinations were found to consume on average 23% more staff time than outpatient. For non-contrast CT scans, outpatients consumed 63% less time than inpatients. Simulation results for an outpatient-only service demonstrated higher CT and healthcare assistant utilisation, with low variation and process delays. This work recommends the separation of inpatient and outpatient CT services to address the problem of growing CT waiting lists.
Introduction
Increasing demand for computed tomography (CT) is driven by population growth and age profile, coupled with increased screening and the incidence of long-term diseases (Adam, Citation2006; CSO, Citation2015; The Royal College of Radiologists, Citation2020). Long waiting lists and difficulty accessing diagnostics, including CT, have been linked to delayed diagnosis and the referral of patients directly to emergency departments (Irish Cancer Society, Citation2016; O’Regan, Citation2018). Undoubtedly, the waiting list growth and CT service capacity have been negatively impacted by Covid-19 due to the additional infection control measures and downtime required and by the cancellation of scheduled examinations (Cullen, Citation2020; Orsi et al., Citation2020; Zanardo et al., Citation2020).
The case study setting is a single CT scanner department, 100-bed teaching hospital in the West of Ireland. The CT scanner provides a “mixed model” service for unscheduled (inpatient and emergency) and scheduled (outpatient and general practitioner) examinations. Due to the scanner age (installed in 2007), increasing difficulty sourcing replacement parts and increasing frequency of downtime were experienced. Analysis of the CT waiting list identified a significant year on year increase (p = .014) (Conlon & Molloy, Citation2019). Anecdotally, staff reported an increase in daily CT workload and patient complexity. Operational research (OR) methods were used to provide decision support around the CT scanner replacement and growing waiting list problem and the work was championed by a clinical CT radiographer.
Radiology workload has historically been inherently reductionist, considering only the number and type of examinations completed (Naylor, Citation1992; Ondategui-Parra et al., Citation2004; Pitman et al., Citation2004; Brady Citation2011 Snaith et al., Citation2016; Sunshine & Burkhardt, Citation2000). For the radiology community, the novelty of the work lies in the identification of the factors affecting staff workload and quantification of same. For the OR community, the novelty lies in the description of the facilitated use of both hard and soft OR methods over the period and lessons learnt by the clinical modeller. This application of OR is described in terms of “The Mangle” of human experience, lessons learnt and context, so as to allow a richer, more insightful account of the project (Ormerod, Citation2014; Pickering, Citation1995).
Operational Research (OR) methods were adopted to obtain a thorough understanding of the current mixed model of service provision, in particular resource utilisation and staff workload. DES was used as a decision support tool to model waiting list evolution for different service scenarios. The paper describes the three-stage framework used to conceptualise and model the current situation and the facilitated involvement of staff during each stage through to decision-making.
Background
Operational Research (OR) has been described as the art of applying analytical methods and the science of “better” (Ackermann, Citation2012; Kunc et al., Citation2016). Models are simplified representations of a system and are used in OR to help answer questions about the behaviour of that system (Law & Kelton, Citation1991). While it is not possible to model all features of a system, it is possible to model aspects of a system such as a specific problem. Examples of system problems in radiology include growing waiting lists, delays on the day of an appointment, staff working overtime, and staff responses to high workload levels such as burnout, attrition, absenteeism, and errors.
OR techniques may be considered as either quantitative (“hard”) or qualitative (“soft”) or a combination of both and the degree to which stakeholders are involved may vary. Where hard techniques provide rigour and clarity, soft techniques elicit information and provide useful insights (Forrester, Citation1994). The three main “hard” simulation methods are discrete event simulation (DES), system dynamics (SD), and agent-based simulation. Gunal (Citation2012) in “A guide for building hospital simulation models” evaluated the differences between the three main simulation methods in terms of how queues exist, on whether the method is individual or group focused and on where rules are defined.
DES models are individual focused, mostly stochastic and take into account variability in the time taken to carry out activities and the times between arrivals into the system, and are suitable for assisting in the management of resources (Currie et al., Citation2020). An appeal of DES is how it provides a direct physical representation of the system under study and provides metrics at the individual entity level (Morgan et al., Citation2016). DES has been used extensively in radiology and in care pathways which include radiology (Booker et al., Citation2016; Rachuba et al., Citation2018).
System dynamics modelling focuses on the cohort rather than individual and is mostly deterministic. SD captures queues as levels and is useful when trying to capture the behaviour and underlying dynamics of complex systems. System dynamics, systems thinking, and soft OR all aspire to an understanding of and improvement of systems (Forrester, Citation1994). Soft systems methodology (SSM) grew from a need to include stakeholders in the solution of so-called “messy” problems, those which do not have a simple, narrow focus (Ackoff, Citation2010).
SSM requires one to use the experience itself as a research object and to extract learning through conscious reflection (Rodriguez-Ulloa & Paucar-Caceres, Citation2005). Rich picture diagramming (RPD) is a SSM tool which allows groups to reflect and explore their information flows, communications, subconscious, occult sentiments and conflicted understandings (Bell et al., Citation2019; Berg, Citation2015; Rodriguez-Ulloa & Paucar-Caceres, Citation2005). The SSM mnemonic CATWOE is used to identify the Customers, Actors, Transformation, Weltanschaungung or Worldview, Owner and Environmental constraints of a problem situation or reality. Crowe et al. used both RP diagramming and CATWOE in a mixed methods case study to acknowledge multiple perspectives systematically and simultaneously while considering feasible and culturally desirable targeted service improvements (Crowe et al., Citation2017).
The purposeful combination of hard and soft OR techniques is a well-documented approach which allows the strengths of two diametrically opposed approaches to be realised (Lamé, Jouini, etal., Citation2020; Tako & Kotiadis, Citation2015). Examples of facilitated use of DES (hard) and SSM (soft) approaches are well documented in the literature (Fone et al., Citation2003; Kotiadis & Tako, Citation2017; Kotiadis et al., Citation2014; Robinson & Robinson, Citation2001; Robinson et al., Citation2014). Tako and Kotiadis provide a multimethodology framework (PartiSim) which allows for stakeholder facilitation in conceptualisation, experimentation and implementation and post coding stages of OR projects. The framework identifies seven distinct roles for modelling and stakeholder team members as well as the “hard” and “soft” activities and outputs expected for each of the 5 stages (Tako & Kotiadis, Citation2015).
Mixing hard and soft OR can foster interest in OR methods, opening the door for future studies with full institutional cooperation and less distrust (Pessôa et al., Citation2015). It has been proposed that mixing methods may address the much reported dearth of documentation of successful OR project implementations (Brailsford & Vissers, Citation2011; Lamé, Crowe, etal., Citation2020). Barriers to widespread use and adoption of OR methods include cost, analytical capability and experience, tight turnaround time scales, and a failure of available cost-free models to meet analyst’s needs (Tyler et al., Citation2022).
Fellow radiographers, Bleiker et al., called for further research into the pressures specific to the time-pressured, task-focused, rapid turnover, and highly technical environment of projection imaging radiology (Bleiker et al., Citation2018). This work aims to answer the call for further case study examples of facilitated approaches using DES (Fone et al., Citation2003; Kotiadis & Tako, Citation2017). Next is described how mixed OR methods were used to support a decision to replace a CT scanner and the insights gained into the CT service provided, specifically the staff workloads associated with Inpatients (IP) and Outpatients (OP).
Methodology
The case study was undertaken in a 100-bed hospital providing around the clock CT imaging for acute surgical, medical, emergency, maternity, and critical care IPs. The single CT scanner also provides a 9 am to 5 pm scheduled service for OP and general practitioner (GP) patients. Approval to conduct the study and permission to access data was obtained from the hospital Board of Management. All data were anonymised and stored in line with local and general data protection regulation (GDPR) guidelines. The nature and objectives of the research were disclosed to staff, and written consent was obtained from participating staff. Patients were not directly included.
A framework, incorporating both qualitative and quantitative methods, was used to facilitate stakeholder involvement, see . Using a combination of SD, DES, and SSM, staff participated from problem definition to the identification of potential solutions and the selection of a preferred solution. A SD approach was taken to create a conceptual group model, which led to the initial request for patient administration system (PAS) data and subsequent exploratory data analysis. A technical description of the DES model using the STRESS-DES guidelines (Monks et al., Citation2019) is provided in the supplementary material. Pickering (Citation1995) advised that OR projects be described in terms of “The Mangle”, so as to give an account of the sometimes unpredictable transformation that occurs due to resistance and accommodation, the passage of time, and the effect of human agency or choice. Ormerod, in a bid to encourage more informative descriptions of case studies and ground behavioural research into OR practice, recommended insightful narrative in terms of the planned approach, problem met and outcomes (2014).
Figure 1. Three stage framework.
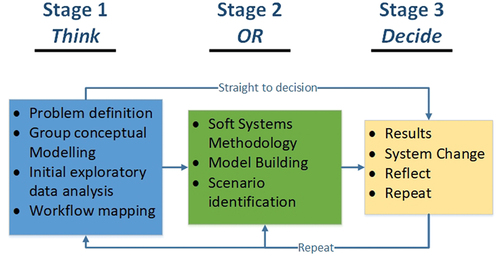
SSM tools were used to:
Elicit insights from staff and decision makers on the factors affecting CT service delivery and data requirements for model parameters.
Identify a list of issues and service constraints.
Identify feasible and desirable scenarios for scanner replacement.
The three-stage framework allowed for an iterative approach to be taken to the problem conceptualisation and modelling of the perceived problem, see .
Stage : exploratory
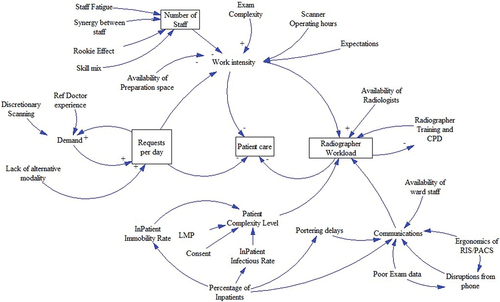
During weekly continuous professional development (CPD) events, staff were introduced to the concepts of stocks and flows, causal links, mental models, and DES. Certificates of participation were provided to staff which contributed to staff CPD portfolios. An important milestone in the project was deciding which modelling paradigm to use. SD was used initially to create group models to identify the factors contributing to workload variations from a staff perspective. Meetings were held individually due to staff time constraints and Vensim was used to capture feedback from staff (n = 6), see . Despite not using SD as the quantitative decision support tool, the qualitative SD models were a useful communication tool. DES was finally decided upon due to its ability to capture discrete patient and staff variables.
Figure 2. Group model of factors affecting CT service.
In stage 1 data required to define the perceived problem and for model building was obtained from the hospital PAS. Using linear regression, the change in demand for Inpatient and Outpatient services was determined. Poisson arrival schedules based on historical data were determined for the various order sources. The inpatient and outpatient cohorts were contrasted in terms of their age, infectiousness, examinations completed, and mobility profiles (Conlon & Molloy, Citation2019). Observations were captured for the process steps of transportation, infection control, and manual handling delays. Microsoft Visio was used to create workflow diagrams for scheduling, patient preparation, scanning, transportation, and reporting. Workflow diagrams and model parameters were verified with the clinical specialist stakeholder.
Lessons learnt
As was identified in previous research, the in-depth domain knowledge and previously established relationship between the researcher and decision makers precluded the need for early involvement of stakeholders in the modelling project (Ross et al., Citation2003). However, as the project developed the importance of including clinical stakeholders rather than advocating for them became apparent. A decision was made to use a SSM approach to include staff directly and capture their experience. An unintended consequence of doing so was to increase in-house system thinking skills, project visibility, and support for the project.
Stage 2: SSM and DES model Building
Another CPD event was organised, this time to introduce staff to SSM. Staff were provided with examples of RP diagrams such as the one created for a service provided to infants with congenital heart abnormalities (Crowe, Citation2016). Following this, the researcher met with staff individually (n = 6), to create a RP diagram of their experience providing a CT service. While it was initially hoped to meet as a group, this was not possible due to time constraints. Meeting individually with staff facilitated staff in voicing their perceived issues privately in what is historically a hierarchical environment.
Interviews were conducted using the mnemonic CATWOE to elicit information related to the factors affecting delivery of the CT service and to create a root definition from multiple perspectives (Checkland, Citation1999). The PQR formula was used to create a root definition, and set out purposeful activity as a transformation. Using the formula:
P describes what is done,
Q describes how it is done,
R describes what is achieved.
A template for the CATWOE-based interview was created which included definitions for Customers, Actors, Transformation Process, etc. Convenience sampling was used to recruit interview participants, which included the CT Clinical Specialist, two CT radiographers, department manager, accident and emergency consultant hospital referrer, hospital porter, and ward nurse. Staff were interviewed in their place of work, which provided an opportunity to build relationships and familiarity. Future practice would benefit from furnishing the interviewees with the self explanatory template in advance to afford them more time to consider their response.
Feedback from the CATWOE interviews was used to augment the final RP. A third CPD event was arranged using video conferencing, to present the final conceptual models, RPD and a list of issues which allowed for a shared group understanding. Radiology decision makers were interviewed to identify feasible and desirable scenarios for testing in the DES model. When discussing potential scenarios, results from stages 1 and 2 were considered, as well as the age of the scanner and risk of disruption to service continuity. Three scenarios were identified and explored using the DES model:
Scenario 1: Waiting list evolution for the current “mixed scanning” scenario to capture baseline metrics for the process, such as CT and staff utilisation, process delays, percentage of time spend on individual tasks.
Scenario 2: Extension of the CT schedule by 3.5 hours daily. Waiting list evolution was observed and metrics for resource utilisation obtained.
Scenario 3: A two scanner scenario where an OP only scanner is added – the effect on waiting list and daily metrics for the OP scanner are captured.
To determine how the waiting list would increase over time for the current scenario, the model ran stochastically, using Poisson arrival rates for new CT requests based on historical data. New schedules were designed with the CT clinical specialist for Scenario 2 and 3.
Lesson learnt
While the commercial modelling software package eliminated some of the barriers to modelling, coding skills were still required to bring agents to life. It was the experience of the researcher, who acted as modeller/coder, recorder, facilitator, and project champion, that coding skills provided the greatest challenge. The desire to model the entire process, rather than the problem, was great and led to unnecessary complexity. For example, the inclusion of the frequency of phone call interruptions was interesting but is an example of over processing or “using a GPS where a compass would have sufficed” (Pidd, Citation2010).
Staff expressed apprehension throughout, that the model would not capture the daily process perturbations such as intravenous extravasation, patient unpreparedness, interruptions, and communications. They also feared the model would not reflect patient-care-related activities and disliked the terms radiographer utilisation and idleness. As a result, “idle time” was renamed as “non scanning activities”. Sensitivity is advised when naming metrics and time should be spent defining the objectives, assumptions, and the need for simplifications.
Stage 3: run scenarios
In stage 3 the model was executed. The iterative approach allowed for multiple requests by decision makers for alternative scenarios once results were considered. Workflow changes to how inpatient transportation was scheduled and patients prepared for exams resulted from the work. As oft reported in the literature, the very process of designing and building the simulation model resulted in change and a greater understanding and appreciation of the behaviour of the wider system and CT service (Dodds & Debenham, Citation2016; Monks et al., Citation2014, Citation2016).
Validation
A combination of techniques was used to validate and verify the model’s accuracy. A structured walk-through approach with CT staff and management was used throughout each phase of model development. Individual patients, created by the model, were examined using log data, to ensure the exam type assigned to the patient resulted in the correct patient preparation, tasks durations, and consumption of resources. Staff were invited to workshop the model and could change staffing parameters to determine the effect on queues, utilisation rates, and use of flexible staff.
For statistical validation, 1 year of historical inputs and outputs were compared to 1 year of model output data. The model was validated, using the patient time in radiology from arrival to scan finish, for all examinations (n = 5958) and then individually for each examination category. For validation, the difference between historical and observed time in the system was plotted to determine (i) the mean error and (ii) the error standard deviation. Results were compared for IP and OP, and subsequently for each exam type. Overall, a mean error difference of 3.36 minutes between the model and the real service was calculated, see .
Table 1. Process validation using mean time in system (minutes).
The growth of the waiting list for 50 model iterations was compared with historic waiting list data and found to be within limits. Based on the results of the statistical validation and verification with clinical staff, the simulation model was determined to adequately represent the CT process within an acceptable margin of error.
Results
Results from the exploratory data analysis into patient characteristics found, as expected, that the inpatient population was older, less mobile, and more likely to be positive for infection than the outpatient population. 73% of examinations completed are unscheduled IP or emergency patients with the remaining 27% consisting of GP and OP exams. The OP waiting list increased significantly (p = 0.014) over the period June 1 2017 to October 1 2020. Further detail on age mobility and infection can be found in earlier work by Conlon and Molloy (Citation2019).
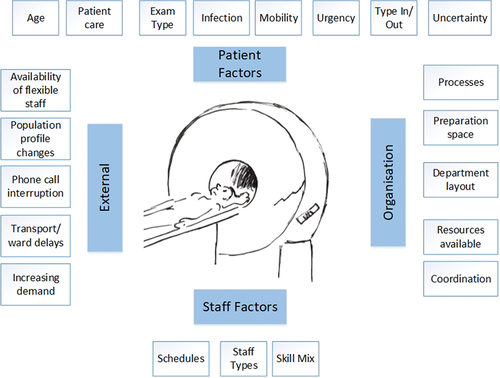
A root definition for the service was devised – the department must provide a safe service and care to patients of varying urgency and from various sources for justified examinations, to facilitate referring doctor who make decisions based on the findings from high-quality diagnostic images and reports. The full CATWOE statement is provided in supplementary material. The factors affecting CT service delivery were ascertained using a SD group modelling and SSM approach (. The factors were categorised as either patient, external, staff, or organisational, an approach previously taken by Rashwan (Citation2017).
Figure 3. Factors affecting CT service.
Baseline process metrics for current scenario
To demonstrate the effect of mixing IP and OP services, process metrics were obtained from the DES model for the current “mixed” scenario (scenario 1) and for an outpatient only scenario (scenario 3), see .
Table 2. Comparison of process metrics for mixed IP/OP and OP only services.
The average scanner utilisation was found to be greater for the OP only Scenario 3, where a daily total of 24 scheduled GP and OP CT examinations were scanned per day. HCA utilisation also increased but average radiographer utilisation was found to decrease. The reliance on flexible staff was quantified as 14.6 occurrences daily where help must be sought to assist with a manual transfer of a patient. Conversely, there was on average 1 request for flexible staff in the OP scenario as OPs are generally more mobile than IP. Work perturbations were greater for IP than OP (11.9 minutes versus less than 1 minute).
The total consumed staff hours for each patient cohort and for each exam type was captured using DES (see ).
Figure 4. Consumed staff time (minutes) for each exam type.
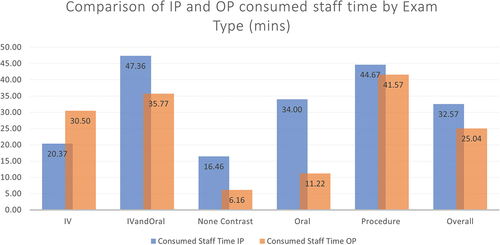
The metric “consumed staff time” captures the total staff time consumed for all CT process activities from patient arrival to exit from CT. For all exam types except “IV” the consumed staff time is greater for IP than OP. For the exam type “IV” the IP is cannulated in advance of coming to the CT department and does not require observation or removal of cannula. The most startling difference can be observed for non-contrast exams, where OPs consume 63% less staff time than IPs. On average, IPs were found to consume 23% more staff time than OP.
For the current scenario, DES was used to demonstrate the daily variation in resource (CT scanner, Radiographer, and assistant) utilisation. The variation in radiographer utilisation is captured in . Previous simulation studies identified average radiation therapist utilisation rates of 56% (Famiglietti et al., Citation2017) and proposed an upper limit of 70% for nursing utilisation rates (Rashwan, Citation2017). As can be seen, radiographer utilisation was found to frequently exceed the selected limit of 70% with underutilisation also evidenced.
Figure 5. Variation in daily radiographer utilisation.
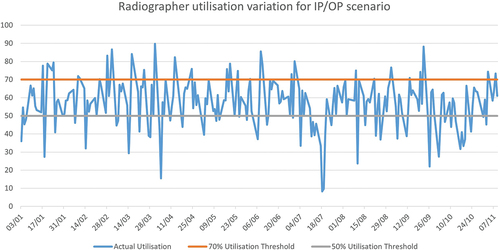
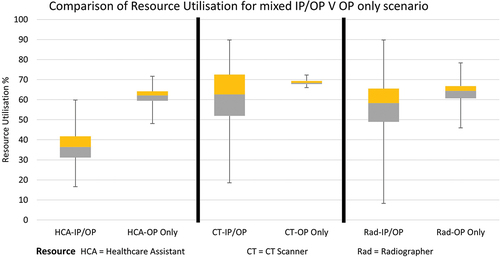
Box plots were used to allow a comparison of resource utilisation for the current scenario and an outpatient only scenario, see . The plus and minus error bars indicate the high variability of utilisation in Scenario 1, particularly for the CT scanner and radiographer resources. HCA utilisation was shown to vary most between scenarios. No overlap is seen between the body of the box plot for HCA (OP) and any of the other box plots. This indicates that in scenario 2 (OP Only) HCAs are more highly utilised, most likely due to the greater amount of preparation required for the OP examinations. Utilisation of the CT scanner varies little in the OP Only scenario from a daily minimum of 66% to a maximum of 72%, a variation of 6%. This contrasts greatly with the box plot for CT utilisation for Scenario 1 where variation ranges from 18% to 90%.
Figure 6. Comparison of resource utilisation for mixed versus outpatient only scanner.
Decision support scenarios
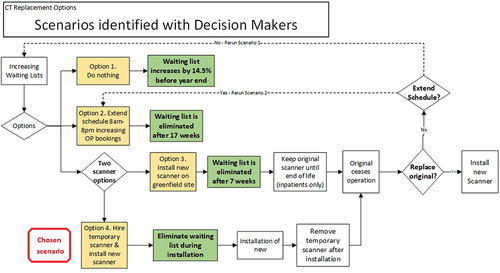
The length of time taken to eliminate the waiting list, for each scenario, was also presented to decision makers, see . The diagram also includes the order in which events take place. Should no change occur (Scenario 1), the waiting list is seen to increase by 14.5% before year end (after 9 months). Limitations of this scenario include a lack of redundancy in the event of scanner breakdown and the inability to separate IP and OP cohorts. In Scenario 2, the scanner schedule was extended to 8 am to 8pm, resulting in additional capacity for 12 OP examinations per day. Here, the waiting list is eliminated after 14 weeks. The scenario does not provide redundancy and requires a culturally undesirable change to staff working hours. In Scenario 3, the 2 CT scanners scenario, 24 additional outpatient and general practitioner cases were scheduled per day. The time taken to reduce the waiting list to zero was 7 weeks and the scenario provides redundancy in the event of a scanner breakdown, as well as the separation of infectious patient cohorts. The fourth scenario identified is a variation of scanner 3 and sees a temporary scanner installed for the duration of time required to instal a second permanent scanner. The temporary scanner is then removed. The original scanner continues to operate until such time as it is decommissioned.
Figure 7. Decision tree for presentation of results from DES model.
Discussion
The three stages of the framework achieved many of the hard and soft outputs achieved by the PartiSim approach (Tako & Kotiadis, Citation2015). The framework allowed for an evolving understanding of the situation and action research approach over the lengthy, four-year period, and contrasts with other approaches, such as PartiSim, which have shorter, more well-defined timeframes for each stage.
Both micro- and macro-level insights and outputs were obtained from the modelling process. On a micro level, the model captured patient-related work perturbations and mid-process delays related to infection control downtime, transportation issues, and manual handling delays, as well as resource utilisation rates (). DES model outputs quantified the difference between the IP and OP populations in terms of these perturbations and consumed staff time. This confirmed the staff hypotheses that IPs consume more staff time than OPs, . In addition to this, the reliance on flexible staff to assist in manual handling was identified during RP building and quantified using DES (). On a macro level, high variability of CT scanner utilisation (18% to 90%) was demonstrated for the current service (). This corroborates recent work which found a similar variation in CT utilisation of between 38% and 91% for a mixed IP and OP CT service (Flood & Wright, Citation2022).
Clinical stakeholders were satisfied that their workload and variation of patient complexity was evidenced. A recommendation from this work is that modelling teams make explicit reference to patient care and non-scanning related tasks in their assumptions and simplifications. Feedback from staff indicated that the stakeholders trusted the model and accepted the insights derived (Harper et al., Citation2021). This can be attributed to the inclusion of clinical and managerial stakeholders at each stage and the many CPD opportunities provided to staff.
In scenario 2, the potential to add capacity following a modification of the outpatient schedule was demonstrated; however, this scenario required an undesirable change to the normal working day. In Scenario 3, a dedicated scanner was provided for the scheduled/outpatient cohort and waiting lists were predicated to decrease to acceptable timeframes within 7 weeks. The scenario provided redundancy against service downtime and allowed separation of inpatient and outpatient cohorts leading to a decrease in daily variation in resource utilisation (6% for CT), . Of particular interest were the higher levels of HCA utilisation and lower levels of radiographer utilisation between the mixed and OP only scenarios, . Workflow analysis identified that most patient preparation tasks, apart from cannulation, could be completed by either the HCA or Radiographer, though where both are available the task defaulted to the HCA. In the current scenario, Radiographers were required to step in where delays or a time out occurred. In the OP-only scenario, however, delays are less likely, allowing the HCAs to perform more tasks required for patient preparation, thus resulting in higher utilisation.
Scenario 3 was identified as the preferred recommendation with the installation of a new outpatient-only scanner. The benefits of scenario 3 included maximised usage of the current scanner, minimal disruption to the service during installation of the new scanner, plus the opportunity to address issues identified during the RP diagramming, such as issues with layout and lack of preparation space.
Importantly, this work confirmed the status of inpatients as “schedule busters” and outpatients as “schedule buffers” (Murray et al., Citation2017; Reinus et al., Citation2000). As previously suggested in the literature, IP and OP CT services are effectively different businesses and should be operated as such (Boland, Citation2008). Separate OP and GP CT services benefit from increased efficiency, reduced variability, and a reduction in downtime due to infection control measures. In addition, vulnerable inpatients would benefit from not sharing waiting areas and corridors with outpatients and those who accompany them, improving their experience of privacy, dignity, and patient centred care (Hyde & Hardy, Citation2021; Murray et al., Citation2017).
This recommendation comes with the caveat that greater access to CT should be considered as a partial solution to the problem of CT waiting lists. By increasing patient access and meeting demand for CT services, the supplier-induced demand (SID) effect could set different feedback loops in motion, fuelling demand for CT resulting in increased use of ionising radiation (Taylor & Dangerfield, Citation2005). A combination of policies will be required to counteract such SID. Exam justification by radiographers and radiologists remains one of the fundamental principles of radiation protection and is key to maintaining the safety of patients in diagnostic and interventional radiology (ESR, Citation2019).
On a national level, this work recommends the establishment of regional diagnostic hubs to provide community-based diagnostics for the outpatients and general practitioner patients and a moving away from the current mixed scenario. As previously found in the use of problem structuring methods such as SSM, it is difficult to evaluate success or claim credit for changes (Mingers & Rosenhead, Citation2004).
A new CT scanner was installed and a temporary scanner hired during installation for redundancy (installation was completed in November 2022). A campaign to hire additional CT qualified radiographers is underway. In the meantime, the original scanner continues to operate and provide a mixed service to IP and OP. Management has suggested further applications for the framework and DES model in other areas (X-Ray and Ultrasound), suggesting evidence of enhanced decision-making skill and of theory becoming baked into practice (Ackoff, Citation2010). Few organisational barriers were encountered during this OR project perhaps because it began as an academic piece of work with support from the Board of Management. Tyler et al. reported limited evidence to suggest that successful OR projects result in a culture of widespread and routine use of OR (Tyler et al., Citation2022). A means for growing in-house OR skills may be to provide staff with access to skilled operational researchers by holding drop-in classes and providing online tutorials on topics such as data analysis, SSM, and simple model building. Staff would also benefit from regular opportunities to showcase their work and learn from the work of others.
While the model was fundamentally a DES model for the process of performing a CT scan, it had SD characteristics, i.e., in how the waiting list accumulated. The model used agent-based simulation (ABS) in the patient queue for preparation. The patient agents queued for preparation by a healthcare assistant unless a threshold of ten minutes was reached where upon a radiographer could be seized to complete the task. AnyLogic supported this hybrid mix of the DES, ABS, and SD paradigms natively.
Limitations and future work
Efforts were made by the clinical modeller and stakeholders to include time for patient care activities in model parameters. What is not measured cannot be managed and any attempt to reduce time per scan can lead an erosion of standards and patient care (Drucker, Citation1998; Oliva and Sterman, Citation2001). Lest it be eroded, time for patient care should be included or acknowledged in assumptions when modelling health services, especially if the trust of clinical staff is to be obtained. Clinicians and radiography students have described a “production-line” mentality and a lack of time as system barriers that diminished their potential for compassion (Sinclair et al., Citation2016). It is increasingly accepted that the public (as individuals, communities, and the voluntary sector) should be involved in designing, delivering, and evaluating health services (Greenhalgh et al., Citation2019; Pearson et al., Citation2013) and future research should include the voice of the patient.
Conclusion
Findings support the separation of IP and OP cohorts, to meet the growing demand for CT services. The work has contributed to the literature by addressing the gap between the clinician interested in quality improvement and the OR expert who has the tools to improve quality. Clinical modellers have an inherent understanding of the hospital workflows and interdepartmental dependencies and can expect easier access to data and the domain. However, the clinical modeller can still expect fear, mistrust, and resistance from staff to their activities being modelled. Inclusion, through education, of staff on the use of OR methods proved an effective means of overcoming this barrier. The novice clinical modeller can expect significant technical challenges when building a model and would benefit from being a part of an established OR team.
Future OR projects undertaken locally will be heavily SSM weighted using hard OR methods to focus on modelling simple metrics such as waiting list evolution rather than detailed staff workload and behaviour metrics. This reflects current modelling/coding capabilities, time constraints, and the number of quality improvement projects underway. The case study which began as an academic endeavour gained traction over the period, and became an important part of the department’s continuous quality improvement plan. In conclusion, the authors consider OR to be like the vampire who must be invited in or else remain knocking on the door. Top down support and direction for OR projects is vital if accurate objectives are to be identified and results acted upon.
Acknowledgments
This work was funded by the Hardiman Scholarship, National University of Ireland, Galway. Many thanks to the radiology department of the case study hospital, in particular the CT Clinical Specialist and Radiology Services Manager. The work and conclusions are not those of the case study department but those of the authors. Please contact the author for the model files which were created in AnyLogic. The authors report there is no competing intent to declare.
Disclosure statement
No potential conflict of interest was reported by the authors.
Additional information
Funding
References
- Ackermann, F. (2012). Problem structuring methods “in the Dock”: Arguing the case for Soft or European. Journal of Operational Research, 219(3), 652–658. https://doi.org/10.1016/j.ejor.2011.11.014
- Ackoff, R. L. (2010). Systems thinking for curious managers. Triarchy Press.
- Adam, E. J. (2006). Changes in the computed tomography patient population. European Radiology, Supplement, 16(4), 38–42. https://doi.org/10.1007/s10406-006-0186-1
- Bell, S., Berg, T., & Morse, S. (2019). Towards an understanding of rich picture interpretation. Systemic Practice and Action Research, 32(6), 601–614. https://doi.org/10.1007/s11213-018-9476-5
- Berg, T. (2015). Rich Picture: The role of the facilitator. Systemic Practice and Action Research, 28(1), 67–77. https://doi.org/10.1007/s11213-014-9318-z
- Bleiker, J., Knapp, K. M., Morgan-Trimmer, S., & Hopkins, S. J. (2018). “It’s what’s behind the mask”: Psychological diversity in compassionate patient care. Radiography, 24, S28–32. https://doi.org/10.1016/J.RADI.2018.06.004
- Boland, G. W. L. (2008). Enhancing CT productivity: Strategies for increasing capacity. American Journal of Roentgenology, 191(1), 3–10. https://doi.org/10.2214/AJR.07.3208
- Booker, M. T., O’Connell, R. J., Desai, B., & Duddalwar, V. A. (2016). Quality improvement with discrete event simulation: A primer for radiologists. Journal of the American College of Radiology, 13(4), 417–423. https://doi.org/10.1016/j.jacr.2015.11.028
- Brady A P. (2011). Measuring Consultant Radiologist workload: method and results from a national survey. Insights Imaging, 2(3), 247–260. doi:10.1007/s13244-011-0094-3.
- Brailsford, S., & Vissers, J. (2011). OR in healthcare: A European perspective. European Journal of Operational Research, 212(2), 223–234. https://doi.org/10.1016/j.ejor.2010.10.026
- Checkland, P. (1999). Systems thinking, systems practice. John Wiley. https://books.google.ie/books?id=Ct0PAQAAMAAJ
- Conlon, M., & Molloy, O. (2019). Knowledge management in healthcare: Information requirements when creating a decision support tool in radiology. IC3K 2019 - Proceedings of the 11th International Joint Conference on Knowledge Discovery, Knowledge Engineering and Knowledge Management, 3(Ic3k), 317–324. https://doi.org/10.5220/0008352703170324
- Crowe, S., Brown, K., Tregay, J., Wray, J., Knowles, R., Ridout, D. A., Bull, C., & Utley, M. (2017). Combining qualitative and quantitative operational research methods to inform quality improvement in pathways that span multiple settings. BMJ Quality & Safety, 26(8), 641–652. https://doi.org/10.1136/bmjqs-2016-005636
- Crowe S, Knowles R, Wray J, Tregay J, Ridout D A, Utley M, Franklin R, Bull C L and Brown K L. (2016). Identifying improvements to complex pathways: evidence synthesis and stakeholder engagement in infant congenital heart disease. BMJ Open, 6(6), e010363. doi:10.1136/bmjopen-2015-010363.
- CSO. (2015). Regional Population Projections 2016 - 2031 - CSO -. Central Statistics Office. http://www.cso.ie/en/releasesandpublications/er/rpp/regionalpopulationprojections2016-2031/
- Cullen, P. (2020). Outpatient waiting list surpasses 600,000 for first time. The Irish Times. https://www.irishtimes.com/news/health/outpatient-waiting-list-surpasses-600-000-for-first-time-1.4330620
- Currie, C. S., Fowler, J. W., Kotiadis, K., Monks, T., Stephan Onggo, B., Robertson, D. A., Tako, A. A., & Currie, S. (2020). How simulation modelling can help reduce the impact of COVID-19. https://doi.org/10.1080/17477778.2020.1751570
- Dodds, S., & Debenham, P. (2016). Learning anti-chaos design in emergency flow. Journal of Improvement Science, 32, 1–14. http://www.journalofimprovementscience.net
- Drucker, P. F. (1998). The discipline of innovation. Harvard Business Review, 76(6), 149–157.
- ESR. (2019). Patient safety in medical imaging: A joint paper of the European Society of Radiology (ESR) and the European Federation of Radiographer Societies (EFRS). Radiography, 25(2), e26–38. https://doi.org/10.1016/J.RADI.2019.01.009
- Famiglietti, R. M., Norboge, E. C., Boving, V., Langabeer, J. R., Buchholz, T. A., & Mikhail, O. (2017). Using discrete-event simulation to promote quality improvement and efficiency in a radiation oncology treatment center. Quality Management in Health Care, 26(4), 184–189. https://doi.org/10.1097/QMH.0000000000000145
- Flood, R., & Wright, L. (2022). Measuring utilisation of CT scanners within an acute trust. Authors. Journal of Improvement Science, 93, 1–19. ISSN 2054–6629.
- Fone, D., Hollinghurst, S., Temple, M., Round, A., Lester, N., Weightman, A., Roberts, K., Coyle, E., Bevan, G., & Palmer, S. (2003). Systematic review of the use and value of computer simulation modelling in population health and health care delivery. Journal of Public Health Medicine, 25(4), 325–335. https://doi.org/10.1093/pubmed/fdg075
- Forrester, J. W. (1994). System dynamics, systems thinking, and soft or. System Dynamics Review, 10(2), 245–256. https://doi.org/10.1002/sdr.4260100211
- Greenhalgh, T., Hinton, L., Finlay, T., Ma, A. M., Fahy, N., Clyde, B., & Chant, A. (2019). Frameworks for supporting patient and public involvement in research: Systematic review and co-design pilot. Health Expectations, 22(4), 785–801. https://doi.org/10.1111/hex.12888
- Gunal, M. M. (2012). A guide for building hospital simulation models. Health Systems, 1(1), 17–25. https://doi.org/10.1057/hs.2012.8
- Harper, A., Mustafee, N., & Yearworth, M. (2021). Facets of trust in simulation studies. European Journal of Operational Research, 289(1), 197–213. https://doi.org/10.1016/j.ejor.2020.06.043
- Hyde, E., & Hardy, M. (2021). Patient centred care in diagnostic radiography (Part 2): A qualitative study of the perceptions of service users and service deliverers. Radiography, 27(2), 322–331. https://doi.org/10.1016/j.radi.2020.09.008
- Irish Cancer Society. (2016). Access to Diagnostics Used to Detect Cancer. http://health.gov.ie/future-health/financial-reform/private-health-insurance-2/
- Kotiadis, K., & Tako, A. A. (2017). Facilitated post-model coding in discrete event simulation (DES): A case study in healthcare. European Journal of Operational Research, 266(3), 1120–1133. https://doi.org/10.1016/j.ejor.2017.10.047
- Kotiadis, K., Tako, A. A., & Vasilakis, C. (2014). A participative and facilitative conceptual modelling framework for discrete event simulation studies in healthcare. The Journal of the Operational Research Society, 65(2), 197–213. https://doi.org/10.1057/jors.2012.176
- Kunc, M., Malpass, J., & White, L. (2016). Behavioral Operational Research (J. M. Martin Kunc & L. White, Eds. Palgrave Macmillan UK. https://doi.org/10.1057/978-1-137-53551-1
- Lamé, G., Crowe, S., & Barclay, M. (2020). “What’s the evidence?”—towards more empirical evaluations of the impact of or interventions in healthcare. Health Systems, 00(00), 1–9. https://doi.org/10.1080/20476965.2020.1857663
- Lamé, G., Jouini, O., & Stal Le Cardinal, J. (2020). Combining soft systems methodology, ethnographic observation, and discrete-event simulation: A case study in cancer care. The Journal of the Operational Research Society, 71(10), 1545–1562. https://doi.org/10.1080/01605682.2019.1610339
- Law, A., & Kelton, D. (1991). Simulation modeling and analysis. 2nd. ed. In W. D. Kelton, Ed. . New York: McGraw-Hill.
- Mingers, J., & Rosenhead, J. (2004). Problem structuring methods in action. European Journal of Operational Research, 152(3), 530–554. https://doi.org/10.1016/S0377-2217(03)00056-0
- Monks, T., Currie, C. S. M., Onggo, B. S., Robinson, S., Kunc, M., & Taylor, S. J. E. (2019). Strengthening the reporting of empirical simulation studies: Introducing the STRESS guidelines. Journal of Simulation, 13(1), 55–67. https://doi.org/10.1080/17477778.2018.1442155
- Monks, T., Robinson, S., & Kotiadis, K. (2014). Learning from discrete-event simulation: Exploring the high involvement hypothesis. European Journal of Operational Research, 235(1), 195–205. https://doi.org/10.1016/j.ejor.2013.10.003
- Monks, T., Robinson, S., & Kotiadis, K. (2016). Can involving clients in simulation studies help them solve their future problems? A transfer of learning experiment. European Journal of Operational Research, 249(3), 919–930. https://doi.org/10.1016/j.ejor.2015.08.037
- Morgan, J. S., Belton, V., & Howick, S. (2016). Lessons from mixing or methods in practice: Using DES and SD to explore a radiotherapy treatment planning process. Health Systems, 5(3), 166–177. https://doi.org/10.1057/hs.2016.4
- Murray, T. E., Halligan, J. J., & Lee, M. J. (2017). Inefficiency, dignity and patient experience: Is it time for separate outpatient diagnostics? The British Journal of Radiology, 90(1080), 4–6. https://doi.org/10.1259/bjr.20170574
- Naylor, A. F. (1992). Quantitative assessment of radiology workload and facilities requirements. European Journal of Radiology, 15(3), 270–275. https://doi.org/10.1016/0720-048X(92)90121-O
- Oliva R and Sterman J D. (2001). Cutting Corners and Working Overtime: Quality Erosion in the Service Industry. Management Science, 47(7), 894–914. doi:10.1287/mnsc.47.7.894.9807.
- Ondategui-Parra, S., Bhagwat, J. G., Gill, I. E., Nathanson, E., Seltzer, S., & Ros, P. R. (2004). Essential practice performance measurement. Journal of the American College of Radiology, 1(8), 559–566. https://doi.org/10.1016/j.jacr.2004.03.020
- O’Regan, E. (2018). Thousands are told in A&E they have cancer - Independent.ie. Irish Independent. https://www.independent.ie/irish-news/health/thousands-are-told-in-ae-they-have-cancer-37580540.html
- Ormerod, R. J. (2014). The mangle of or practice: Towards more informative case studies of ‘technical’ projects. The Journal of the Operational Research Society, 65(8), 1245–1260. https://doi.org/10.1057/jors.2013.78
- Orsi, M. A., Oliva, A. G., & Cellina, M. (2020). Radiology department preparedness for COVID-19: Facing an unexpected outbreak of the disease. Radiology, 295(3), 201214. https://doi.org/10.1148/radiol.2020201214
- Pearson, M., Monks, T., Gibson, A., Allen, M., Komashie, A., Fordyce, A., Harris-Golesworthy, F., Pitt, M. A., Brailsford, S., & Stein, K. (2013). Involving patients and the public in healthcare operational research—the challenges and opportunities. Operations Research for Health Care, 2(4), 86–89. https://doi.org/10.1016/j.orhc.2013.09.001
- Pessôa, L. A. M., Lins, M. P. E., Da Silva, A. C. M., & Fiszman, R. (2015). Integrating soft and hard operational research to improve surgical centre management at a university hospital. European Journal of Operational Research, 245(3), 851–861. https://doi.org/10.1016/j.ejor.2015.04.007
- Pickering, A. (1995). The mangle of practice : Time, agency, and science. University of Chicago Press.
- Pidd, M. (2010). Why modelling and model use matter. Source: The Journal of the Operational Research Society, 61(1), 14–24. https://doi.org/10.1057/jors.2009.141
- Pitman, A. G., Jones, D. N., Seymour, J. F., Pitman, A. G., Stark, R. J., & Prince, H. M. (2004). Radiologist workloads in teaching hospital departments: Measuring the workload. American Journal of Hematology, 77(1), 72–76. https://doi.org/10.1111/j.1440-1673.2005.01524.x
- Rachuba, S., Knapp, K., Ashton, L., & Pitt, M. (2018). Streamlining pathways for minor injuries in emergency departments through radiographer-led discharge. Operations Research for Health Care, 19, 44–56. https://doi.org/10.1016/j.orhc.2018.03.001
- Rashwan, W. (2017). An Integrated Framework for Staffing and Shift Scheduling in Hospitals (Issue November) [Dublin Institute technology]. https://arrow.dit.ie/busdoc/25/
- Reinus, W. R., Enyan, A., Flanagan, P., Pim, B., Sallee, D. S., & Segrist, J. (2000). A proposed scheduling model to improve use of computed tomography facilities. Journal of Medical Systems, 24(2), 61–76. https://doi.org/10.1023/A:1005512729184
- Robinson, A. S., & Robinson, S. (2001). Soft with a Hard Centre : Discrete-Event Simulation in Facilitation Published by : Palgrave Macmillan Journals on behalf of the Operational Research Society Linked references are available on JSTOR for this article : Soft with a hard centre : Discrete-eve. The Journal of the Operational Research Society, 52(8), 905–915. https://doi.org/10.1057/palgrave.jors.2601158
- Robinson, S., Worthington, C., Burgess, N., & Radnor, Z. J. (2014). Facilitated modelling with discrete-event simulation: Reality or myth? European Journal of Operational Research, 234(1), 231–240. https://doi.org/10.1016/j.ejor.2012.12.024
- Rodriguez-Ulloa, R., & Paucar-Caceres, A. (2005). Soft System Dynamics Methodology (SSDM): Combining Soft Systems Methodology (SSM) and System Dynamics (SD). Systemic Practice and Action Research, 18(3), 303–334. https://doi.org/10.1007/s11213-005-4816-7
- Ross, S., Lavis, J., Rodriguez, C., Woodside, J., & Denis, J. L. (2003). Partnership experiences: Involving decision-makers in the research process. Journal of Health Services Research and Policy, 8(SUPPL. 2), 26–34. https://doi.org/10.1258/135581903322405144
- The Royal College of Radiologists. (2020). Clinical Radiology UK Workforce Census 2019 Report. Clinical Radiology, April. http://www.rcr.ac.uk/publications.aspx?PageID=310&PublicationID=359
- Sinclair, S., Norris, J. M., McConnell, S. J., Chochinov, H. M., Hack, T. F., Hagen, N. A., McClement, S., & Bouchal, S. R. (2016). Compassion: A scoping review of the healthcare literature. BMC palliative care, 15(1), 6. https://doi.org/10.1186/s12904-016-0080-0
- Snaith, B., Milner, R. C., & Harris, M. A. (2016). Beyond image interpretation: Capturing the impact of radiographer advanced practice through activity diaries. Radiography, 22(4), e233–238. https://doi.org/10.1016/j.radi.2016.07.005
- Sunshine, J. H., & Burkhardt, J. H. (2000). Radiology groups’ workload in relative value units and factors affecting it. Radiology, 214(3), 815–822. https://doi.org/10.1148/radiology.214.3.r00mr50815
- Tako, A. A., & Kotiadis, K. (2015). PartiSim: A multi-methodology framework to support facilitated simulation modelling in healthcare. European Journal of Operational Research, 244(2), 555–564. https://doi.org/10.1016/j.ejor.2015.01.046
- Taylor, K., & Dangerfield, B. (2005). Modelling the feedback effects of reconfiguring health services. The Journal of the Operational Research Society, 56(6), 659–675. https://doi.org/10.1057/palgrave.jors.2601862
- Tyler, J. M., Murch, B. J., Vasilakis, C., & Wood, R. M. (2022). Improving uptake of simulation in healthcare: User-driven development of an open-source tool for modelling patient flow. Journal of Simulation, 1–18. https://doi.org/10.1080/17477778.2022.2081521
- Zanardo, M., Martini, C., Monti, C. B., Cattaneo, F., Ciaralli, C., Cornacchione, P., & Durante, S. (2020). Management of patients with suspected or confirmed COVID-19, in the radiology department. Radiography, 26(3), 264–268. https://doi.org/10.1016/j.radi.2020.04.010