
ABSTRACT
Nothofagus pumilio and N. antarctica forests of Southern Patagonia, Argentina are currently being managed for production of saw logs with fast growing conditions. The result of these management strategies is faster growing forests, but also an increase in the percentage of low-density wood. The motivation for this study was to find a way to valorise this low-density wood. Surface and bulk densification treatments were applied these wood species and were then applied as face layers in three-layer composites. The mechanical properties of three-layer composites were studied. The modulus of elasticity, modulus of rupture, and modulus of hardness were improved compared to many types of structural composite lumber. This increase in mechanical properties of N. pumilio and N. antarctica wood opens the possibility for its use in structural composites and added value to these otherwise underutilised and undervalued species.
Introduction
The development of innovative, high-added value wood products does not always start in the laboratory, but rather, in the forest. Historically, silviculture and forest management have been used to grow trees that produce wood with specific physical characteristics. Today, Slovenian and Argentinian partners are finding new ways to produce high-quality products from the forest. They have found that they are strongly compatible and complement each other in an effort to integrate forest management and wood processing technologies.
Currently, this effort is focused on the valorisation of lenga (Nothofagus pumilio) and ñire (N. antarctica) woods of Southern Patagonia (Tierra del Fuego and Santa Cruz provinces) in Argentina. Nothofagus is a tree genus native to the southern hemisphere, also known as southern beech. The saw logs in this Southern Patagonia region are currently harvested from native, unmanaged forests (Gea-Izquierdo et al. Citation2004). However, beginning in the 1990s, foresters in the region started management of lenga and ñire forested areas and are looking forward to promoting forest management as a sustainable way to produce high-quality saw logs (Pastur et al. Citation2009). The trees produced in these managed forests are encouraged to grow quickly, resulting in lower density wood. This, in combination with the traits of lenga and ñire wood, leads to wood with mechanical properties that are often unsuitable for many structural purposes (Puettmann et al. Citation2015).
The poor mechanical properties of low-density wood can be improved by wood densification techniques (Seborg et al. Citation1945; Inoue et al. Citation1993; Dwianto et al. Citation1999; Navi and Girardet Citation2000; Blomberg and Persson Citation2004; Kamke Citation2006; Kamke and Sizemore Citation2008; Kutnar et al. Citation2009). By using these techniques, low density and commercially less important wood species can be modified into high-performance and high-value products. One of the emerging eco-friendly methods combines the usage of temperature, moisture, and mechanical actions to produce the so-called thermo-hydro-mechanical treatment. Thermo-hydro-mechanical (THM) processing is implemented to improve the intrinsic properties of wood, produce new materials, and to acquire a form and functionality desired by engineers without changing the eco-friendly characteristics of the material (Navi and Heger Citation2004). There are numerous THM processing methodologies and the number is growing continuously (Kutnar et al. Citation2015). Methods have varied from mechanical to hydrostatic compression with added steam and/or heat (Kutnar et al. Citation2015). The compression can be made throughout the entire cross-section (bulk densification), or only within the first few millimetres of the surface (surface densification) (Rautkari et al. Citation2010).
A simple application of THM is densified wood in a three-layer laminated composite, with densified wood in the two outer layers, and a layer of untreated low-density wood in the core (Nilsson et al. Citation2011). However, three-layer composites are subject to dimensional stability issues, not only from variable shrinkage/swelling variations in species used, but in our case the densification treatments used (Suchsland Citation2004). These variations can result in problems like warping and delamination of laminates. One way to account for this is to make sure the composite is balanced with the same material on the top and bottom layers, and to use the proper adhesives for bonding the composite. This will limit the differential shrinkage/swelling that can take place. A study done by Kutnar et al. (Citation2008) produced such a three-layered composite with Populus deltoides × Populus tri-chocarpa, commonly called hybrid poplar, using a treatment method called viscoelastic thermal compression (VTC). The VTC treatment was applied to the outer layers of hybrid poplar and achieved three densification levels in of 63%, 98%, and 132%. The three-layer specimens were bonded in a hot press for 6 min at 150°C with a pressure of 700 kPa. Composite specimens used phenol formaldehyde (PF) adhesives at a spread rate of 155 g m−2. These composites exhibited significantly higher modulus of rupture (MOR) and modulus of elasticity (MOE) values compared to three-layered composites using non-densified hybrid poplar wood. Kutnar et al. also compared the MOE to commercially produced structural composite lumber like laminated veneer lumber (LVL), parallel strand lumber (PSL), and laminated strand lumber (LSL). MOE values measured from the simple composites in Kutnar et al. were comparable to those commercial products. Studies by Kamke (Citation2006), Ugovšek et al. (Citation2013), and Gaff et al. (Citation2017) confirm these findings. Kamke (Citation2006) tested three-layer composites with viscoelastic thermal compression (VTC) wood in the face layers and the MOE obtained was comparable with values for non-densified specimens. Ugovšek et al. (Citation2013) also applied the VTC process to beech (Fagus sylvatica L.) and concluded that the performance of their three-layer composites was significantly improved to that of non-densified beech layers. Gaff et al. (Citation2017), applied 10% and 20% densification treatments to beech specimens. These treatments resulted in increased MOE values compared to non-densified specimens. Based on the success of these past studies, the objective of this study was to apply bulk and surface densification treatments to the southern beech species, lenga and ñire from Southern Patagonia, improving their mechanical properties, and applying the densified layers in three-layer wood composites.
Materials and methods
Wood specimens
Wood specimens used for laminates were obtained from 10 trees of 2 Nothofagus species: lenga (N. pumilio (Poepp et Endl.) Krasser) and ñire (N. antarctica (Forster f.) Oersted). Trees were harvested from primary, unmanaged forests at Los Cerros ranch (54°20′ SL, 67°52′ WL), Tierra del Fuego, Argentina. They were processed at a sawmill to obtain sawn timber of different dimensions. Wood pieces with mixed radial and tangential annual ring orientation in the cross-section were selected. The nominal specimen dimensions were 290 mm in length, 50 mm in width, and 7 mm in thickness. Specimens were conditioned at 20°C and 65% relative humidity (RH).
Densification
Twenty specimens of each species were prepared for both bulk and surface densification treatments (20 specimens × 2 species × 2 treatments). Prior to densification treatment, the annual ring width was measured (±0.005 mm), to quantify its effect on the level of densification achieved.
Surface and bulk densification of lenga and ñire were performed in a hydraulic, 50 kN capacity Langzauner (Lambrechten, Austria) “Perfect” model hot press equipped with a cooling system. Specimens were placed in the heated press and pressed to a target thickness of 2.5 mm, which was controlled by metal stops. Pressing parameters for bulk and surface densification treatments are presented in . In case of surface densification only the upper platen was heated. When the metal stops were reached, the holding time for surface densification was one minute and for bulk densification two minutes. In both treatments, the platens were cooled down to 80°C before opening the press. Immediately after densification the weight and dimensions of the specimens were measured. Specimens were then conditioned at 20°C and 65% RH. Based on these measurements, the density ratio was calculated as the density after treatment divided by the initial density. Spring back was calculated as the difference between the densified thickness and the target thickness (2.5 mm), divided by the target thickness.
Table 1. Pressing parameters for surface and bulk densification.
Three-layer composite specimens
Surface and bulk-densified specimens were used to produce three-layer composites (). Composites were created using the densified lenga or ñire for the upper and lower laminates. Composites were also made from non-densified lenga and ñire as control specimens. There were ten replicates for control and surface densification specimens, and eight for bulk-densified specimens. Non-densified, commercially acquired spruce cut to 6 mm thick was used as the core material in all three-layer composites and in all three layers for control specimens. The composites were bonded with polyvinyl acetate (PVA) in a hot press at 50°C for 45 min. The adhesive was applied to one surface using an adhesive coverage of 200 g m−2.
Figure 1. Three-layer composites made with Nothofagus outer laminates and a spruce core. Non-densified control composites (left), three-layer composites using surface densified outer laminates (middle), and three-layer composites using bulk-densified outer laminates (right).
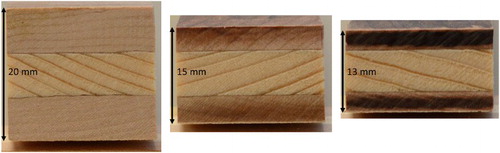
Three-layer composites were then cut lengthwise into two specimens with nominal dimensions of 280 mm in length, 22 mm in width, while their thickness varied depending upon densification treatment ().
Mechanical testing
Control, surface densified, and bulk-densified three-layer composites were tested using four-point flexure and hardness tests (). Flexure tests were based upon ASTM D198 (Citation2008). The test speed for four-point flexure tests was 10 mm min−1. Span to depth ratios varied by specimen due to densification treatments changing the thickness, but were all greater than 20. MOE, MOR, and maximum force (FMax) were measured. MOE was calculated using a regression between 5% and 30% of FMax. Within this range, an extensometer arm was used to more accurately measure deflection. MOR was calculated based on FMax.
Figure 2. Four-point flexure test setup with extensometer arm engaged (left) and hardness test fixture and tested specimen (right).
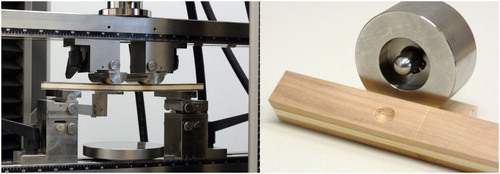
Hardness tests based on the Janka ball test (ASTM D1037 Citation1999) were performed, however, our specimens were layered composites and did not meet the specimen dimensions required by the Janka test (150 mm × 75 mm × 25 mm). Therefore, in addition to measuring the force required to embed the test ball as prescribed by the Janka test, we followed the recommended procedures found in Lewis (Citation1968) as guidance in which the modulus of hardness (MOH) is calculated. This procedure accounts for our specimens being layered, densified composites, with non-standard geometries. Two tests were performed for each specimen, one on each end, 70 mm from the end of the specimen. The right side of shows one of these tests, 70 mm from the end of a non-densified, control specimen. The test speed was 6 mm min−1. The force at 5 mm (F5mm) was also measured.
Data and statistical analysis
Data related to physical properties (density, annual ring width) and mechanical properties (MOE, MOR, FMax, MOH, F5mm) were analysed to determine if species or degree of densification affected them. Data analysis was carried out in RStudio version 1.0.153 (RStudio Team Citation2017), with R version 3.4.1 (R Core Team Citation2017). Charts were produced using the ggplot2 R Package (Wickham Citation2009).
Mixed models and random effects – Due to the production method for test specimens, where individual specimens (experimental units) were pressed then cut lengthwise into two separate pieces (i.e. specimen “1” has two parts, “1a” and “1b”, which were measured individually), observations of mechanical properties were repeated measures (e.g. observation “a” and “b” of each specimen). Furthermore, two measurements were recorded for each part of a specimen for hardness data, and this was modelled as a nested random effect (i.e. observation within part). To include these repeated measures in our analysis, linear mixed models were constructed using the R package lme4 (Bates et al. Citation2015), and analysed with the R packages lsmeans (Lenth Citation2016), lmerTest (Kuznetsova et al. Citation2016), and multcomp (Hothorn et al. Citation2008). Linear model fit was assessed based on comparison of several indicators, including Akaike’s Information Criterion, Bayesian Information Criterion, log likelihood, and deviance. When mixed models were used, reported p-values are approximate.
Non-parametric tests – When data did not meet the assumptions of linear models based on the normal distribution or of parametric t-tests, we used the Kruskall–Wallis rank sum test instead. This test uses the ordinal rank of the observation rather than its continuous scale value and is not dependent on the distribution of the data.
The MOE data did not meet the assumptions of linear models based on the normal distribution, and were instead analysed with the Kruskall–Wallis rank sum test. The response variable for this test was the mean of the two observations for each specimen. Dunn’s test was used to examine contrasts of the means of MOE data based on the level of densification of the surface layers using the dunn.test R package (Dinno Citation2017). Reported p-values for MOE contrasts are approximate and include Bonferroni adjustments to account for multiple comparisons.
The MOR data met the assumptions of linear models based on the normal distribution. The data were fit to linear mixed models with observation as a random effect. The selected model had no interaction effects.
The FMax data were transformed using the natural logarithm to meet the assumptions of linear models based on the normal distribution. The data were fit to linear mixed models with observation as a random effect. The selected model had no interaction effect. Reported point estimates are medians, and estimated differences between point estimates are multiplicative.
The MOH data were transformed using the natural logarithm to meet the assumptions of linear models based on the normal distribution. The data were fit to linear mixed models with measurement nested within observation as a random effect. The selected model included an interaction effect between species and treatment (degree of densification). Reported point estimates are medians, and estimated differences between point estimates are multiplicative.
The F5mm data met the assumptions of linear models based on the normal distribution. The data were fit to linear mixed models with measurement nested within observation as a random effect. The selected model included an interaction effect between species and treatment (degree of densification).
Tukey contrasts with adjusted p-values and 95% confidence intervals are reported for the MOR, MOH, FMax, and F5mm results.
We also use the Kruskall–Wallis rank sum test for: (i) the degree of densification tested for relationships with species and annual ring width before densification; and (ii) the annual ring width tested to determine if it depends on species.
The data and R code used are available in the figshare online archive (Burnard et al. Citation2017).
Results and discussion
Densification
provides a summary of the results for surface and bulk densification treatments in both species.
Table 2. Density and thickness before and immediately after surface and bulk densification of outer layers of three-layer composites.
In our sample, the mean annual ring width before densification treatment for lenga was 2.07 ± 0.88 mm and 2.40 ± 0.64 mm for ñire. Based on the Kruskall–Wallis rank sum tests, there was slight evidence of a difference between average ring width for each species (p-value ∼ .044). Degree of densification was not found to be dependent on ring width (p-value ∼ .513), but there was strong evidence that the degree of densification varied between species (p-value ∼ .003). Both surface and bulk-densified lenga laminates had a higher degree of densification (1.73 and 2.20, respectively) compared to that of ñire laminates (1.44 and 1.86, respectively). This was expected as lenga has a lower initial density than ñire. Based on the densified thicknesses measured, it was found that there was less thickness recovery in bulk-densified specimens compared to surface densified specimens.
While the annual ring width from both lenga and ñire were found to have no effect on the degree of densification it is important to remember that the specimens used in this study were all taken from primary, unmanaged forests. There was little difference between annual ring widths and the specimens’ proportion or earlywood to latewood resulting in similar initial densities. In future studies, it would be interesting to sample trees from both unmanaged and well-managed forests that encourage faster growth and larger annual rings. In this sample of specimens, we would expect to see a larger effect on the degree of densification.
Flexure tests
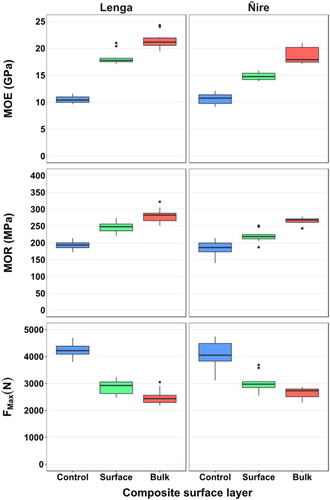
Flexure tests were conducted to identify the difference in the strength properties between densification treatments and species. A summary of the raw data from the flexure tests are presented in . Both lenga and ñire species had similar trends for all three measurements (MOE, MOR, and FMax). Composites created with bulk-densified laminates of both species had the highest levels of MOE and MOR, and the lowest values for FMax. FMax decreased with increasing level of densification, where the control specimens had the highest median FMax and bulk-densified specimens had the lowest median FMax values.
Figure 3. Moe, MOR, and FMax determined from flexure tests of three-layer composites. The left facets used lenga for the upper and lower laminates, and the right facets used ñire laminates. Control specimen laminates were not densified.
Failure modes were categorised using the same descriptions as found in ASTM D143 (Citation2000). While those descriptions were initially intended for small, clear specimens, they are useful references for describing observed failure modes in our composite specimens. Control composites with no densified laminates failed almost equally in simple tension and horizontal shear. Both surface and bulk-densified specimens had 60% horizontal shear failure, and about 30% simple tension failure. The small remainder of the failures were in a “cross-grain” tension manner. The increased number of failures in horizontal shear in densified specimens may be due to the difference in the MOE between the densified outer laminate and the inner non-densified core layer, which caused bondlines to fail before the wood material.
Modulus of elasticity
MOE data is plotted in . Based on the Kruskal–Wallis rank sum test performed there was no significant difference between MOE distributions for species (p-value ∼ .123) and so our comparisons were made between the densification treatment types only and both species are considered together. A summary of the MOE data can be found in . Control specimens had a median MOE of 10.5 GPa which increased to 16.5 GPa when laminates were surface densified. Composites constructed with bulk-densified laminates had the highest median MOE value of 20.9 GPa.
Table 3. Summary of MOE data including both Nothofagus species.
Based on comparisons between these MOE distributions, we can conclude that: (i) there is no evidence that lenga and ñire have different MOE distributions (p-value ∼ .123); (ii) there is strong evidence that the MOE of surface densified and control specimens have different distributions (p-value ∼ .005); (iii) there is strong evidence that the MOE of bulk-densified and control specimens have different distributions (p-value < .001); and (iv) there is no evidence that the MOE of bulk and surface densifications have different distributions (p-value ∼ .098).
Similar to our study, Kutnar et al. (Citation2008) performed flexure tests on three-layer composites, with each layer produced with Populus deltoides × Populus tri-chocarpa, commonly called hybrid poplar. The outer layers were densified using a viscoelastic thermal compression (VTC) process. The final three-layer composite was constructed using untreated specimens for all layers. The core layer of all three-layer composites was non-densified hybrid poplar with a density of 331 kg m−3. Using the VTC procedure, they produced three levels of surface densification resulting in densification ratios of 0.63, 0.98, and 1.32. The MOE and MOR values of these three-layer composites improved with the increased density of the surface layers. The MOE of the control three-layer composite was determined to be 8.7 GPa, while the composite with the laminas of the highest density was 19.9 GPa. Taking into consideration the significant difference in densities of hybrid poplar (331 kg m−3) and the Nothofagus species used in this study (510–580 kg m−3), Kutnar et al. had similar MOE values to those in this study. In this study, control (10.5 GPa) and bulk-densified (20.9 GPa) MOE values were only slightly higher than Kutnar et al. (Citation2008). However, the degrees of densification were much different. In this study, the bulk-densified specimens had a density ratio of 1.88 (ñire) to 2.20 (lenga), while in the study by Kutnar et al. the maximum density ratio was 1.32. Based on MOE values of common structural composite lumber materials (using yellow poplar) presented by Kutnar et al. (Citation2008), the MOE values from the three-layer composites in this study were found to be higher than those of LVL (13.8 GPa), PSL (13.8 GPa), and LSL (10.3 GPa).
Similar to the beech species in this study, Ugovšek et al. (Citation2013) applied the VTC densification process to European beech (F. sylvatica L.) and concluded that three-layer VTC beech composites bonded with PF adhesive had significantly better bending performance than three-layer composites produced with non-densified beech lamellas. The densified surface layers of the three-layer composites increased the MOE and MOR by more than 100%. In our study, the three-layer composites using bulk-densified lamellas increased in MOE by 200% and MOR by 150%.
Modulus of rupture
The MOR data indicated a comparable, increasing pattern associated with increasing degree of densification between species (). Our analysis confirmed this trend, and revealed evidence of differences between species and between degrees of densification. There was no evidence of an interaction effect between species and degree of densification for MOR.
Across all densification types, the MOR of three-layer composites using lenga is estimated to be 17.8 MPa higher than those using ñire (p-value < .001, CI: 8.4–27.1 MPa). However, in the absence of an interaction effect between species and densification, our primary interest is the fixed effect of densification, therefore, both species are considered together in the following analysis. The mean value of MOR varied significantly between densification types ().
Figure 4. Estimated mean MOR for three-layer composites with non-densified (control), surface densified (surface), and bulk-densified (bulk) surface layers with 95% CIs of both Nothofagus species.
Based on estimates from our model the following contrasts were calculated: (i) the MOR of surface densified ñire or lenga wood is estimated to be 44.6 MPa greater than the control (non-densified) specimens (p-value < .001, CI: 31.5–57.7 MPa); (ii) the MOR of bulk-densified ñire or lenga is estimated to be 84.3 MPa greater than control specimens (p-value < .001, CI: 70.3–98.3 MPa); and (iii) the MOR of bulk-densified ñire or lenga is estimated to be 39.7 MPa greater than surface densified specimens (p-value < .001, CI: 25.7–53.7 MPa).
As with the comparisons made between studies regarding the MOE results, the same can be made for MOR values. With increasing level of densification, there were increasing MOR values. However, MOR measured in our study was much higher than that of Kutnar et al. (Citation2008). The highest MOR for Kutnar et al. was 87 MPa, while for our study, the estimated mean bulk-densified MOR was 273 MPa. We believe that this is due to the much higher degree of densification experienced in our study.
Maximum force
As with MOR, there was no interaction effect between species and treatment, and our interest was in the difference in FMax between treatments. The FMax data indicated an inverse trend with increasing degree of densification. Observed FMax was greatest for control specimens, and lowest for bulk-densified specimens (). In our model, the response variable (FMax) was log transformed to address skewness in the raw data and therefore we are reporting the medians instead of the means. The reported difference between estimated medians is multiplicative. Our model had no interaction effects and there was no significant difference between species (p-value ∼ .402). FMax was greatest for the control specimens (median 4128 N, CI: 3713–4590 N), and decreased as the degree of densification increased ().
Figure 5. Estimated median FMax for three-layer composites with non-densified (control), surface densified (surface), and bulk-densified (bulk) surface layers with 95% CIs of both Nothofagus species.
Based on our model estimates we can report the following contrasts: (i) the median FMax of surface densified ñire or lenga is expected to be 0.71 times that of control specimens (p-value < .001, CI: 0.66–0.77); (ii) the median FMax of bulk-densified ñire or lenga is expected to be 0.62 times that of control specimens (p-value < .001, CI: 0.57–0.67); and (iii) the median FMax of bulk-densified ñire or lenga is expected to be 0.86 times that of surface densified specimens (p-value < .001, CI: 0.80–0.94).
The FMax was reduced for both surface and bulk-densified laminates of both species. This behaviour is expected and can be incorporated into the design strength of elements in bending. If these densified laminates were to be used in products like glue-laminated beams, the design strength would be based on the yield point where the transition to plastic deformation of the beam occurs and the FMax achieved would only come into effect in case of complete failure.
Hardness tests
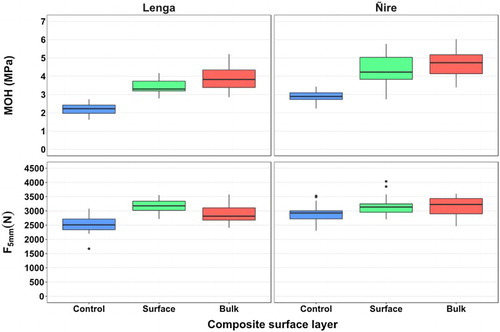
The raw data from the hardness tests are presented in . Control specimens had the lowest median MOH values in both species (lenga = 2.23 MPa, ñire = 2.90 MPa), and bulk-densified specimens had the highest median MOH values with lenga at 3.83 MPa and ñire at 4.74 MPa. Median F5mm values were also the lowest in control specimens (lenga = 2510 N, ñire = 2928 N).
Figure 6. Hardness of three-layer composites with non-densified (control), surface densified (surface), and bulk-densified (bulk) surface layers. The left facets used lenga for the upper and lower laminates and the right facets used ñire laminates. Control specimen laminates were not densified.
Based on this raw data, linear mixed models were fitted and assessed. This assessment revealed differences between treatments which will be discussed below.
Modulus of hardness
The response data for MOH were transformed with the natural logarithm in order to meet the assumptions of linear models based on the normal distribution. As a result, reported values for MOH data are estimates of medians, and the estimated differences between medians are multiplicative.
Based on the linear mixed model fitted to the raw data, medians of MOH were estimated for species and densification levels with 95% CIs separately (, ), because there was an interaction effect between species and treatment.
Figure 7. Estimated median MOH for three-layer composites with non-densified (control), surface densified (surface), and bulk-densified (bulk) surface layers with 95% CIs of both Nothofagus species.
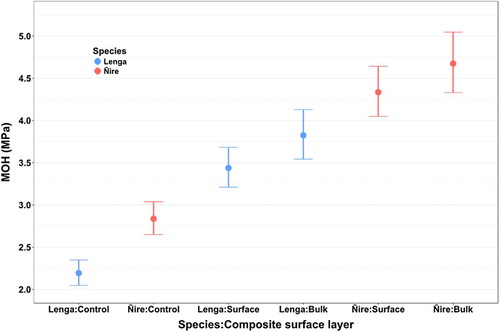
Table 4. Estimated median MOH for each species and treatment combination.
Based on these estimates we can estimate the difference between the degrees of densification for each species. For lenga, the differences between treatments are: (i) the median MOH of surface densified specimens is estimated to be 1.57 times greater than control specimens (p-value < .001, CI: 1.38–1.78); (ii) the median MOH of bulk-densified specimens is estimated to be 1.74 times greater than control specimens (p-value < .001, CI 1.52–2.00); and (iii) there is no evidence of a difference in MOH between bulk and surface densified specimens (p-value ∼ .188). For ñire, the differences between treatments are: (i) the median MOH of surface densified specimens is estimated to be 1.53 times greater than control specimens (p-value < .001, CI: 1.35–1.74); (ii) the median MOH of bulk-densified specimens is estimated to be 1.65 times greater than control specimens (p-value < .001, CI: 1.44–1.89); and (iii) there is no evidence of a difference in MOH between bulk and surface densified specimens (p-value ∼ .528).
After accounting for differences in densification levels, lenga specimens are expected to have lower median values than ñire specimens. This result is interesting because the density of both surface and bulk-densified lenga laminates was higher than that of ñire. We would expect that higher density laminates would have higher MOH values, however, we believe that this may be caused by the higher density laminates transferring load into the more compliant core material more efficiently.
Rautkari et al. (Citation2011) studied the Brinell hardness of composites that had either one or two layers of densified wood in order to investigate the influence of layer thickness in the hardness test. The results showed that a thin layer of densified wood increases the hardness significantly. Furthermore, Boonstra and Blomberg (Citation2007) measured the Brinell hardness of wood densified with the semi-isostatic densification process and found that the Brinell hardness of untreated Pinus radiata was increased by 271% after densification. Also, Fang et al. (Citation2012) reported that the Brinell hardness of densified veneer, densified using heat, steam, and pressure, was about two to three times that of control for both aspen and hybrid poplar.
The results of the hardness tests were largely governed by the entire composite layup including the non-densified core layer, rather than just the laminates on the top and bottom. The hardness results showed that for both species there was an increase in MOH from control specimens to both densification levels, and only a small difference between the densification levels. Increasing MOH through densification increases the range of uses for low-quality species, especially in furniture applications where the material is exposed to the user, for example, as a writing surface, eating surface, etc.
Force at 5 mm
Based on the linear mixed model fitted to the raw data, there was some evidence of an interaction effect between species and treatment in the F5mm model (p-value ∼ .027). Therefore, mean F5mm with 95% CIs were estimated for each species and composite group separately. These estimates are plotted in and presented in .
Figure 8. Estimated F5mm for three-layer composites with non-densified (control), surface densified (surface), and bulk-densified (bulk) surface layers with 95% CIs of both Nothofagus species.
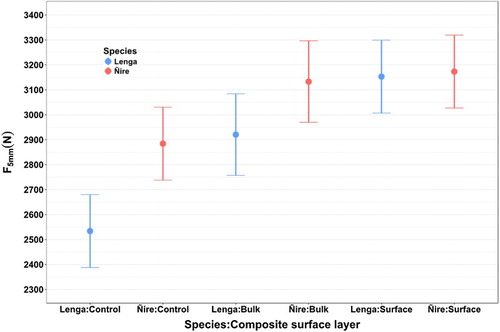
Table 5. Mean F5mm for each species and densification combination with 95% CIs.
Based on these values we estimated the difference between mean values for each treatment within species groups. The differences in the estimated mean F5mm for lenga specimens are: (i) the difference between mean estimated F5mm for surface densified and control specimens is 618.9 N (p-value < .001, CI: 347.9–889.9 N); (ii) the difference between mean estimated F5mm for bulk-densified and control specimens is 386.6 N (p-value ∼ .003, CI: 99.18–674.0 N); and (iii) there is no evidence of a difference between mean estimated F5mm for surface densified and bulk-densified specimens (p-value ∼ .171). The differences in estimated mean F5mm for the ñire specimens are: (i) the difference between mean estimated F5mm for surface densified and control specimens is 289.0 N (p-value ∼ .031, CI: 17.99–559.9 N); (ii) there is no evidence of a difference in F5mm for bulk-densified and control specimens (p-value ∼ .122); and (iii) there is no evidence of a difference in F5mm between surface densified and bulk-densified specimens (p-value ∼ .995).
Conclusion
Densification of N. pumilio and N. antarctica wood improved the strength, stiffness, and hardness of the three-layer wood composites used in this study. The results showed that MOE, MOR, and MOH of the three-layer composites were significantly improved due to the increased density of the densified wood in the face layers. The MOE values of the densified composites used in this study were higher than those from commercially produced structural composite lumber materials like LVL, PSL, and LSL. The improved mechanical properties make it possible for these densified species to be considered for use in structural composites. By applying densification treatments to these two underutilised Nothofagus species, their mechanical performance can be increased with respect to MOE, MOR, and MOH. These results present a likely use case for densified lenga or ñire as a thin layer adhered to some core material and used in furniture, flooring, or where other high-abrasion surfaces are needed.
Disclosure statement
No potential conflict of interest was reported by the authors.
ORCID
Matthew Schwarzkopf http://orcid.org/0000-0002-6544-1400
Michael Burnard http://orcid.org/0000-0001-9357-0819
Guillermo Martínez Pastur http://orcid.org/0000-0003-2614-5403
Lucas Monelos http://orcid.org/0000-0001-9277-5644
Andreja Kutnar http://orcid.org/0000-0001-8366-6227
Additional information
Funding
References
- ASTM D1037 (1999) Standard test methods for evaluating properties of wood-base fiber and particle panel materials. American Society for Testing and Materials, 1–31. doi:10.1520%2Fd1037.
- ASTM D143 (2000) Standard test methods for small clear specimens of timber. American Society for Testing and Materials, 1–31. doi:10.1520/d0143.
- ASTM D198 (2008) Standard test methods of static tests of lumber in structural sizes. American Society for Testing and Materials, 1–25. doi:10.1520/d0198.
- Bates, D., Mächler, M., Bolker, B. and Walker, S. (2015) Fitting linear mixed-effects models using lme4. Journal of Statistical Software, 67 (1), doi:10.18637/jss.v067.i01.
- Blomberg, J. and Persson, B. (2004) Plastic deformation in small clear pieces of Scots pine (Pinus sylvestris) during densification with the CaLignum process. Journal of Wood Science, 50 (4), 307–314. doi:10.1007/s10086-003-0566-2.
- Boonstra M. J. and Blomberg J. (2007) Semi-isostatic densification of heat-treated radiata pine. Wood Science and Technology, 41, 607–617. doi:10.1007/s00226-007-0140-y.
- Burnard, M., Schwarzkopf, M., Pastur, G. M., Monelos, L. and Kutnar, A. (2017) Analysis and data from mechanical testing of three-layer wood composites with densified Argentinian beech for the outer layers. figshare, Accessed 3 August 2017, available at: https://figshare.com/articles/Analysis_and_data_from_mechanical_testing_of_three-layer_wood_composites_with_densified_Argentinian_beech_for_the_outer_layers/5264263. doi:10.6084/m9.figshare.5264263.v1.
- Dinno, A. (2017) dunn.test: Dunn’s test of multiple comparisons using rank sums. R package version 1.3.4. Accessed 10 June 2017, available at: https://CRAN.R-project.org/pacakage=dunn.test
- Dwianto, W., Morooka, T., Norimoto, M. and Kitajima, T. (1999) Stress relaxation of sugi (Cryptomeria japonica D. Don) wood in radial compression under high temperature steam. Holzforschung, 53 (5), 541–546. doi:10.1515/hf.1999.089.
- Fang C., Mariotti N., Cloutier A., Koubaa A. and Blanchet P. (2012) Densification of wood veneers by compression combined with heat and steam. European Journal of Wood and Wood Products, 70 (1), 155–163. doi:10.1007/s00107-011-0524-4.
- Gaff M., Babiak M., Vokatý V., Gašparík M. and Ruman D. (2017) Bending characteristics of hardwood lamellae in the elastic region. Composites Part B: Engineering, 116, 61–75. doi:10.1016/j.compositesb.2016.12.058.
- Gea-Izquierdo, G., Pastur, G. M., Cellini, J. M. and Lencinas, M. V. (2004) Forty years of silvicultural management in southern Nothofagus pumilio primary forests. Forest Ecology and Management, 201 (2–3), 335–347. doi:10.1016/j.foreco.2004.07.015.
- Hothorn, T., Bretz, F. and Westfall, P. (2008) Simultaneous inference in general parametric models. Biometrical Journal, 50 (3), 346–363. doi:10.1002/bimj.200810425.
- Inoue, M., Norimoto, M., Tanahashi, M. and Rowell, R. (1993) Steam or heat fixation of compressed wood. Wood and Fiber Science, 25 (3), 224–235.
- Kamke, F. A. (2006) Densified radiata pine for structural composites. Maderas-Ciencia y Technologia, 8 (2), 83–92. doi:10.4067/s0718-221×2006000200002.
- Kamke, F. A. and Sizemore, H. 2008. Viscoelastic thermal compression of wood. United States Patent No. 7.404.422.
- Kutnar, A., Kamke, F. A. and Sernek, M. (2008) The mechanical properties of densified VTC wood relevant for structural composites. European Journal of Wood and Wood Products, 66 (6), 439–446. doi:10.1007/s00107-008-0259-z.
- Kutnar, A., Kamke, F. A. and Sernek, M. (2009) Density profile and morphology of viscoelastic thermal compressed wood. Wood Science and Technology, 43 (1), 57–68. doi:10.1007/s00226-008-0198-1.
- Kutnar, A., Sandberg, D. and Haller, P. (2015) Compressed and moulded wood from processing to products – a review. Holzforschung, 69 (7), 885–897. doi:10.1515/hf-2014-0187.
- Kuznetsova, A., Brockhoff, P. B. and Christensen, R. H. B. (2016) lmerTest: Tests in linear mixed effects models. R package version 2.0-33. Accessed 10 June 2017, available at: https://CRAN.R-project.org/package=lmerTest
- Lenth, R. V. (2016) Least-squares means: The R package lsmeans. Journal of Statistical Software, 69 (1). doi:10.18637/jss.v069.i01.
- Lewis, W. C. (1968) Hardness modulus as an alternative measure of hardness to the standard Janka ball for wood and wood-base materials. U.S. Forest Service Research Note, FPL-0189.
- Navi, P. and Girardet, F. (2000) Effects of thermo-hydro-mechanical treatment on the structure and properties of wood. Holzforschung, 54 (3), 287–293. doi:10.1515/hf.2000.048.
- Navi, P. and Heger F (2004) Combined densification and thermo-hydro-mechanical processing of wood. Material Resource Society Bulletin, 29 (5), 332–336. doi:10.1557/mrs2004.100.
- Nilsson, J., Johansson J., Kifetew G. and Sandberg D. (2011) Shape stability of modified engineering wood product subjected to moisture variation. Wood Material Science and Engineering, 6 (3), 132–139. doi:10.1080/17480272.2011.552122.
- Pastur, G. M., Lencinas, M. V., Cellini, J. M., Peri, P. L., and Soler, E. R. (2009) Timber management with variable retention in Nothofagus pumilio forests of Southern Patagonia. Forest Ecology and Management, 258 (4), 436–443. doi:10.1016/j.foreco.2009.01.048.
- Puettmann, K. J., Wilson, S. M., Baker, S. C., Donoso, P. J., Drössler, L., Amente, G., Harvey, B. D., Knoke, T., Lu, Y., Nocentini, S., Putz, F. E., Yoshida, T. and Bauhus, J. (2015) Silvicultural alternatives to conventional even-aged forest management – what limits global adoption? Forest Ecosystems, 2(8). doi:10.1186/s40663-015-0031-x.
- R Core Team (2017) R: A Language and Environment for Statistical Computing. Version 3.4.1. R Foundation for Statistical Computing, Vienna, Austria, available at: https://www.R-project.org/
- Rautkari, L., Properzi, M., Pichelin, F. and Hughes, M. (2010) Properties and set-recovery of surface densified Norway spruce and European beech. Wood Science and Technology, 44 (1), 679–691. doi:10.1007/s00226-009-0291-0.
- Rautkari, L., Kamke, F. A. and Hughes, M. (2011) Density profile relation to hardness of viscoelastic thermal compressed (VTC) wood composite. Wood Science and Technology, 45 (4), 693–705. doi:10.1007/s00226-010-0400-0.
- RStudio Team (2017) RStudio: Integrated Development for R. Version 1.0.153. RStudio, Inc., Boston, MA. available at: http://www.rstudio.com/
- Seborg, R., Millet, M. and Stamm, A. (1945) Heat-stabilized compressed wood (Staypak). Mechanical Engineering, 67 (1), 25–31.
- Suchsland, O. (2004) The Swelling and Shrinking of Wood: a Practical Technology Primer (Madison, WI: Forest Products Society).
- Ugovšek, A., Kamke, F. A., Sernek, M., Pavlič, M. and Kutnar, A. (2013) The wettability and bonding performance of densified VTC beech (Fagus sylvatica L.) and Norway spruce (Picea abies (L.) Karst.) bonded with phenol-formaldehyde adhesive and liquefied wood. European Journal of Wood and Wood Products, 71 (3), 371–379. doi:10.1007/s00107-013-0669-4 doi: 10.1007/s00107-013-0681-8
- Wickham, H. (2009) ggplot2: Elegant Graphics for Data Analysis (New York: Springer Verlag). doi:10.1111/j.1541-0420.2011.01616.x.