
 ?Mathematical formulae have been encoded as MathML and are displayed in this HTML version using MathJax in order to improve their display. Uncheck the box to turn MathJax off. This feature requires Javascript. Click on a formula to zoom.
ABSTRACT
A timber bridge constructed in 1815 was renovated in 2018, wherein the load-bearing system was reinforced with beech laminated veneer lumber (LVL) elements. Beech LVL is primarily found in dry and heated structures (Service Class 1). Although the material of this bridge would not be directly exposed to weather, it would be exposed to outdoor relative humidity ranging between 50% in spring and 90% or higher in autumn (Service Class 2). Thus, the moisture content development in the reinforcements was monitored to observe the response of the material under such conditions. The moisture content was measured using both sorptive and electrical resistance methods. The relationship between the electrical resistance of the material to moisture content and sorption isotherms was determined through laboratory experiments. Thereafter, the derived relationships were used to determine the moisture content measured on the bridge over a period of two years. Consequently, the two measurement methods resulted in overlapping of moisture content values, which remained within safe levels and are expected to be maintained in future. The overlapping moisture content measurements validated that either of the monitoring methods could be independently deployed to obtain reliable results.
Introduction
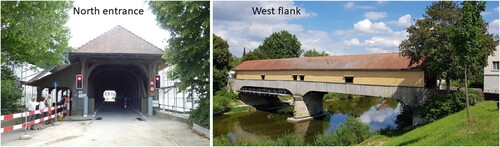
In practice, exposing wood to high relative humidity or water over extended periods of time can lead to fungal growth in wood and subsequent material decay (Jiang et al. Citation2016, Kehl Citation2013). Measuring the moisture content is one of the easiest ways to monitor the quality of a timber structure during its service life. After the repair and reinforcement of the historic Thurbridge of Andelfingen, Switzerland () in 2018, the development of moisture content (MC) was monitored in the installed beech laminated veneer lumber (LVL) load-bearing members to measure the response of the material to exposure to Service Class 2 conditions, as listed in Eurocode 5 (EN Citation1995, Citation2004). The bridge is protected by a roof and shingle cladding, which is a traditional way of ensuring structural longevity and durability (Seidel et al. Citation2019). However, it is uncommon to use beech in load-bearing applications of bridge structures (Augenstein et al. Citation2000) perhaps due to its low natural durability (EN 350-2 Citation1994). Notwithstanding, the use of this relatively new material in such an application was considered possible, but its response to high humidity was still unknown.
Figure 1. Historic bridge of Andelfingen after reinforcement and repairs were conducted during summer of 2018 showing the north entrance and the western flank (facing downriver).
Owing to the high degree of homogenization and additional densification of the beech veneer plies, beech LVL (Pollmeier Baubuche) is known for its high load-bearing capacity (Pollmeier Citation2021a). In addition, this wood product is suitable for load-bearing elements in applications requiring high load-bearing capacity with small cross-sections, especially when axial loading is involved (Steige and Frese Citation2019). Moreover, it is graded as the strength class GL75, which is three times stronger than common GL24 softwood-glued laminated timber. Until now, the major applications of beech LVL are limited to indoor environments. Despite the measures conducted to protect timber, the load-bearing elements in bridges are known to risk direct contact with water, either through rain in combination with wind or water spray caused by passing traffic (Mahnert and Hundhausen Citation2018). The densification can be reversed once it is exposed to water (shape memory) (Sandberg and Navi Citation2007).
MC is usually monitored using either electrical resistance or sorption methods (also known as the bore hole method) for ensuring a reliable moisture development measurement of the structure (Dietsch et al. Citation2015a, Li et al. Citation2018). As each of these methods have their own advantages and disadvantages, both are sometimes installed simultaneously (Franke et al. Citation2019). MC monitoring equipment for both methods was installed in the bridge structure directly after the reinforcements were put into place. However, at the time of installation, neither the relationships between electrical resistance and MC nor the mathematical relationships describing the sorptive behavior of beech LVL were known. Wenker and Welling (Citation2017) suggested the use of existing relationships for beech as a temporary solution until concrete relations were available. Sorption isotherms above 20°C are provided in the building physics guideline of Pollmeier Massivholz GmbH & Co (Pollmeier Citation2021b), but their origin was unknown. Hence, relations for beech LVL had to be calibrated through laboratory experiments. These could be used in the analysis of the measurement data obtained from the two-year monitoring campaign. As both methods were implemented, the available data allowed an in-situ comparison between the two methods.
State of the art
Moisture content
The MC u is expressed as a mass percentage (M%) and calculated using the wet and dry masses of wood, mwet and mdry, respectively, as expressed in Equation (1):
(1)
(1)
The dry mass was obtained by drying the wood sample in an oven at 103°C (EN 13183-1 Citation2002). Although the comparison of the wet and dry masses of wood is the most accurate method for measuring the wood MC, it is impractical for continuous monitoring applications. Thus, indirect methods such as the electrical resistance method or sorption method are more suitable for these applications as they are nondestructive; however, they are also less accurate (Skaar Citation1988, Forsén and Tarvainen Citation2000, Dyken and Kepp Citation2010, Dietsch et al. Citation2015a).
Electrical resistance method
The electrical resistance method (EN 13183-2 Citation2002) allows the measurement of resistance at various depths from the surface using electrodes of different lengths, and it relies on the variation of the physical properties of wood based on MC. The resistance between the two pin-type electrodes usually ranges between 100 kΩ and 100 GΩ in the hygroscopic range of wood. However, the uncertainties in measurements are caused by wood species, grain orientation, electrode type (screw or nail), density, and temperature (Skaar Citation1988). Forsén and Tarvainen (Citation2000) studied these uncertainties and concluded that only species and temperature effects must be corrected as the remaining possible measurement errors are insignificant.
Different mathematical relations have been used to relate resistance R (Ω) to MC u. Skaar (Citation1988) mentioned a model in which both R and u are converted to the logarithmic scale. This model will be referred to as Method S hereafter.
(2)
(2)
(3)
(3)
In addition, Forsén and Tarvainen (Citation2000) proposed another model to establish relationships between resistance and MC. The authors used resistance R in units of MΩ, which has been accounted for in Equation (4) to maintain consistency with the unit Ω used in Equation (2). The suggested model will be hereafter referred to as Method F.
(4)
(4)
(5)
(5)
(6)
(6)
Despite the larger inaccuracies in comparison to the oven-dry method, the electrical resistance method has proven to be practical in long-term monitoring campaigns for measuring leakages in bridge decks, moisture gradients in timber load-bearing elements, and structural components exposed to weather (Brischke et al. Citation2008, Franke et al. Citation2014, Dietsch et al. Citation2015b, Niklewski Citation2018).
To the best of our knowledge, no guidelines on sample size for determining the relationship between the electrical resistance and MC in laboratory experiments exist. In context, Skaar (Citation1988) suggested that the sample size should allow an adequate amount of material to surround the electrodes. Fredriksson et al. (Citation2015) stated that exceedingly small samples result in a systematic underestimation of MC during measurements and experiments on large structures. Numerical simulations reveal that for a sample size approximately corresponding to three times the electrode distance, systematic errors remain below 0.3 M%, immediately under the fiber saturation point of wood.
Sorption method
In the sorption or bore hole method, the climate in a cavity is measured instead of a physical property (Dietsch et al. Citation2015a). The relative humidity and temperature measured in a small cavity were converted into MC using sorption isotherms (ISO 12571 Citation2013). Keylwerth and Noack (Citation1964) presented established sorption isotherms as well. Moreover, both adsorption and desorption processes can be used, as utilized by Rijsdijk and Laming (Citation1994) and Patera et al. (Citation2016). Rode and Clorius (Citation2004) and Melin et al. (Citation2016) described a methodology to set up humidity-and temperature-dependent adsorption and desorption planes for a temperature range of −12°C to 50°C. Sorption models such as the Hailwood–Horrobin model can be employed for developing mathematical equations (Simpson Citation1973, Skaar Citation1988). Notably, the theoretical equilibrium MC u can be calculated based on the relative humidity h and parameters x1, x2, and x3.
(7)
(7)
Furthermore, the sorption method has been popularly used in long-term MC monitoring of timber bridges in Norway (Dyken and Kepp Citation2010). Melin et al. (Citation2016) used this method to monitor the MC development for the preservation of historic wooden art.
Comparison between electrical resistance method and sorption method
The sorption method is advantageous over the electrical resistance method as it provides better control of measurement depth and a higher measurement accuracy (Melin et al. Citation2016). In addition, this method can be used to measure the MC in environments such as salt domes, where the salt potentially affects the resistive properties of timber (Dietsch et al. Citation2015a). On the contrary, the electrical resistance method is not recommended in case the monitored element is exposed to subfreezing temperatures for extended periods of time (Fortino et al. Citation2016), however, the sorption method can (Dyken and Kepp Citation2010).
The advantage of the electric resistance method is that it is more robust and can be used in the over-hygroscopic range (Li et al. Citation2018). However, Niklewski (Citation2018) stated large uncertainties and inaccurate MC measurements when using the electrical resistance methods in the over-hygroscopic range. Thus, in engineering practice, the electrical resistance method is considered unreliable in this range.
Although not explicitly stated in related literature, another advantage of the sorption method is that it is unaffected by the conductivity of additional materials such as adhesives. In context, resorcin formaldehyde and melamine formaldehyde conduct electricity but polyurethane adhesives do not, which can result in significant errors in the MC measurements of glued laminated timber (Tschuck and Schmid Citation2012). Uncertainties caused by grain orientation do not affect the measurement either.
Furthermore, the electrical resistance method allows immediate measurement of MC once the electrodes are hammered into wood. However, stabilization of the climate and an airtight cavity are required before the MC can be calculated using the sorption method.
Material and methods
Electrical resistance, sample size, and equipment
Five beech LVL elements of 2000 mm × 200 mm × 200 mm (length × width × height) were supplied by Pollmeier Massivholz GmbH & Co. These elements were machined to form samples of 80 mm × 80 mm × 40 mm, which were pre-climatized in climate chambers above saturated salts at a relative humidity ranging from 30–93%. Before evaluating the relationship between MC and resistance, the samples were placed in a climate chamber (Feutron® 400, Feutron Klimasimulation GmbH, Germany) in a constant climate until the mass variation was below 0.1 M% for more than 24 h. Thereafter, the influence of temperature on the resistance was measured by varying the temperature at a constant relative humidity.
Three partially insulated pin-type electrodes (Gann Mess- u. Regeltechnik GmbH, Germany) were inserted into each sample prior to performing the climatization in the climate chamber. These electrodes were inserted such that the resistance transverse (R⊥) to the grain and that along (R∥) the grain could be measured on a single sample (). However, the sample resistances in these two directions were connected to two different channels on the measuring equipment. Hence, resistances were not simultaneously measured. In addition, the holes for the 4.0 mm diameter electrodes were pre-drilled with a 3.5 mm drill. In softwood, holes for the electrodes are usually predrilled with a 3.0 mm diameter drill (Dietsch et al. Citation2015b, Franke et al. Citation2019); the distance between the electrodes was 30 mm. By predrilling the holes for electrodes with a smaller diameter than the electrode outer diameter, sufficient contact pressure between the wood and electrode was ensured throughout the measurements. Screws guarantee better contact pressure with wood for long term, but no factory-made product is available, and these must be tailor made.
Figure 2. Sample setup for determining relationship between resistance in various material directions and moisture content in wood.
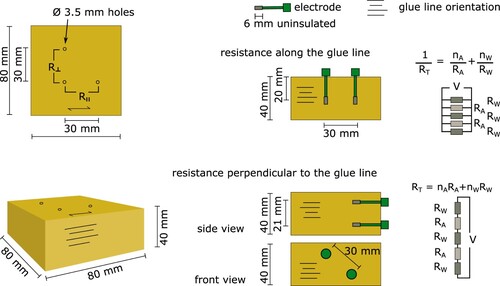
The relationship between the MC and resistance was primarily measured parallel to the orientation of the veneers/glue lines. As each veneer is approximately 3 mm thick, and the uncoated tip of the partially insulated electrodes is 6 mm long, the total resistance of the LVL was affected by two to three separate veneers or glue lines (). Thus, the total resistance RT between the electrodes was interpreted as a set of parallel-connected resistances of RA and RW, representing the resistance of the adhesive and wood times the number of layers nA and nW, respectively.
(8)
(8)
For the resistance measured perpendicular to the veneers and glue lines, the total resistance could be interpreted as a set of resistances connected in series ().
(9)
(9)
The resistance perpendicular to the veneers and glue lines was measured at a temperature of 20°C and relative humidity of 65%. The electrode pair was placed at 45° to the adhesive line (Franke et al. Citation2019).
The total mass of each sample, i.e. wood and electrodes, was measured regularly using a scale (Mettler-Toledo International Inc., United States of America) with a precision better than 0.1% of the sample mass. After completing the climatization and measurements, the electrodes were removed, and the sample mass (without electrodes) was further determined. The mass of the inserted electrode melectrodes was subtracted from the total mass mtotal measured during climatization to derive the mass of the sample mwet as follows:
(10)
(10)
The MC of the wood samples throughout the climatization was later determined using the oven-drying method (EN 13183-1 Citation2002).
The resistance between the inserted electrodes was measured using a Gigamodul (Scanntronik Mugrauer GmbH, Germany), the accuracy of which was determined by connecting it to four stock resistances in the range of interest for the measurements. Consequently, the maximum average inaccuracy of 15% was greater than a resistance of 10 GΩ. In terms of MC, the maximum average inaccuracy was derived later, resulting in an error of 0.15 M%. Furthermore, an error of less than 1% was measured for resistances below 10 GΩ.
Parameters for both Method S and method F are determined using the above-mentioned measurements, along and transverse to the grain, and in different temperatures too. The coefficient of determination is used to determine the quality of the fit. Also, differences between measurements along and transverse to the grain orientation are investigated in detail.
Measurement of sorption isotherms
Samples of 40 mm × 40 mm × 40 mm were machined from the supplied beech LVL elements to measure the sorption isotherms according to ISO 12571 (Citation2013). The samples were first dried and subsequently climatized in a climate chamber (Feutron® 400, Feutron Klimasimulation GmbH, Germany) until a mass convergence of 0.1 M% was achieved. The five various climates used to climatize the samples were measured using an Elprolog TH1 (ELPRO-BUCHS AG, Switzerland) climate sensor with an accuracy of 2%. In addition, the oven-dry weight was measured after climatization. The parameters x1 to x3 were solved by rewriting Equation (7) as Equation (11) with Gaussian elimination (Schiere et al. Citation2017). As the MC was measured in more conditions than the number of available parameters, a least-squares fit was used for the solution.
(11)
(11)
The parameters required for employing Methods S and F in the electrical resistance method were calculated in a similar manner.
In situ measurements on bridge in Andelfingen
The historic bridge of Andelfingen was originally built in 1814/1815 after a fleeing army set fire to its predecessor in 1799. The single-lane bridge has a total length of 64 m divided over two spans and allows traffic loads of up to 16 tons. The road deck is carried by a hanging-truss frame structure (). In 1979, an additional arch bridge was placed on the eastern side of the bridge for pedestrians and cyclists (Staldemann Citation1990). The reinforcement efforts in 2018 included the addition of two portal frames per span, i.e. one frame at the north entrance, two at the center, and one at the south entrance. These reinforcements, among others, were performed using beech LVL, and the portal frame was coated with an oil-based varnish, as depicted in .
Figure 3. Bridge dimensions and structure (top) Staldemann (Citation1990) (courtesy of Desertina Verlag und Logistik AG Chur, Switzerland); main load bearing structure and added frames.
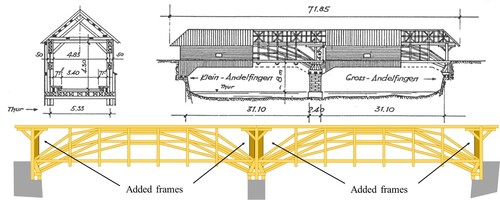
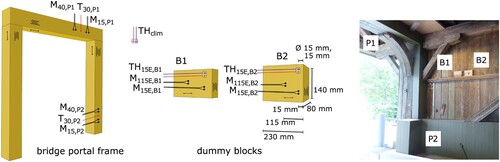
Figure 4. Instrumentation of portal frame (P) and dummy blocks (B) along with climate measurement equipment. Symbol M represents sensor for moisture content, T for temperature, and TH for a climate sensor (left); the number following the symbol describes the depth of measuring point. Instrumented frame is present on right-hand side.
The purpose of the measurements was to observe the developments of MC in the reference locations. As the equipment manufacturer recommended maximum cable lengths between sensors and loggers as 10 m, MC was only monitored in one frame. In the northern part of the structure, more severe conditions were expected, i.e. higher relative humidity, than in the southern part. As sunlight could possibly enter the bridge in the southern entrance, a temporary increase of temperature could have occurred, affecting the moisture content locally. This could, however, not be verified extensively.
The measuring instruments on the portal frame of the bridge were placed on both the horizontal beam (P1) and vertical column (P2) (). At each location, electrode pairs with 15 mm (M15) and 40 mm (M40) lengths were installed to facilitate measurements at various depths, wherein the electrodes measured the resistance along the grain (and along the glue line). The temperature was measured at a depth of 30 mm to allow temperature compensation of the measured resistance. Overall, the portal frame was instrumented with four MC sensors and two temperature sensors. Location P2 on the portal frame was located behind the splashboards.
Furthermore, two uncoated dummy blocks (B1 and B2) of 230 mm length and 80 mm thickness were installed adjacent to the northernmost portal frame. Both the sorptive (TH) and electrical resistance methods (M) were installed alongside each other to facilitate a direct comparison of the measured MC. One 40-mm-long electrode pair was installed 15 mm from the end grain (M15E), accompanied by a climate sensor (CMOS, accuracy of relative humidity 3%, Scanntronik Mugrauer GmbH, Germany) in a cavity of 15 mm diameter and 15 mm length (TH15E). Moreover, an additional electrode pair of length 40 mm was installed in the middle of the dummy block at 115 mm from the end grain (M115E). The temperature compensation required for the resistance was obtained from the CMOS climate sensors (TH15E) based on capacitive technology, which makes them less sensitive to drift and show good recovery from condensation compared to the use of hygro-sportive polymers for the measurement of relative humidity. The sensors were factory calibrated. Lastly, the bridge climate (THclim) was measured as well. All measurements were logged every 3 h.
Results
Conversion of electrical resistance to moisture content
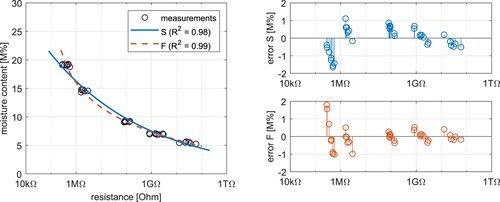
Electrical resistances and the corresponding MCs were utilized to fit the parameters of Methods S and F. The measurements perpendicular to the grain at 20°C are discussed first in , wherein the coefficients of determination representing the fits to Methods S and F are listed in the legend. As can be observed from the residuals of Methods S and F presented in , the use of Method S underestimated the actual MC by 1 M% below 1 MΩ and systematically overestimated the MC between 1 MΩ and 1 GΩ. Thus, Method F is more accurate than Method S. In addition, indicates that the accuracy of Method F decreased dramatically around 20 M% owing to the steep gradient of the fit equation in this range of MC.
Figure 5. Comparison of measured data with two fitting Methods S and F and residuals at various resistances measured transverse to the grain at 20°C.
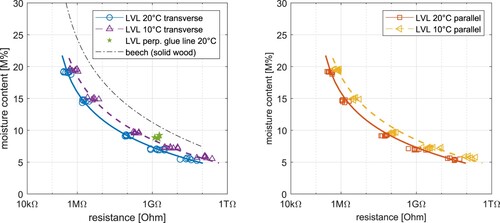
The resistances measured in the two different temperatures and material directions were compared to the fit of Method F. (left) presents the measurements conducted in various material directions of the beech LVL samples at 10°C and 20°C. The large difference between the readings of 10–20°C indicated the requirement for temperature correction. Moreover, the calibration curve for beech (solid wood) measured by Forsén and Tarvainen (Citation2000), and the resistance measured perpendicular to the glue line at a relative humidity of 65% or 9 M% are depicted in . The resistance of the latter varied by a factor of 15 as compared to the measurement parallel to the glue line and displayed an error of 3.5 M% in MC. Even though the material resistance dropped because of the adhesive, a strong dependency of the electrical resistance on the MC was observed.
Figure 6. Comparison of measured and fit data in transverse and parallel directions to grain at 10°C and 20°C.
The temperature-dependent parameters (T in °C) for Methods S and F are listed in . In addition, the coefficient of determination indicated that the Method F yielded a more accurate fitting curve for the measurements than Method S.
Table 1. Calculation of temperature dependent parameters for various fitting methods.
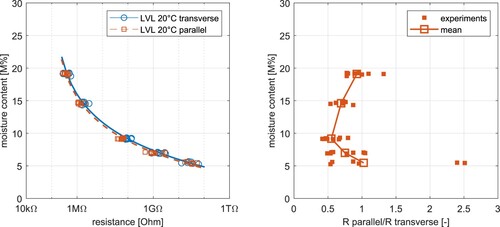
As portrayed in , the deviations between the resistances measured parallel and perpendicular to the grain were small because the parameters to fits were similar. Thereafter (), the ratios between these measurements were added (Rparallel/Rtransverse). The resistance along the grain was approximately half of that measured transverse to the grain at a MC of approximately 10 M%, which resulted in a deviation of 0.49 M% upon conversion to MC. Above and below this limit, the variation between the resistances measured in the two material directions further decreased and averaged to a ratio of 1, signifying that such variations were only relevant in a MC of 10–15 M%, which was exactly in the range corresponding to the MC measurements on the bridge. This further indicated that the conductivity of the adhesive did not dominate the total resistance of the beech LVL.
Figure 7. Comparison of resistance measured parallel and transverse to the grain and their calculated ratio of resistance on each individual sample.
Determined sorption isotherms
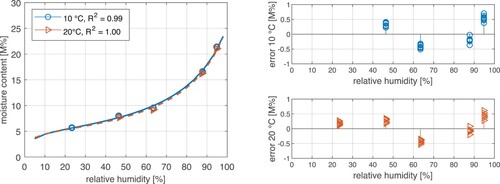
The measured relationship between relative humidity and MC is presented in , where the circular and triangular markers represent measurements recorded at a temperature of 10°C and 20°C, respectively. These measurements exhibited small deviations between 0.2 and 0.3 M%. In addition, the parameters expressed in Equation (7) were derived as x1 = – 0.014·T + 0.604, x2 = 0.122·T + 18.295, and x3 = – 0.107·T – 14.974. Based on the range of relative humidity, the MC was either over- or underestimated by a maximum of 0.5 M%.
Figure 8. Measured sorption isotherms and the fitted mathematical relation along with the residuals at two different temperatures.
Measured climate on Thurbridge
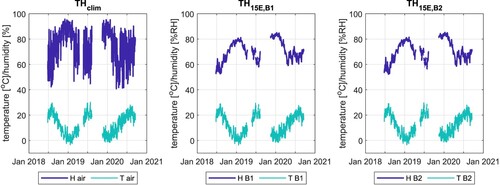
The temperature and relative humidity (THclim) of air measured since the initiation of the monitoring campaign are presented in , in which the middle and right plots depict the relative humidity and temperature measured in the two bore holes, TH15E,B1 and TH15E,B2, of dummy blocks B1 and B2, respectively. Moreover, the minimum and maximum temperatures ranged between –3°C and 30°C, and the highest relative humidity of the air was measured in autumn/winter. The relative humidity in the cavities of B1 and B2 adjusted slowly to that of air, and the average relative humidity THclim measured over two years was 75.5%. Furthermore, the relative humidity measurements of TH15E,B1 and TH15E,B2 displayed minimal differences of ±0.5%. The monitoring data shows two blind spots representing unmeasured data.
Figure 9. Air temperature (T) and humidity (H) measurements from sensors at THclim, TH15E,B1 and TH15E,B2.
Moisture contents in portal frames and dummy blocks
The MC developments at the four instrumented locations P1, P2, B1, and B2 are plotted in for both the electrical resistance (M, both depths) and sorption method (RH on the dummy blocks, 15 mm depth). The top and bottom plots represent the MC calculated in the frame and dummy blocks, respectively.
Figure 10. Measurement of moisture content in four instrumented locations. Top row: plots of moisture content measured in frame. Bottom row: moisture content developments in two dummy blocks and a comparison between electrical resistance M and sorption method TH.
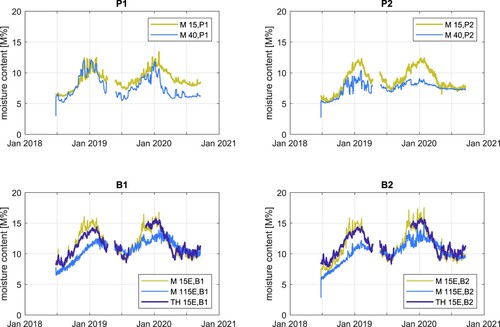
For M15,P1 and M15,P2 in the frames, the MC increased from around 6–7.5 M% during July 2018 to July 2019, and thereafter, increased to 8 M% in July 2020. The MC at the depth of 40 mm remained lesser than that measured at a depth of 15 mm, indicating that the deeper sections of the beam were yet to achieve the equilibrium MC. Notably, the maximum MCs at locations M15,P1 and M15,P2 remained between 11.5 and 12.0 M% both in January 2019 and January 2020.
The MC in the dummy blocks measured at M15E,B1 and M15E,B2 increased from approximately 8–9 M% from July 2018 to July 2019 and subsequently maintained that level in July 2020. On average, the MC in the dummy blocks was approximately 2 M% higher than that in the frame, plausibly because it was not coated as the frame. The maximum MC measured in the dummy blocks remained between 15.0 and 15.5 M% in the winters of 2019 and 2020. At locations M115E,B1 and M115E,B2 MC attained a maximum MC of only 13.3 M% in both the winters. Moreover, the MC measured using the electrode pair at 155 mm from the end grain displayed a gradual variation in the MC throughout the year.
In situ differences between electrical resistance method and sorption method in dummy blocks
The variation between the MCs measured through the electrical resistance method M115E,B1 and the sorptive method TH115E,B1 at B1 and B2 are compared in (left and middle). The upper and lower 5% and 25% quantiles were plotted for all the 6000 points along with the median of the variation as a function of the temperature at which the MCs were measured. The results indicated smaller deviations during summer (higher temperatures) than that in winter (low temperatures). The right-hand side diagram of depicts both the 50% quantiles of blocks B1 and B2 along with the histogram (as a relative value) of temperatures.
Figure 11. Direct comparison of moisture content measured with electrical resistance (M) and sorption method (TH) along with variation between two 50% quantiles; left: histogram of temperature measurements and comparison of the two 50% quantiles.
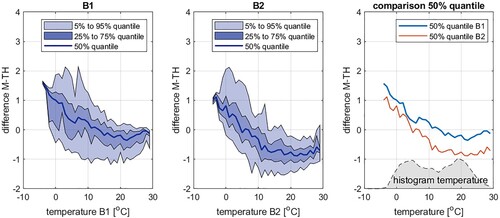
Furthermore, the variation between the two monitoring methods was larger in B1 and B2 (0 M% and 0.5 M%, between 10°C and 30°C). As the temperature decreased, the deviations in the measured MC increased up to 1 M% at 5°C and 2 M% at 0°C. Moreover, statistical analysis revealed that 56% of the measurements were conducted above 10°C, 26% performed under 5°C, and only 5% performed below 0°C. Although the deviation of 2 M% was large in comparison to the remaining measurements, this occurred infrequently.
Discussion
Electrical resistance methods
The temperature dependency of the electrical resistances was measured at two temperatures, resulting in a linear temperature correction of the measured MC. Forsén and Tarvainen (Citation2000) used a logarithmic relationship in this context. The selection range of the temperatures covered more than half of the measurements, but the laboratory-grade climate chamber could not control a relative humidity at less than 10°C. In addition, an inaccurate temperature correction below 10°C potentially caused the observed deviations between the in-situ measurements recorded by the two methods at 0°C.
The mathematical relationship between the resistance and MC proposed by Forsén and Tarvainen (Citation2000) more suitably fitted the experimental values than that suggested by Skaar (Citation1988). However, Li et al. (Citation2018) determined a satisfactory overlap with the latter’s proposed relationship. The fit is material-related and therefore, the range of validity and possible errors constitute relevant information for the future publication of curves fitting resistance with MC.
The variation between the calibration curves of beech and beech LVL suggested that the resistance of the latter was largely affected by the (phenol-based) adhesive. Furthermore, the variation in the electrical resistances along and transverse to the grain presented in signified that the wood resistance itself is still an essential component of the total measured resistance.
Very recently, Grönquist et al. (Citation2021) compared the results presented here to own experimental results. There, the calibration between moisture content and electrical resistance was determined, too. However, these experiments focused more on the measurement of MC in indoor climate. Nevertheless, both calibration curves show a good overlap.
Sorptive methods
The adsorption process was weakly influenced by temperature. Although Kelsey (Citation1957) observed a small but inverse relationship of MC with temperature, Melin et al. (Citation2016) did not consider this in their study. In highly varying climates, Rode and Clorius (Citation2004) recommend employing an average relation between adsorption and desorption, which could comprise a possible extension of the experiments presented in this study. The long-term data could be compared again using the adsorption and desorption curves in combination with hysteresis analysis.
The monitored elements were drilled with holes of 15 mm diameter. The size was driven by that of the humidity sensors connected to the monitoring equipment. A smaller humidity sensor facilitates better control of the depth and volume of the cavity. Furthermore, the climate sensors can become sensitive to drift, especially when exposed to high relative humidity or condensation over extended periods of time. Thus, an exchangeable sensor will be beneficial for maintaining long-term monitoring efforts, as the existing sensors on the bridge are not exchangeable.
Monitoring on bridge
The sorptive and electrical resistance methods displayed adequate fitness with deviations of 0 and 0.5 M% above 10°C on blocks B1 and B2, respectively. This variation was potentially caused by the spread in the electrical resistance method and accuracy of the temperature compensation. Moreover, the variation in these two methods can be further attributed to the accuracy of the monitoring equipment and sensors. The present authors believe that the successful overlapping could be partially caused by the minimal impact of external heat sources such as exposure to sun. Dyken and Kepp (Citation2010) expressed concern regarding (unrealistic) variations in MC the sorption method.
The observations of the dummy blocks indicate large enough size of specimens used to establish the calibration between electrical resistance and MC, i.e. the electrical resistance method did not seem to systematically underestimate the MC, as investigated by Fredriksson et al. (Citation2015). Once adsorption and desorption curves are determined, this could also be investigated better.
Conclusions and outlook
This study presented the relationship between the MC and electrical resistance and hygrosorptive properties of beech LVL. The determined mathematical relations could successfully be used to analyze and compare the measurements in the reinforcements in the historic Thurbridge in Andelfingen, Switzerland. In addition, the adequate fitness between the electrical resistance and sorption methods employed for acquiring measurements on the bridge demonstrated that either method can be individually deployed for obtaining reliable results in the future. Moreover, the influence of temperature on the MC could be determined for a larger temperature range to ensure higher reliability of the measurements. However, typical climate chambers pose limitations in regulating relative humidity near 0°C, and similar measurements for a regular wood such as spruce are rare (Rode and Clorius Citation2004).
Therefore, each measurement method has its own set of advantages and disadvantages. A comparative analysis of the electrical resistance and sorption methods yielded the following conclusions.
MC monitoring methods relied on the quality of available conversion data and validity of the temperature range and accuracy of the recording equipment.
The accuracy of the resistance method depended on the measured MC: MCs below 15 M% displayed an error lesser than 1.0 M% and further down to 0.5 M% at lower MCs. The sorption method could produce errors of up to 0.5 M% over the entire range of relevant relative humidity, as illustrated in and .
The variations in results obtained on the dummy blocks above 10°C were potentially influenced by the measurement accuracy of both the methods, whereas the temperature compensation must be adjusted below 10°C in both methods. As depicted in , large deviations of > 1.0 M% at 0°C occurred at 5% of the measurements, which can be considered as infrequent.
An adequately large sample size was used to determine the relationship between the MC and electrical resistance.
The most vital advantage of the sorption method is that it does not comprise errors impacting the resistance measurement, such as grain orientation, material irregularities, or the presence of a bond line. However, the airtightness is required.
After one year, the MC of the coated elements in the bridge did not exceed 12 M%. Moreover, the average equilibrium MC calculated from the relative humidity of the air (75.0%) was derived to be 12 M%. Therefore, the maximum MC in winter can increase further with time, but the deeper sections are yet to achieve the average equilibrium MC. The uncoated dummy elements exhibited a maximum MC of 15.5 M% in the winter of the second year, and the MC at the center of the dummy blocks could increase as well. Thus, continuous monitoring of the MC is recommended, including expansion to additional locations. In context, any of the two discussed methods can be used.
To date, the monitored beech LVL elements have delivered appropriate performance in outdoor operating conditions. In case other elements were not exposed to free water or condensate, the implemented reinforcements are expected to deliver long-term adequate performance.
Acknowledgements
The road authority of the Kanton of Zurich is especially acknowledged for allowing measurements on the historic bridge of Andelfingen, Switzerland. The authors are grateful to Pollmeier GmbH & Co for supplying the beech veneer material for laboratory experiments. WaltGarmarini AG is also acknowledged for supporting the monitoring campaigns through planning efforts. The industry partners and research partners, Technical University of Munich and Lund University, are additionally acknowledged for their support toward this project.
Disclosure statement
No potential conflict of interest was reported by the author(s).
Data availability statement
Raw data were generated at Bern University of Applied Sciences. Derived data supporting the findings of this study are available from the corresponding author M.S. on request.
Additional information
Funding
References
- Augenstein, M., Dittrich, W. and Goehl, J. (2000) Details für Holzbrücken. In Holzbau Handbuch (Series 1, Part 9, Issue 2) (Bonn: Informationsdienst Holz).
- Brischke, C., Rapp, A. O., Bayerbach, R., Morsing, N., Fynholm, P. and Welzbacher, C. (2008) Monitoring the “material climate” of wood to predict the potential for decay: Results from in situ measurements on buildings. Building and Environment, 43, 1575–1582.
- Dietsch, P., Franke, S., Franke, B., Gamper, A. and Winter, S. (2015a) Methods to determine wood moisture content and their applicability in monitoring concepts. Journal of Civil Structural Health Monitoring, 5, 115–127.
- Dietsch, P., Gamper, A., Merk, M. and Winter, S. (2015b) Monitoring building climate and timber moisture gradient in large-span timber structures. Journal of Civil Structural Health Monitoring, 5, 153–165.
- Dyken, T. and Kepp, H. (2010) Monitoring the moisture content of timber bridges. In 1st International Conference of Timber Bridges (Lillehammer, Norway), pp. 223–235.
- EN 350-2 (1994) Durability of Wood and Wood-Based Products – Natural Durability of Solid Wood – Part 2: Guide to Natural Durability and Treatability of Selected Wood Species of Importance in Europe (Brussels: European Committee for Standardization).
- EN 1995-1-1 (2004) Eurocode 5. Design of Timber Structures – Part 1-1: General – Common Rules and Rules for Buildings (Brussels: European Committee for Standardization).
- EN 13183-1 (2002) Moisture Content of a Piece of Sawn Timber – Part 1: Determination by Oven Dry Method (Brussels: European Committee for Standardization).
- EN 13183-2 (2002) Moisture Content of a Piece of Sawn Timber – Part 2: Estimation by Electrical Resistance Method (Brussels: European Committee for Standardization).
- Franke, B., Franke, S. and Müller, A. (2014) Case studies: Long-term monitoring of timber bridges. Journal of Civil Structural Health Monitoring, 5, 195–202.
- Franke, B., Franke, S., Schiere, M. and Müller, A. (2019) Quality Assurance of Timber Structures – Research Report (Bern University of Applied Sciences). ISBN 978-3-906878-04-1).
- Forsén, H. and Tarvainen, V. (2000) Accuracy and Functionality of Hand-Held Wood Moisture Content Meters. Technical Research Centre of Finland, VTT Publications 420 (Espoo).
- Fortino, S., Hradil, P., Genoese, A., Genoese, A., Pousette, A. and Fjellström, P. A. (2016) A multi-Fickian hygro-thermal model for timber bridge elements under Northern European climates. WCTE 2016 Conference Proceedings (Vienna, Austria).
- Fredriksson, M., Claesson, J. and Wadsö, L. (2015) The influence of specimen size and distance to a surface on resistive moisture content measurements in wood. Mathematical Problems in Engineering, 2015, Article ID 215758.
- Grönquist, P., Weibel, G., Leyder, C. and Frangi, A. (2021) Calibration of electrical resistance to moisture content for beech laminated veneer lumber “BauBuche S” and “BauBuche Q”. MDPI Forests, 12, 635.
- ISO 12571 (2013) Hygrothermal Performance of Building Materials and Products – Determination of Hygroscopic Sorption Properties. International Organization for Standardization.
- Jiang, Y., Dietsch, P. and Winter, S. (2016) Agricultural buildings with timber structure – preventative chemical wood preservation inevitably required? WCTE 2016 Conference Proceedings, Vienna, Austria.
- Kehl, D. (2013) Feuchtetechnische Bemessung von Holzkonstruktionen nach WTA. HOLZBAU, 6, 24–28.
- Kelsey, K. (1957) Sorption of water vapour by wood. Australian Journal of Applied Sciences, 8, 42–54.
- Keylwerth, R. and Noack, D. (1964) Kammertrocknung von Schnittholz. Holz als Roh- und Werkstoff, 22, 29–36.
- Li, H., Perrin, M., Eyma, F., Jacob, X. and Gibiat, V. (2018) Moisture content monitoring in glulam structures by embedded sensors via electrical methods. Wood Science and Technology, 52, 733–752.
- Mahnert, K. and Hundhausen, U. (2018) A review on the protection of timber bridges. Wood Material Science & Engineering, 13, 152–158.
- Melin, C., Gebäck, T., Heintz, A. and Bjurman, J. (2016) Monitoring dynamic moisture gradients in wood using inserted relative humidity and temperature sensors. e-Preservation Science, 13, 7–14. 1581-9280 (eISSN).
- Niklewski, J. (2018) Durability of timber members: Moisture conditions and service life assessment of bridge detailing. Dissertation Lund University, Sweden.
- Patera, A., Derluyn, H., Derome, D. and Carmeliet, J. (2016) Influence of moisture hysteresis on moisture transport in wood. Wood Science and Technology, 50, 259–283.
- Pollmeier (2021a) Beispiele für die Anwendung der BauBuche im Holzbau. Accessed 9 March 2021, available at: https://www.pollmeier.com/de/referenzen.html.
- Pollmeier (2021b) Baubuche, Bauphysik 03, Accessed 9 March 2021, available at: https://www.pollmeier.com/de/downloads-im-ueberblick.
- Rijsdijk, J. and Laming, P. (1994) Physical and Related Properties of 145 Timbers (Dordrecht: Spinger).
- Rode, C. and Clorius, C. (2004) Modelling of moisture transport in wood with hysteresis and temperature dependent sorption characteristics. In Performance of Exterior Envelopes of Whole Buildings, IX: International Conference, Oak Ridge, TN, USA.
- Sandberg, D. and Navi, P. (2007) Introduction to Thermo-Hydro-Mechanical Wood Processing. School of Technology and Design Reports No. 30 (Växjö: Växjö University).
- Schiere, M., Bosman, T., Derbanne, Q., Stambaugh, K. and Drummen, I. (2017) Sectional load effects derived from strain measurements using the modal approach. Marine Structures, 54, 188–209.
- Seidel, A., Miebach, F. and Osterloff, L. (2019) Entwurf von Holzbrücken. Holzbau Handbuch (Series 1, Part 9, Issue 1) (Bonn: Informationsdienst Holz).
- Simpson, W. (1973) Predicting equilibrium moisture content of wood by mathematical models. Wood and Fiber Science, 5, 41–49.
- Skaar, C. (1988) Wood-Water Relations (Berlin: Springer Verlag). ISBN 3-540-19258-1.
- Steige, Y. and Frese, M. (2019) Study on a newly developed diagonal connection for hybrid timber trusses made of spruce glulam and beech laminated veneer lumber. Wood Material Science & Engineering, 14, 280–290.
- Staldemann, W. (1990) Holzbrücken in der Schweiz: ein Inventar (Chur: Verlag Bündner Monatsblatt). ISBN: 3-905241-04-8.
- Tschuck, P. and Schmid, E. (2012) Holzfeuchtemessung mittels Widerstandsmethode, Projektarbeit 5. Semester, Berner Fachhochschule Biel, Projektarbeit Nr. H/M12/759/12/0.
- Wenker, J. and Welling, J. (2017) Klimaversuche für den Baustelleneinsatz, Bauen mit Holz (Köln: Bruderverlag Albert Bruder GmbH & Co. KG).