
ABSTRACT
This paper presents a unique study to reveal the effect of the mounting system of the linear variable differential transformer (LVDT) on the mechanical property tests of timber materials. This effect has been overlooked in the past but proven to be significant enough that will distort the measurements completely if the displacement is relatively small. The reason for causing this error is because the LVDT is not directly measuring targeting points on a sample, instead, the LVDT is measuring the distance between one point on the stop-end (where the tip rested on) and the holder. The wrong common sense hopes that this point on the stop-end and holder reliably following the movement of the sample points. But this study reveals that it is not always the case with the aid from the photogrammetry method. The messages of this paper are simple but alertly useful and, important: (1) the mounting system and the method of installation of the LVDTs have a significant impact on the actual displacement measurement in a mechanical properties test of timber materials. It should be carefully designed and validated before the actual test; (2) the displacement distribution is not uniform across the timber sample. This should be taken into account when selecting the mounting points of the LVDTs. Testing standards should consider this effect when recommending displacement transducers to be used in a timber-related test.
1. Introduction
Several test methods have been developed and widely used by researchers to evaluate the mechanical properties of timber or timber-based composite materials. Some most commonly used test methods are specified in the current European Standard BS EN 408:2012 (BSI Citation2012) or purpose-developed by researchers for various applications. LVDT is one of the most commonly used instrumentations for calibrating the materials’ mechanical properties, such as compression tests (Faggiano et al. Citation2011, Aicher and Stapf Citation2016), picture frame or diaphragm tests for in-plane shear modulus (Brandner et al. Citation2017, Turesson et al. Citation2020), shear field tests for cross-laminated timber beams (Jeleč et al. Citation2021), etc. In contrast to some of the other tests at the structural element level such as the four-point bending test (Zhang et al. Citation2021), seismic performance test for timber-frame shear walls (White et al. Citation2009), etc., in which the LVDTs are usually measuring a much larger displacement, the LVDTs used in the calibration of materials’ mechanical properties are normally expected to capture a much smaller displacement, thus a small error may lead to significant distortion of the measuring properties. The error normally does not come from the LVDTs as they are calibrated regularly but that doesn’t prevent the errors caused by the design of the mounting system or method of installation for the LVDTs and stop-ends from surfacing. This error will cancel out the advantages of using LVDTs. And dangerously, most of the researchers are normally consider as long as you screw or glue it onto the timber sample, it must be a correct way to install it. Our study has revealed that is not always the case. The LVDT holders and the stop-ends are normally mounted on the surface of the samples. The displacement of the sample surface may not be even and may move in or out of the surface, for example, in a compression test, the surface in the middle may bubble out. The LVDT holders and the stop-ends could be driven to rotate in-/out-of-plane by these differential movements of the sample surfaces where the LVDTs and the stop-ends are mounted on. At the same time, the holder and the step-ends may amplify this movement as well. When this happens, the LVDTs will capture the relative movements between the holder and the stop-end but these movements are not reflecting the desired relative movements of the measuring sample points. When the desired sample displacement is small, the error could not be neglected. However, there is no previous study that investigated the performance of the transducer system as a whole considering the mounting and installation method. This study aims to reveal and quantify this effect that was overlooked in the past using the compression test as an example. The compression test was selected because it is one of the easiest tests to implement. A multi-point photogrammetry monitoring system based on the binocular stereo vision approach is developed for this purpose.
Photogrammetry and image processing technologies have been used to measure mechanical properties, 3D displacements, or strain distributions for timber, timber-based or other composite materials in various types of experiments in previous studies (Garcia and Orteu Citation2001, Maas and Hampel Citation2006, Franke et al. Citation2007, Dahl and Malo Citation2009a, Citation2009b, Zhang et al. Citation2011, Guindos and Ortiz Citation2013, Mohamed et al. Citation2015, Gharavi et al. Citation2017, Gharavi and Zhang Citation2018, Gharavi et al. Citation2018, Uheida et al. Citation2021, Mohamed et al. Citation2021a, Citation2021b, Citation2021c). The binocular stereo vision approach is proposed and developed in this study for deformation measurements. Binocular stereo-vision is a non-contact measurement technique that can be used to extract reliable measurements of physical objects from stereo images. The main advantage of this technique compared to traditional techniques are that it offers the capability to measure the three-dimensional (3D) location of any point located on the object’s surface. Additionally, it can be used to monitor deformations of the object at various locations without having to make contact with it.
The main objective of the work presented has been to use the purpose-developed non-contact binocular stereo system for evaluating the performance of the system of LVDT displacement transducer using the compression test as an example. Another objective of this project was to measure the displacements of the sample at various locations to understand its surface displacement distribution in general as a reference for designing an LVDT monitoring system in a compression test in future studies. An experimental study was conducted to validate the proposed technique. After being validated, this technique was applied to an experimental study of timber specimens subjected to compressive loading perpendicular to the grain in the elastic range. The contact-free technique is found to be promising as a method of measuring the deflection of the timber specimens under compression. These measurements allowed evaluating the performance and reliability of the system of the LVDT. The methodology and measurement process performed in this study are discussed in the following sections and can be summarized in the workflow diagram shown in .
2. Experimental validation of the approach
2.1. Materials and methods
2.1.1. Materials and displacement measurement sensors
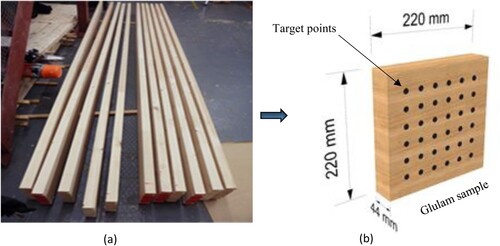
The material used in this study was a glulam timber beam which was employed during the preliminary torsion tests. The laminated beam was cut into cubic glulam blocks to provide samples to be used in the present study. A schematic diagram of the compression specimen with its dimensions is illustrated in .
Figure 1. Materials used in the study. (a) Image of the glulam timber beams. (b) Schematic view of a compression test sample with its dimensions.
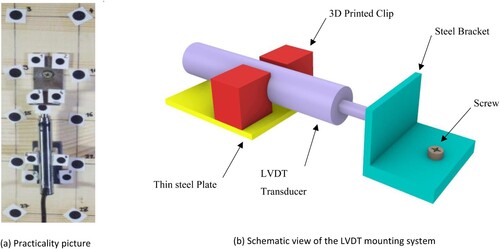
In this study, two different measurement methods; LVDT displacement transducers and a non-contact deformation measurement system, were used to monitor the deformation of the glulam samples during testing. The LVDTs (model D5-200A GRA) make accurate displacement measurements within a range of ±5 mm and a sensitivity of ±0.015 mm. This sensor requires a mounting system that should be in contact with the compressive load samples. In order to obtain more reliable and accurate measurements, the contact surfaces between the timber and mounting system, which is used to accommodate the LVDT sensor, should be minimized. This was achieved by fabricating a mounting system, composed of a rectangular steel plate and an L-shape steel bracket. The steel plate was attached to the specimen by a single screw. A plastic fitting was fabricated and glued securely to this plate to clamp the LVDT body (the fixed end of the transducer). The L-shape bracket was mounted into the specimen by a single screw and attached to the moving end of the transducer. The displacement transducer together with its mounting system placed on the compression sample is shown in .
Figure 2. The LVDT transducer with its mounting system.
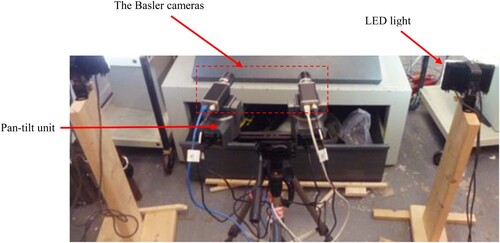
In addition to the LVDT sensor, a non-contact stereo camera system was also used to determine the relative displacements of the glulam samples. shows the optical system consisting of a pair of Basler Pilot piA2400-17gm cameras, two motorized pan-tilt units to enable panning and tilting the cameras by using remote controls connected to them, and a tripod with a frame for adjusting the cameras. The two stereo cameras were fitted with Computar (M2518-MPW 2/3″ F1.8) Megapixel lenses with a constant focal length of 25 mm and pixel size of 3.45 microns.
Figure 3. The image of the used Basler cameras.
2.1.2. Experimental setup and procedure
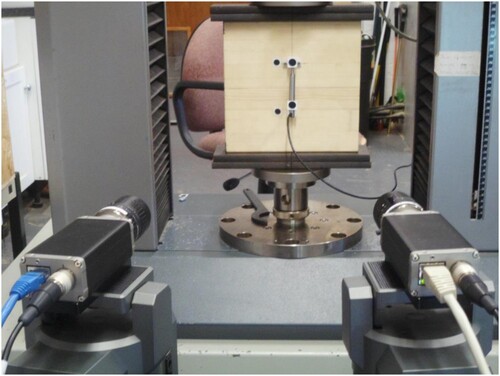
The validation and evaluation tests of the photogrammetric approach performed in this study were carried out at the Edinburgh Napier University. The proposed configuration, which enables the validation of the photogrammetric approach, is shown in . In this setup, A Zwick/Roell Z050 (Zwick GmbH & Co, Germany) universal testing machine with a maximum load capacity of 50 kN was used to test the specimens. Due to capacity limitations, the testing machine was only used to perform compression tests perpendicular to the grain direction. The machine was equipped with a load cell connected via a data acquisition system to a desktop computer (PC1) which has its software to be used for controlling and monitoring the experiments and collecting the data (time, load, deformations). The glulam timber sample was placed in the Zwick testing machine in front of the optical system. The LVDT sensor was mounted on the sample using the fabricated mounting system. The moving part of the sensor was attached to the L-shaped plate installed on the surface of the sample by a single screw. The fixed end of the sensor was clamped by a plastic fitting glued to a steel plate. The metal plate was connected to the sample surface by a screw. The LVDT transducer was then connected to a data acquisition system.
Figure 4. The test configuration for the validation of the photogrammetric approach.
The Basler cameras were mounted on motorized pan-tilt units fixed on a frame with a stereo baseline of approximately 30 cm. The stereo cameras were connected via a Gigabit Netgear switch to a desktop computer (PC2) with a frame grabber and the image processing software installed. To produce images that cover the area of interest utilizing these lenses, the two-camera system was placed at approximately 74 cm from the location where the glulam specimens need to be inserted, resulting in a field of view covering an area of about 220 × 220 mm. Two black circular targets on a white background were attached to the LVDT transducer at two points representing the gauge length of the sensor. This configuration allows the comparison between relative displacements measured by the LVDT and those determined by the optical system using the two targets. Two LED light sources were employed to assist in providing a homogenous illumination of the calibration plate during the calibration process.
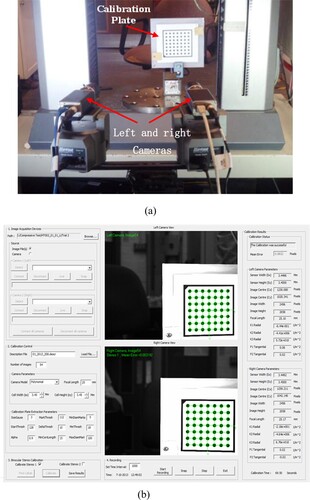
Before all tests, the left and right cameras must be calibrated. In order to obtain highly accurate calibration results and hence highly accurate 3D measurements, a standard calibration plate was used to perform the binocular stereo calibration. The calibration setup was carefully designed as described in (MVTech Software HALCON GmbH Citation2020). A 100 mm × 100 mm standard calibration plate – chosen according to the estimated dimensions of the region of interest to be captured as described in (MVTech Software HALCON GmbH Citation2020) – was placed in front of the two cameras as can be seen in (a). The plate images were acquired from the left and right cameras in 54 different positions and orientations relative to the stereo-vision system. Image coordinates of the calibration images were extracted and the parameters of the stereo setup were determined via a least-square solution – where suitably chosen camera parameters can be determined from the specification of the camera sensor and lens (Hartley and Zisserman Citation2003). A software package was developed based on visual C++ 2010 with the use of libraries from the image processing software HALCON version 11. This software provides all the necessary tools required to perform the calibration of the binocular stereo system easily and accurately. Implemented in the Microsoft Foundation Classes (MFC), the graphical user interface (GUI) for this package provides the functions necessary to calibrate the binocular system and to record the image data during testing. (b) shows an image of the GUI providing two calibration images of the calibration plate acquired from the two cameras in the process of calibrating the stereo camera system. This figure also shows the extracted calibration marks and calibration parameters for each camera. These parameters were then saved to be used in the calculation of 3D positions of the photogrammetric targets from its stereo projections by triangulation (Hartley and Zisserman Citation2003).
Figure 5. Stereo camera calibration. (a) Image of the stereo camera systems during the calibration process. (b) Snapshot of the implemented GUI during the stereo camera calibration.
After conducting the calibration of the stereo-vision system and before applying this system for evaluation purposes, the system must be validated. Four experimental evaluation tests were carried out according to the European standard procedures described in the standard EN 408 (BSI Citation2012). These tests were conducted in displacement control, with a 0.02 mm/s crosshead displacement rate of the testing machine. The LVDT sensor and the calibrated binocular stereo system were both employed to monitor displacements between two points over the gauge length (8 cm) on the glulam sample during the compressive loading. An initial pair of stereo images were captured by the two cameras before applying loads to the timber sample to allow comparison with the subsequent data. During load application, the load and relative deformation – which was measured from the LVDT – were recorded through the data acquisition system. The GUI of the implemented software was used to automate recording the stereo images of the surface of the glulam sample with a time interval of about 1 s.
3. Performance study of the displacement transducers
3.1. Materials and methods
The materials used in this study were the glulam timber beams which were employed for the torsion tests, as displayed in . One of these beams was cut into cubic glulam blocks to provide samples to be used in the present study. The dimension of these samples is also shown in . As described in EN 408 (BSI Citation2012), in order to ensure uniform loading, the test blocks were accurately prepared and their loaded surfaces were cut smoothly and accurately to be parallel to each other and perpendicular to the test piece axis. Prior to testing, all timber samples were stored in a controlled-temperature room with a temperature of approximately 20°C and relative humidity of approximately 60% in accordance with the mentioned standard.
3.2. Experimental set-up and procedure
All compression experiments carried out in this study followed the specification testing procedure as recommended in EN 408 (BSI Citation2012). Nine specimens that were cut from the same timber beam were selected to be tested with the compression tests performed in this study and carried out according to the procedure of the above-mentioned standard. The same configuration of the binocular stereo system which was used during the calibration process was also used while subjecting the sample to compressive loading. Before performing the compression tests, a total of thirty targets were applied to the timber samples for optical deflection measurements. These targets are printed on self-adhesive paper and then cut to size (named as P1 to P30), which represent black circular marks on a white background to be easily distinguished during the image processing stage. There are two sizes of these marks, 10 mm ones used on the timber surface, another smaller on 6 mm used on the LVDT and mounting systems. They were glued to one side of the timber sample as shown in . Some of these targets (P9, P10, P21, and P22) were installed adjacent to the LVDTs and were intended to be used for comparing the LVDT readings with measurements of the optical system. The compression test sample was centred between two spherically seated loading heads. Two LVDTs (LVDT1 and LVDT2) with a gauge length of 8 cm were placed at the mid-height of the timber sample on two opposite sides, providing a local displacement measurement at both sides of the glulam specimen. To assess the performance of the LVDT1 mounting system, nine photogrammetric circular targets, shown in (c), were placed on the steel plate and bracket used to hold the transducer. These targets are shown in (a) and indicated by blue colour. shows a schematic plot of the experimental setup and equipment used during testing, including the Zwick testing machine and the binocular stereo-vision system. The experimental setup is shown in .
Figure 6. Schematic view of the test sample with LVDT instrumentation. (a) Front view. (b) Side view. (c) Image of the installed targets and the LVDT on the specimen.
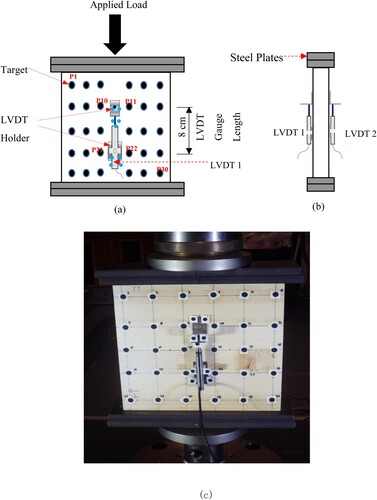
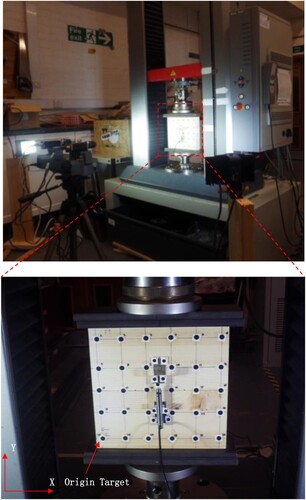
Figure 7. Image of experimental setup of compression test.
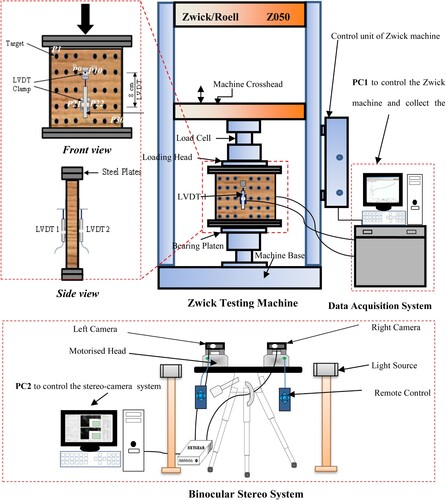
Figure 8. Schematic plot of the experimental setup of compression test with instrumentation (top), and more details of the specimen (bottom).
After calibrating the stereo camera system, the experimental tests were conducted on each timber sample in the direction perpendicular to the grain. The two-camera system was placed on one side in front of the testing machine. Before starting the actual compression tests, preliminary tests were conducted on a trial sample. The trial experiments were used to determine the rate of loading and to estimate the elastic range of the sample, ensuring that no permanent deformation occurred during the compression test and to avoid any damage that might occur during testing. The deflection of the sample, rate of loading, and the maximum load to be applied to the system were then determined. A load of 12 kN was found to be appropriate to load the sample in the elastic range. The timber samples were tested based on these measurement data. Before applying the actual load, a pre-load with a force of 1 kN was first applied to the timber test sample to enable it to be seated properly. The sample was then efficiently held to allow the two cameras to capture the initial state of the sample and the LVDTs were initialized to zero displacements through the data acquisition system. Using a displacement control of 0.02 mm/s, the samples were loaded constantly throughout the test. Loading and displacements were recorded simultaneously using a load cell and LVDT sensors connected to a data acquisition system at 0.1 s intervals. During loading, the implemented application software was used to automate recording images of the sample surface acquired by the two cameras with a time interval of about 1 s. At the end of loading the sample, the machine was set to let the crosshead displacement control stay in the same position to allow capturing the final state of the sample.
3.3. The algorithm developed for the photogrammetric deflection measurements
To find the 3D information from the stereo images recorded during testing, it is necessary to utilize an image processing algorithm and stereo vision software. HALCON, a comprehensive and powerful software, provides the operators for image-based applications with image processing libraries and a graphical user interface optimized for usability. As shown in , an image processing algorithm was implemented in this software to process the stereo images. As well as determining the presence of targets in each camera’s image of the timber sample, the algorithm determines the 3D displacements of the circular targets to obtain their relative displacements from the stereo images of the timber sample recorded during testing. These 3D data will then be used to evaluate the performance of LVDT and to collect the sample displacements at various locations as previously mentioned. The displacement measurements from these targets captured in stereo images involved several steps during image processing. The main steps involved in the algorithm are illustrated in .
Figure 9. Screenshot of the implemented HALCON algorithm during stereo processing of the captured images.
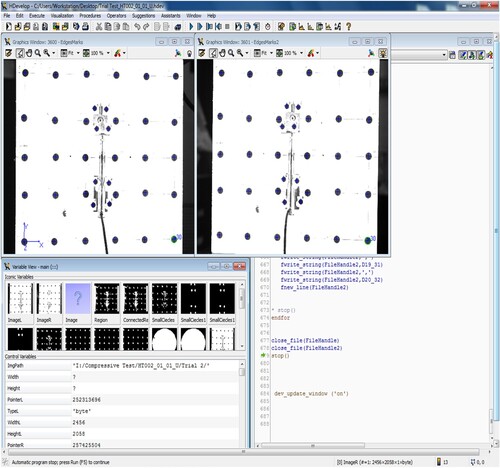
Figure 10. Flowchart of the algorithm.
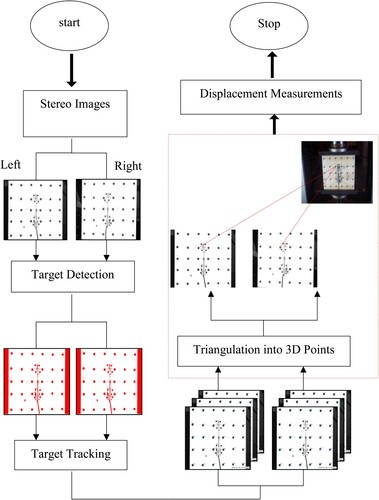
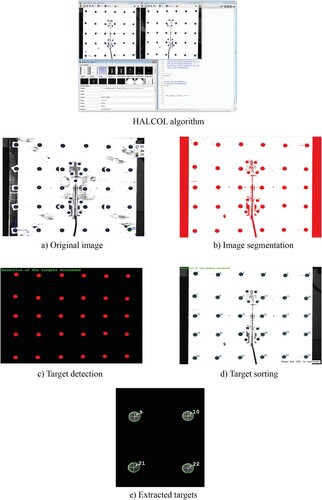
illustrates the concept and steps involved in the algorithm. The process starts with reading the calibration files containing the internal and external parameters of the binocular stereo system that were recorded during the calibration process. The stereo images of the timber sample recorded from the left and right cameras during testing were then displayed to be used in the image recognition process. The sub-pixel-precise segmentation method provided by the software was used to reduce the area of interest by using the threshold values of the pixels to correspond to targets, in order to separate the different regions and determine the black regions. The connected components of these regions were then calculated and all holes in these components were filled up. The stereo images were then reduced to these regions of interest and the potential targets that meet specific shapes and sizes were selected. These targets were fitted to ellipse shapes and their image coordinates in both the left and right images were measured. The stereo-matching problem was then solved by sorting these targets in each of the left and right images according to their order in a row and column coordinates from top to bottom. They were then labelled and numbered to show their correspondent matching in each image pair.
Figure 11. The image processing steps for extracting the targets. (a) Original image. (b) Image segmentation. (c) Target detection. (d) Target ordering. (e) The extracted targets.
After successful detection and matching of all targets in the stereo images, their 3D coordinates expressed in the camera coordinates of the left camera were determined using the theory of triangulation (Hartley and Zisserman Citation2003). These 3D data were then transformed into the object coordinate system, as defined in , and then used in the calculation of the displacement of the targets during the period of tests. The entire process was programmed in the software to be automated to reduce personnel time and effort. The recognized targets were displayed on the screen with their respective 3D coordinates and this data was saved on the computer to be used in the calculation of the displacements or relative displacement between the targets.
4. Test results and analysis
4.1. Validation test results
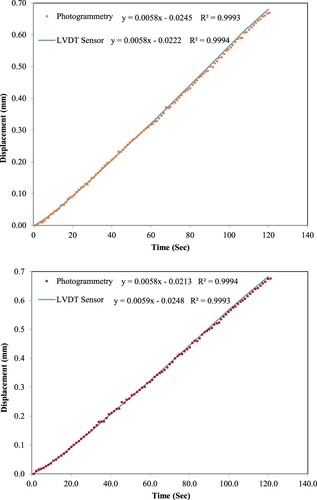
The validation tests were carried out with the purpose of validating the photogrammetric approach before using it to assess the performance of the LVDT sensor for measuring the displacements over a gauge length in the central part of the glulam specimens. The photogrammetric targets, P1 and P2, were placed at both the moving and fixed ends of the transducer to monitor the displacements over the gauge length (8 cm). Using the 3D reconstruction algorithm presented previously, the 3D coordinates of the targets were obtained by processing all the stereo images captured by the calibrated stereo cameras during testing. The relative displacements in the Y direction (the vertical direction) between the centroid of the two target points (P1 and P2) were then calculated. The corresponding relative displacement between the two points (gauge length) was measured by the LVDT. The relative displacements measured by the LVDT transducer and those determined by the photogrammetric approach are all plotted on the same figure to be compared with each other. shows some selected examples of these comparisons and indicates a remarkable correspondence. In this figure, the displacements obtained from the two-camera system accurately describe the measured vertical displacement using the LVDT sensor which highlights the efficiency of the proposed approach.
Figure 12. Comparison of measurements between the LVDT and the photogrammetric approach for trial test 2 (top) and trial test 3 (bottom).
4.2. Evaluation test results
The compression tests were carried out to investigate the efficiency of using the LVDT transducer for measuring the relative displacements on the glulam specimens using the photogrammetric approach. The deformation of the mounting system used to attach the LVDT to the surface of the compression specimens was also investigated by the camera system. This was achieved by applying photogrammetric targets to both the surface of the glulam specimen in accordance with the setup of the LVDT and to the mounting system used to attach this device. The 3D coordinates of these targets were obtained by using the calibration parameters of the camera system and processing the stereo images in the developed 3D reconstruction algorithm described previously.
4.2.1. Comparison of the test results between the photogrammetric approach and the LVDT
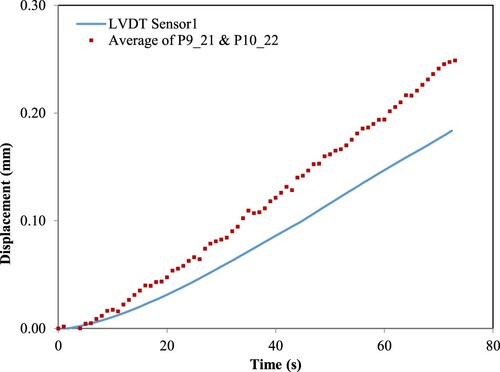
As previously mentioned, the photogrammetric targets (P9, P10, P21, and P22) were installed in accordance with the LVDT and were intended to be used for comparing the LVDT readings with the stereo camera system. The locations of these targets are indicated in by the red-coloured circles. The setup of the investigated LVDT sensor is also shown. The 3D coordinates of the targets (P9, P10) and (P21, P22), were used to calculate the relative displacements over the two-gauge lengths, l1 and l2, respectively. The averages of these measurements in addition to the corresponding relative displacements measured by the LVDT were plotted in the same figure to be compared. Examples of these comparisons for samples 1 and 2 are shown, respectively, in and . The displacement graphs of the two sensors followed similar trends. However, there is a significant difference between the relative displacements measured by the transducer and those determined by the photogrammetric method. The maximum difference between the two methods was about 30%. This may be attributed to the fact that the setup of LVDT on timber will affect its reading values and the clamps used to attach this sensor might move during loading.
Figure 13. The selected targets to evaluate the performance of the LVDT.
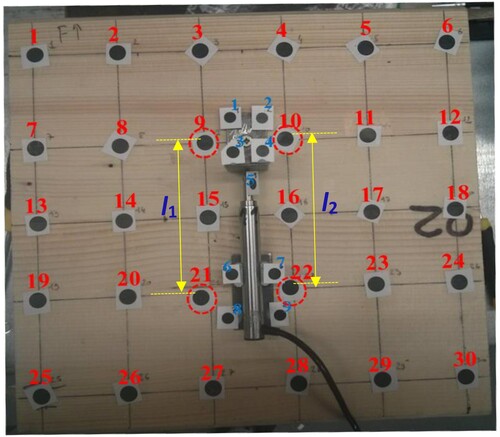
Figure 14. Comparison of the measurement results for sample 1.
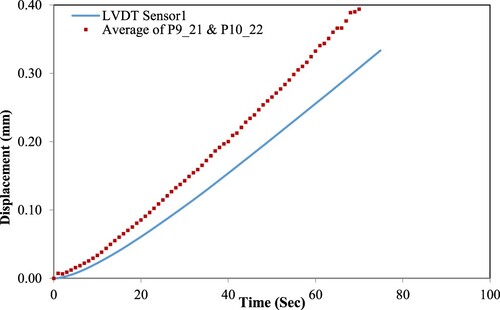
Figure 15. Comparison of the measurement results for sample 2.
The reading data of the transducer illustrates that the setup of this device was not stable, and this could be explained by the fact that the timber surface, during the compression tests, does not remain stable since the timber is not a homogenous material. Therefore, the transducer holders might move, affecting the test results.
4.2.2. Investigation of the LVDT mounting system
To further investigate the setup of the mounting system of the LVDT transducer, nine photogrammetric circular targets, shown in , were glued on the steel plate and bracket of the mounting system used to hold the transducer. Targets 1, 2, 8, and 9 represent the marks, installed on the mounting system, far from the surface of the glulam specimen. Targets 3, 4, 6, and 7 represent the marks, installed on the mounting system, close to the surface of the test specimen. Target 5 represents the mark installed directly on the moving end of the LVDT transducer. The 3D coordinates of the photogrammetric marks were determined by the previously mentioned 3D reconstruction algorithm and were used to calculate the relative displacements of the targets. shows an example of the comparison of the test results. The LVDT readings and the displacements of the targets attached to the LVDT are in good agreement and closely corresponding. Contrarily, the relative displacements obtained from the targets glued to the surface of the glulam specimen and those obtained from the targets glued to the holder close to the timber surface were found to have a small difference between their readings, although they were still relatively close. This can be attributed to the influence of the holder to the measurements since it can move differently from the movement of the timber surface.
Figure 16. The setup used to investigate the mounting system of the LVDT.
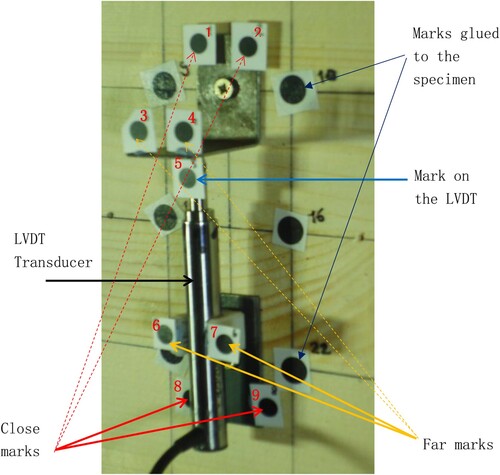
Figure 17. Comparison of the LVDT and the photogrammetric measurements.
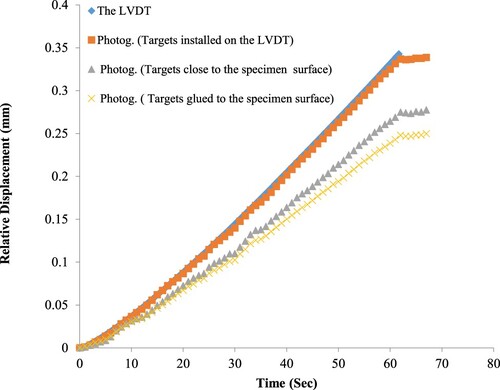
At the beginning of the applied loading and within the first 10 s, the relative displacements for both the LVDT and the considered targets were almost the same, but the magnitudes of those measured by the LVDT and the targets installed on them increased dramatically. This can again be attributed to the influence of the holder on the measurements. This was confirmed with the different values of displacements obtained from the targets attached directly to timber and those placed on the holders but close to the surface of the specimen.
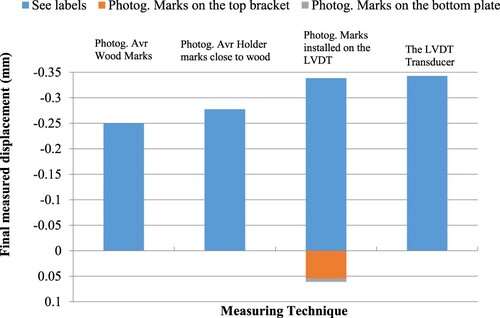
By comparing the results of the transducer efficiency tests, the difference between the measurements of the LVDT transducer and the photogrammetric method was higher than 30%. To evaluate this large discrepancy, the final maximum displacements measured by both methods were plotted in the same figure. shows an example of this comparison. The first column data represents the maximum displacement of the targets attached directly to the timber. The second column data represents the maximum displacement of the targets glued to the holder near the timber surface. The third column data, indicated by the blue colour, represents the maximum displacement of the targets attached directly to the LVDT transducer whereas the column data, indicated by the red and green colour, represent, respectively, the maximum displacement of the targets placed on the steel bracket and plate of the mounting system. They represent the holder’s motion data. Finally, the last column data represents the maximum displacement measured by the LVDT transducer. The top bracket, which was close to the loading plate, had a higher displacement (0.054 mm) than that of the bottom plate (0.007 mm), which was far from the loading plate. If the motion data of the transducer holder are added to the transducer data, this results in a displacement similar to that of the timber. These results show that the transducer results are not reliable since the setup is not stable due to the motion of the mounting system during the compressive test perpendicular to the grain.
Figure 18. The test results for evaluating the LVDT mounting system.
4.2.3. Deformation of the surface of the glulam specimens
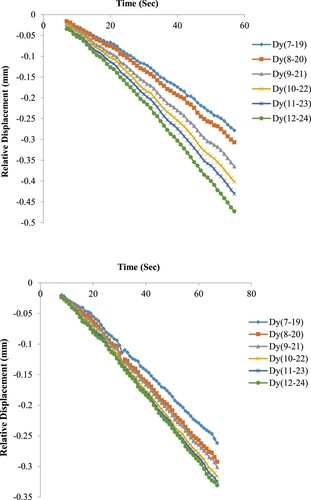
To investigate how the surface of the glulam specimens deforms under the applied compressive loading at different locations, the relative displacement over the gauge lengths (L1 to L6), shown in , were determined based on the above-mentioned 3D reconstruction algorithm. Typical results of these displacements for the glulam specimens, 1 and 9, are shown in . It can be seen from these figures that the displacements determined between the two points placed in the middle of the specimens follow the same trend, but with different magnitude.
Figure 19. Screenshot of the target detection, showing the locations of the targets monitored with different gauge lengths.
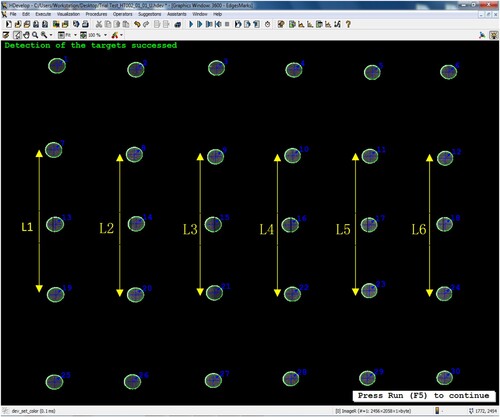
Figure 20. Comparison of the displacement results at the middle of sample 1 (top) and sample 9 (bottom).
5. Conclusion
This study reveals the effect of the mounting system of LVDTs in the mechanical property tests of timber materials. This effect has been proven to be significant enough that will distort the measurements completely if the displacement is relatively small. A purpose-developed non-contact photogrammetric approach is adopted to evaluate the performance of the mounting system of the LVDT displacement transducers on monitoring the deformation of the timber samples. In contrast to traditional techniques, the proposed photogrammetric approach provides more details of the deformations in the timber specimens even it also has its own shortcomings such as strict light condition, rigorous but time-consuming calibration process, surface measurement only, etc. Based on the experimental work of this research, the following conclusions can be drawn:
Previous research projects paid less attention to evaluating the performance of the mounting system and the method of installation for the LVDT sensor on measuring displacements of timber samples. The proposed method provides a cost-effective and non-contact method for determining reliable deformations at multi-locations of the tested specimen and reveals the effect of the mounting system and method of installation for the LVDTs on the displacement measurement of the timber samples.
Several test series were conducted with nine timber samples in compression perpendicular to the grain direction. The validation of the proposed stereo camera system was achieved by performing validation tests and comparing the displacements obtained using the photogrammetric approach with those measured by the traditional device, the LVDT sensor. Good agreement has been found between these two measuring systems.
The photogrammetric approach has proved to be an efficient and accurate way of monitoring the performance of the mounting parts of the LVDT transducers on measuring the displacements of timber samples. The experimental results showed that the readings measured by the LVDT sensor were mostly influenced by the setup of this device when mounted on timber. An additional photogrammetry validation of the LVDT measurement is recommended if the displacements being measuring are relatively small.
From the test results of this study, it is recommended that the setup of the mounting system needs to be investigated before using it to hold the LVDT. This might assist in finding a proper way to mount the sensor to the surface of the timber sample when a high measuring accuracy is needed. Testing standards should consider this effect when recommending displacement transducers to be used in a timber-related test.
Disclosure statement
No potential conflict of interest was reported by the author(s).
Additional information
Funding
References
- Aicher, S. and Stapf, G. (2016) Compressive strength parallel to the fiber of spruce with high moisture content. European Journal of Wood and Wood Products, 74(4), 527–542.
- Brandner, R., Dietsch, P., Dröscher, J., Schulte-Wrede, M., Kreuzinger, H. and Sieder, M. (2017) Cross laminated timber (CLT) diaphragms under shear: Test configuration, properties and design. Construction and Building Materials, 147, 312–327.
- BSI (2012) BS EN 408: 2010+ A1: 2012 Timber Structures. Structural Timber and Glued Laminated Timber. Determination of Some Physical and Mechanical Properties (London: British Standard Institute).
- Dahl, K. and Malo, K. (2009a) Planar strain measurements on wood specimens. Experimental Mechanics, 49(4), 575–586.
- Dahl, K. B. and Malo, K. (2009b) Linear shear properties of spruce softwood. Wood Science and Technology, 43(5-6), 499–525.
- Faggiano, B., Grippa, M. R., Marzo, A. and Mazzolani, F. M. (2011) Experimental study for non-destructive mechanical evaluation of ancient chestnut timber. Journal of Civil Structural Health Monitoring, 1(3), 103–112.
- Franke, S., Franke, B. and Rautenstrauch, K. (2007) Strain analysis of wood components by close range photogrammetry. Materials and Structures, 40(1), 37–46.
- Garcia, D. and Orteu, J.-J. (2001) 3D Deformation Measurement Using Stereo-Correlation Applied to Experimental Mechanics. Proceedings of the 10th FIG International Symposium Deformation Measurements.
- Gharavi, N. and Zhang, H. (2018) Study on the impact of size and position of the shear field in determining the shear modulus of glulam beam using photogrammetry approach. International Journal of Structural and Construction Engineering, 12(3), 218–222.
- Gharavi, N., Zhang, H. and Xie, Y. (2017) Evaluation of the end effect impact on the torsion test for determining the shear modulus of a timber beam through a photogrammetry approach. International Journal of Mechanical and Mechatronics Engineering, 11(3), 677–680.
- Gharavi, N., Zhang, H., Xie, Y. and He, T. (2018) End effect on determining shear modulus of timber beams in torsion tests. Construction and Building Materials, 164, 442–450.
- Guindos, P. and Ortiz, J. (2013) The utility of low-cost photogrammetry for stiffness analysis and finite-element validation of wood with knots in bending. Biosystems Engineering, 114(2), 86–96.
- Hartley, R. and Zisserman, A. (2003) Multiple View Geometry in Computer Vision (Cambridge: Cambridge University Press).
- Jeleč, M., Dokšanović, T., Draganić, H. and Rajčić, V. (2021) Advancement in prediction of shear strength and stiffness of cross laminated timber beams. Engineering Structures, 238, 112247.
- Maas, H.-G. and Hampel, U. (2006) Photogrammetric techniques in civil engineering material testing and structure monitoring. Photogrammetric Engineering & Remote Sensing, 72(1), 39–45.
- Mohamed, A., Deng, Y., Zhang, H., Wong, S. H. F., Uheida, K., Zhang, Y. X., Zhu, M.-C., Lehmann, M. and Quan, Y. (2021a) Photogrammetric evaluation of shear modulus of glulam timber using torsion test method and dual stereo vision system. European Journal of Wood and Wood Products 79, 1209–1223.
- Mohamed, A., Uheida, K., Quan, Y. and Zhang, H. (2021b) Applicability of the torsion test and photogrammetric approach on structural timber beams. International Wood Products Journal, 13(3), 206–217.
- Mohamed, A., Uheida, K., Quan, Y. and Zhang, H. (2021c) Verification of the photogrammetric approach on the torsion test method for timber beams. International Wood Products Journal.
- Mohamed, A., Zhang, H., Smith, I. and Xiao, Z. (2015) A low cost non-contact and non-destructive method for evaluating the variation of the shear modulus for glued laminated timber beams using a photogrammetric approach. In J. Kruis, Y. Tsompanakis and B. H. V. Topping (eds.) Proceedings of the Fifteenth International Conference on Civil, Structural and Environmental Engineering Computing (Prague: CIVIL-COMP).
- MVTech Software HALCON GmbH. (2020) The Software for Machine Vision Applications, available at: http://www.mvtech.com/halcon/
- Turesson, J., Berg, S., Björnfot, A. and Ekevad, M. (2020) Shear modulus analysis of cross-laminated timber using picture frame tests and finite element simulations. Materials and Structures, 53(4), 112.
- Uheida, K., Deng, Y., Zhang, H., Galuppi, L., Gao, J., Xie, L., Huang, S., Qin, X., Wong, S. H. F., Guo, J., Zhang, G. and Mohamed, A. (2021) Determining equivalent-sectional shear modulus in torsion tests for laminated glass beams using photogrammetry method. Composite Structures, 276, 114572.
- White, K. B., Miller, T. H. and Gupta, R. (2009) Seismic performance testing of partially and fully anchored wood-frame shear walls. Wood and Fiber Science, 41(4), 396–413.
- Zhang, H., Gharavi, N., Wong, S. H. F., Deng, Y., Bahadori-Jahromi, A., Limkatanyu, S., Qiao, Y. and Kuang, J. S. (2021) Effect of concentrated butt-joints on flexural properties of laminated Bamboo-Timber flitch beams. Journal of Sandwich Structures & Materials. doi:10.1177/10996362211040103.
- Zhang, H., Mohamed, A., Smith, I. and Xiao, Z. (2011) Evaluation of Shear Constant of Timber Glulam Composite with Photogrammetric Approach. The 13th International Conference on Civil, Structural and Environmental Engineering Computing, Crete, Greece.