
 ?Mathematical formulae have been encoded as MathML and are displayed in this HTML version using MathJax in order to improve their display. Uncheck the box to turn MathJax off. This feature requires Javascript. Click on a formula to zoom.
ABSTRACT
Engineered Wood Products like Cross-Laminated-Timber (CLT) are transforming capabilities of wood as a construction material, enabling architects and engineers to create innovative buildings. Using CLT can have many advantages compared with using traditional materials, not least of which is reducing total superstructure gravitational weights. Reducing gravitational weight can simplify and speed up construction processes and reduce foundation costs. Plus, being made from wood, CLT has desirable ‘green’ credentials like renewability of forest resources and carbon sequestration for the lifespans of buildings. However, like other lightweight structural systems, CLT buildings can be susceptible to high-amplitude motions during ambient or other dynamic force and displacement disturbances. Studies reported here address the dynamic behaviour of mid-rise multi-storey buildings constructed from massive CLF elements, with a focus on predicting lateral modal response characteristics of such buildings. The vehicle for this is detailed Finite Element (FE) models verified as accurate replicators of ambient dynamic motions of completed CLT buildings. Here applications of FE models relate to performances of buildings during seismic events. However, the intent is to also use them to predict motions of buildings during windstorms.
1. Introduction
Land use policies for European and other cities have become a major issue due to rural-to-urban migration fuelled population growth (European Commission Citation2006). Consequently, city planners, architects and engineers all over the world have turned attention to mid- and high-rise construction strategies to increase built-space capacity without exacerbating urban sprawl. However, the need for extra occupied space is not the only challenge because building construction materials account for around 40% of all global primary energy consumption and Greenhouse Gas emissions (GHG) (Buchanan Citation2005, International Energy Agency Citation2019, European Commission Citation2021). One increasingly favoured GHG reduction policy, especially in forest resource-rich countries, is restoring the use of timber as a general-purpose primary construction material for mid- and high-rise buildings. This reflects a relatively lack of need to destroy resource landscapes, and low amounts of energy required to processing trees into high performance Engineered Wood Products (EWP) (Buchanan Citation2005, European Commission Citation2021). Primary historical concerns about urban use of timber in construction centred on the combustibility of wood. However, those concerns were founded on urban experiences gained when buildings were constructed very differently using different types of timber products and combustible roofing materials. Modern Performance-Based Design Code (PBDC) regulations recognize that the entirety of building construction material and their uses have changed (Smith and Frangi Citation2014). PBDC concepts supported by modern Fire Engineering methods enable the use of EWP even under the most demanding design scenarios (Smith and Frangi Citation2014). Cross-Laminated-Timber (CLT) encompasses a class of EWP commonly used to construct large-scale floor and shear wall systems of low- and mid-rise buildings (Smith and Frangi Citation2014). CLT products are manufactured by stacking and glueing together layers of sawn lumber in a manner where alternating layers are orthogonal to one another, making such materials tough and split resistant under effects of in-plane tension or shear force flows. From the perspective of meeting most Ultimate Limiting State (ULS) and static displacement Serviceability Limiting State (SLS) requirements of contemporary PBDC regulations, the design of CLT buildings of any practically and economically viable height has been proven to be well within the capabilities of present engineering know-how. What remains challenging and is only partially answered are questions related to seismic performance ULS and vibration performance SLS design of CLT buildings (Ceccotti Citation2008, Tannert et al. Citation2018, Polastri et al. Citation2019, Sandoli et al. Citation2021).
High stiffness-to-mass ratios characteristic of CLT can cause high-amplitude responses of entire superstructures subjected to effects of horizontal dynamic forces or displacements, and structural forms like elevated floors subjected to vertical dynamic forces or displacements (Weckendorf et al. Citation2016, Ussher Citation2017). Structural engineering codes have long since allowed seismic design practices based on response spectrum or time-history analyses methods that account for participation by vibration modes representing at least 90% of the system gravitational mass (European Committee for Standardization Citation2004b, American Society of Civil Engineers Citation2010, Bureau of Indian Standards Citation2016). The challenge in the context of this discussion is to articulate applicable of such practices to CLT buildings. Much past attention was directed toward seismic performance diaphragm, shear walls and energy dissipative systems (Follesa et al. Citation2013, Gavric et al. Citation2015, Izzi et al. Citation2018, Mugabo et al. Citation2019, Aloisio and Fragiacomo Citation2021). A key finding was CLT floors that have diaphragm functions can strongly influence seismic behaviours of multi-storey structures (Izzi et al. Citation2018). However, as yet quite limited attention has been given to the definition of rigid CLT diaphragms, which is key to proper FE modelling of buildings.
Ambient vibration tests, which usually measure low amplitude motions caused by excitation sources like wind, vehicular traffic and human activities, have been conducted to extract dynamic characteristics of a wide array of civil engineering structures (e.g. Farsangi et al. Citation2020, Inel et al. Citation2019). Few such studies have been performed on timber buildings (Worth et al. Citation2012, Reynolds et al. Citation2016, Aloisio et al. Citation2020). A key finding of those studies which have been undertaken is nominally non-structural construction elements can have large effects on modal characteristics of Lateral Force Resisting Systems (LFRS) and superstructures of which they are part. The paucity of ambient vibration measurement data reflects the extents of expense and time investments that would be necessary to acquire generalized insight applicable to any class of buildings (Ussher Citation2017). This is why the authors and other researchers are turning their attention to the alternative of Finite Element (FE) numerical model simulations. FE simulations are widely recognized across many engineering fields as cost-effective substitutes for large-scale field testing (Ussher Citation2017). The second advantage of FE simulations is they can mimic behaviours of building at either low or high-amplitude levels of motion (Folz and Filiatrault Citation2004a, Folz and Filiatrault Citation2004b, Mugabo et al. Citation2019).
The study reported here was undertaken to provide insights into the vibration SLS of buildings in which superstructures are primarily assemblages of massive CLT panels. The adopted approach is to create FE models capable of fully representing the effects architectural and construction method design decisions have on dynamic responses of LFRS. Validation of modelling techniques is based on ambient vibration measurement data for an eight-storey reference building. The remainder of this paper addresses FE modelling techniques and their verification, plus application of those techniques to conceptual mid-rise CLT buildings.
2. Description of reference building
The eight-storey case-study building is one of the two identical Palisaden student residence buildings on the campus of the Norwegian University of Life Sciences (NMBU) in Ås. The superstructure has a 15 m by 23 m rectangular footprint and a total superstructure height of 23.6 m (). Massive CLT plate elements form structural walls, and horizontal floor and roof slabs which act as structural diaphragms. Except for locations where there are opening on plan, the horizontal slabs have widths up to 2.5 m and a continuous length of 15 m corresponding to the minor plan axis dimension. Both exterior and interior CLT walls support horizontal slabs. Construction and structural strategies conform to what is termed Platform Construction, wherein as construction proceeds each new floor slab becomes the working platform for the erection of the next storey. In conventional platform-type CLT building, the hold-downs connect each panel to the floor supporting it. Conversely, in the considered building, the hold-downs consist of long steel plates anchoring multiple CLT panels to the foundation. Therefore, the hold-downs act like a distributed and highly hyperstatic connection system. It must also be noted that inclined screws further connect all CLT panels. Thus, the presence of a distributed anchoring system, connecting multiple storeys, and the presence of extra screws, not specified by the design drawings but used where possible to achieve a solid mutual connection between panels, make the considered case study in some way a continuum, monolithic structure. Additionally, there are shear connectors at the middle of each panel connecting two adjacent panels.
Figure 1. Reference building at NMBU.
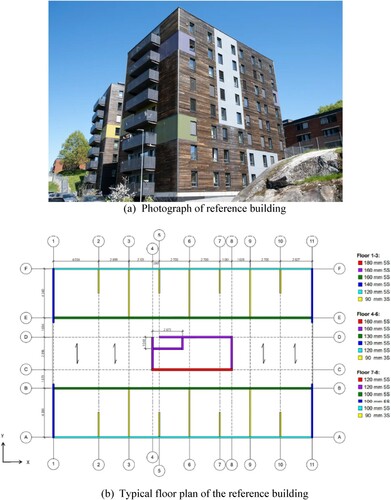
The thicknesses of the wall elements decrease from bottom to top storeys, reflecting the accumulation of gravitational mass from the top to bottom storeys ((b)). Horizontal floor slab elements all have a thickness of 180 mm, and roof slab elements have a thickness of 200 mm. The thickness of roof elements reflects that design snow loads are higher for Ås than applicable design live loads for the floors. Walls designated to act as shear walls are those indicated in . The central building core shown in (b) and which house an elevator, a staircase and building services shafts has CLT walls attached to horizontal slabs, making it part of the buildinǵs lateral force resisting system (LFRS). gives details of floor element, shear-wall element and connector specifications.
Figure 2. Typical layout of shear walls in reference building.
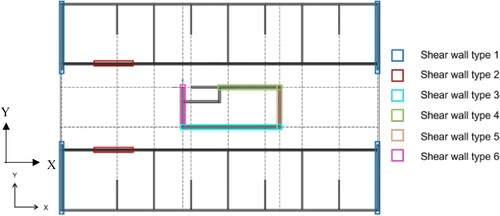
Table 1. Specifications of shear walls and connectors.
3. FE numerical models
3.1. General considerations
Numerical models were created using the commercial software SAP2000 (Computers and Structures Inc Citation2014), chosen because of its Open Application Programming Interface (OAPI) which is compatible with the Python programming language (Van Rossum and Drake Citation2009). This facilitated use of Python scripts during the calibration of model parameters, and parameter sensitivity and model updating studies. describes Python scripts developed to support the application of SAP2000. CLT elements are assumed to be orthotropic thin plates with orthogonal axes of material symmetry (1, 2, 3) coincident with length, width and thickness directions of elements (x, y, and z). Small deflections elastic responses are assumed valid because system displacements under ambient dynamic forces are several orders of magnitude less than overall superstructure dimensions.
Table 2. Description of Python scripts.
3.2. FE model details
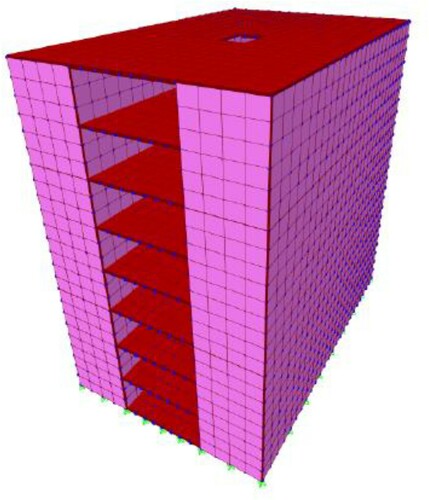
The geometry of the building was first developed using the Archicad software and converted to an (Industry Foundation Classes) IFC format, facilitating importation to SAP2000 (Computers and Structures Inc Citation2014). As that approach does not support the inclusion of windows or doors in the FE superstructure model, a factor of 0.75 was applied to the thicknesses of the walls along gridlines B–B and E–E ((b)) where the doors are located to account for openings. Similarly, a factor of 0.77 was applied to thicknesses of the walls along gridlines A–A and F–F ((b)) to account for the presence of window openings. Factors 0.75 and 0.77 were based on relevant ratios of opening-to-total wall areas (Santaella and Tseng Citation2019). The baseline FE model considered wall and horizontal slabs to be continuous within particular walls, floors or the roof (). Wall-to-wall, wall-to-slab and wall-to-foundation connections were simulated as hinges (i.e. having the ability to transfer in-plane force flows but not the ability to transfer bending moments). CLT elements were modelled using four-node orthotropic and thin shell elements with material properties in . The shell elements were considered to be thin, meaning the Kirchhoff plate formulation is applied, and through-thickness shear deformation is neglected. This is justified because the thickness-to-span ratios of elements did not exceed 0.1 (Timoshenko and Woinowsky-Krieger Citation1959). It has been reported SAP200 has limitations in terms of meshing routines leading to non-convergence solutions, compared to other commercial FE software (Rivera et al. Citation2015). This possibility was balanced with the need to optimize the efficiency of model running times, by selecting a meshing density corresponding to a maximum element size of 2 m by 2 m.
Figure 3. Baseline FE superstructure model.
In , E1 is calculated from Equations 1 or 2 depending on the number of laminations of CLT elements (Aranha Citation2016). E2 is calculated from Equations 3 or 4. E3 is assumed to have a constant value (Aranha Citation2016). G1 is assumed to be E1/20; G2 and G3 are assumed to be G1/10 (American National Standards Institute Citation2012). The CLT layer configuration was assumed to correspond to using 20 and 40 mm thick lumber laminations. Self-weight of CLT-panels was taken from reference (Wallner-Novak et al. Citation2014). A Poisson’s ratio of 0.3 was adopted for all CLT materials (Wallner-Novak et al. Citation2014). The foundation of the building was assumed fully rigid with nodes connecting it to the superstructure restraining all translational and rotational displacements.
(1)
(1)
(2)
(2)
(3)
(3)
(4)
(4)
In Equations 1 to 4, second subscripts (3 and 5) signify E1 and E2 values applicable to 3- and 5-ply layups, respectively. E0,n and E90,n correspond to parallel or perpendicular to grain directions in lumber laminations, tn is the thickness of the nth lamination, and t is the total thickness of a CLT element.
3.3. Sensitivity analyses
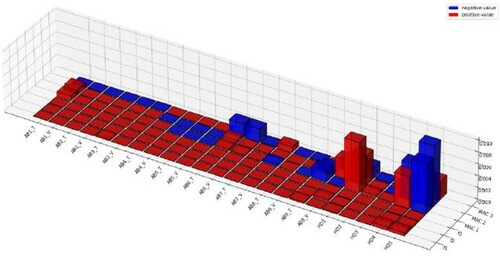
Sensitivity analyses assessing change variations in model parameters have on the agreement between measured and numerical dynamic characteristics of structural systems are a widely adopted basis for improving the accuracy of FE models (Mordini et al. Citation2017). The model of the reference building was refined using sensitivity analyses of the effects of stiffness properties of CLT elements, and dead and live loads on elevated floors and the roof. Floor dead loads included weights of interior partitions. and provide seed values of CLT properties, loads and material density used in sensitivity analysis, and therefore as the basis of model updating. Equations 5 to 8 (Mordini et al. Citation2017) form the basis of the Python scripts performing sensitivity analysis. All parameters were assigned ranges based on likely maximum and minimum values within which they could be updated by optimization algorithms. Except for G1 in wall sections with doors and windows, all material properties could not exceed ±50% of their original values. For wall sections with doors and windows, G1 was not permitted to ±80% of the original value. A 10% step size was chosen to facilitate the implementation of Equations 5 to 8 in Python algorithms. illustrates the normalized sensitivity matrix. To isolate the parameters with sensitivities not equal to zero, the sum of the absolute values for each parameter is calculated. Parameters with a sum lower than 10−7 are deemed insensitive and removed from the sensitivity matrix. The sensitivities to the MAC responses are scaled, as their initial values were, on average, two orders of magnitude lower than the frequency responses. A blue colour corresponds to a negative sensitivity, i.e. an increase in parameter value decreases the response value. Red colour corresponds to a positive sensitivity, meaning an increase in parameter value corresponds to an increase in the response value.
Figure 4. Normalized sensitivity values of material properties.
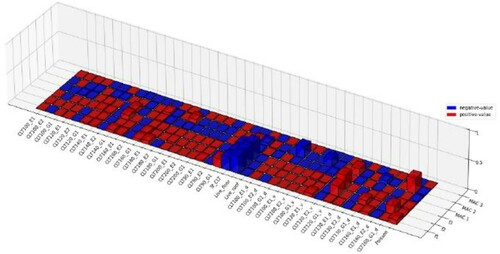
Table 3. Reference (seed) properties for CLT elements*.
Table 4. Seed values for loads and material density.
Equation 5 represents the sensitivity matrix in which ∂R denotes the difference in measured and numerical data and ∂P the variation in parameter.
(5)
(5) If the sensitivity matrix [S] is evaluated for M parameters in relation to N different responses, then [S] is N by M in dimension, Equation 6:
(6)
(6)
The adopted numerical perturbation technique requires results from multiple iterative FE analyses to determine sensitivity matrix coefficients, Equations 7 and 8 (Mordini et al. Citation2017).
(7)
(7)
(8)
(8)
Material properties and loading scenarios are the dominant factors affecting modal stiffnesses and modal masses, and therefore the mode orders and natural frequencies. Several parameters were tested to ensure response characteristic estimates during the FE model updating approach converged toward experimentally derived values for the first three vibration modes. Close attention was placed on the modal order because initially predicted second and third mode shape orders were the reverse order to those measured. As discussed in Section 3.5, modes 1 and 2 have lateral sway parallel to a plan axis deformation shapes and mode 3 has a torsion about the vertical building axis deformation shape. Also, to note is the three modal frequencies are quite clustered.
It was observed that whilst most of the seed values in and had insignificant influences on the modal order, G1 the shear moduli along parallel to the face laminations direction (direction-1), had a strong influence on sensitivity of the system to material parameters. shows which of the sixteen input material properties had a model updating effect greater than 1%. Detailed interpretation of the sensitivities determined that each type of wall had an influence proportional to their contribution to the total volumes of walls involved in a mode shape. Consequently, more prevalent wall types exert the largest sensitivity effects (e.g. CLT 120 v and CLT 90). As would be expected, the positioning of various walls on plan impacts model sensitivity to their properties (e.g. CLT 90 and CLT 120v). For mode 3 walls relatively far from the centre of stiffness of the entire system had a significant impact in comparison with walls closer to the centre of stiffness. For that mode, the stiffness centre is approximately in the middle of the building plan, because of the symmetry in the approximate symmetry of the plan. Therefore, the G1 of CLT 120v greatly impacted the modal frequency, whilst G1 of CLT 160 had relatively little impact on the modal frequency.
Table 5. Initial and updated parameter values with an absolute change greater than 1.0% during sensitivity analyses.
3.4. Model updating
Performance of the updated model was evaluated using a cost function implementing both Modal Assurance Criteria (MAC) and an Eigenfrequency Deviation Criterion (fdev), Equation 9 (Mottershead and Friswell Citation1995). The exact correlation between FE and measured results would result in a Cost (C) of zero. Both MAC and fdev were calculated in each model iteration. Subscript a in Equations 9 and 10 indicates analytical values from the FE model, while subscript e indicates measured values, and n is the number of eigenfrequencies considered (n = 3). MAC varied between 0.0 and 1.0, with unity corresponding to the physical situation of mode shapes being scalar multiples of one another. An fdev of zero would signify the exact agreement between model and measured eigenfrequencies.
(9)
(9) In Equation 9
(10)
(10)
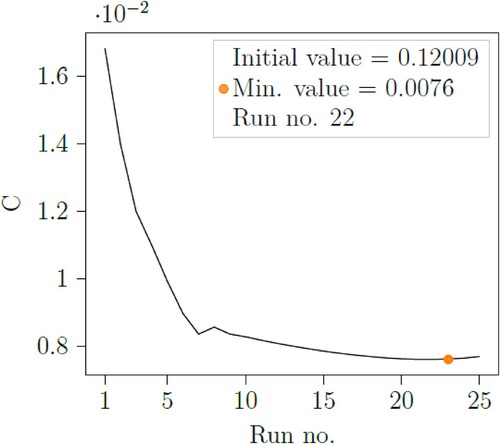
The particle Swarm Optimization (PSO) is the global optimization algorithm used for minimizing the discrepancy between experimental and numerical modal parameters. shows the convergence of C towards a minimum achieved in the 22nd model run. Updated model parameter values and corresponding system responses reported here are for that 22nd run. In general terms, C equal to 0.0076 indicates an updated FE model in excellent agreement with the characteristics of a reference structure. That said, there exist minor model inaccuracies for reason expounded on in Section 3.5.
Figure 5. Convergence of the cost function during model updating.
3.5. Numerical model verification
As previously indicated, experimental data were used to verify the FE model of the reference building (Aloisio et al. Citation2020), based on ambient vibration measurements. Characteristics of stable modes with natural frequencies up to 10 Hz were extracted (Aloisio et al. Citation2020). The discussion here is focused on the first three because those represent the most energetic sway and torsion modes. This may not suffice for analysis of taller or more complex superstructure shapes but suffices for the present discourse.
and compare the FE model with measured natural frequencies and shapes of modes 1–3. A comparison of test and updated FE model results shows the FE predictions of natural frequencies and associated modal shapes are generally accurate. Overestimation of the mode 2 natural frequency is mostly attributable to the neglect of the contribution of end-wall non-CLT materials adjacent to the communal corridor space present in each storey make to the modal stiffness. Non-CLT wall construction elements undoubtedly added substantially to the stiffness observed during low-amplitude ambient vibration measurements, and in that context allowing for their presence in the FE model would be scientifically appropriate. However, in other case, allowing for their presence would not be appropriate from a structural engineering perspective, which highlights for example need to consider which elements to include in FE models supporting wind design SLS design versus ULS seismic design analyses. Other more minor discrepancies observed between numerical and test measured values are effects of simplifying representations of influences the presence of doors and windows have on behaviours of CLT shear-walls, neglecting the presence of minor material or construction imperfections, and ignoring minor differences between real and model superstructure and wall anchoring conditions. Overall, the authors consider the obtained balance between FE model accuracy and computational efficiency an acceptable basis for applying the presented modelling techniques to other platform-construction CLT buildings.
Figure 6. FE model versus experimental mode shapes.
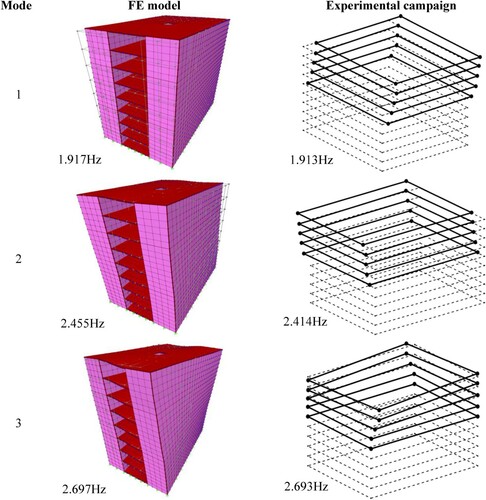
Table 6. FE models versus experimental natural frequencies.
4. Assessment of influence of construction features
4.1. Effect of connector elements
As studies have shown, wall-to-floor connectors play an important role in performance of CLT-LFRS (Follesa et al. Citation2013, Inel et al. Citation2019, Mugabo et al. Citation2019, Farsangi et al. Citation2020, Aloisi et al. Citation2021). Under high-amplitude cyclic displacements, metal connectors absorb energy flowing through them by plastic and other non-linear deformation of those connectors and fasteners connecting them to CLT. Under the investigation of the reference Palisaden building, ambient excitation of that structure did not damage any connectors or other structural components. In the study, the shear wall connectors are included in the model as zero-length linear link elements, acting as springs with a given stiffness between two nodes in all the six degrees of freedom of the three-dimensional space. The procedure of applying the link elements is shown schematically in . The macro element model is adapted as described in the nodes of wall and slab panels are adjusted so that they no longer coincide, with an added thickness of half of the slab thickness between them. Furthermore, the slab nodes and wall nodes are connected with the link elements, based on experimental connector stiffness values ( and ). All hold-down brackets are considered to have similar or equal stiffness properties and will mainly provide stiffness in the tensile direction. The configuration of angle brackets consists of various types of sections () and mainly contributes to stiffness in the shear and tensile directions. The links are placed in accordance with provided production drawings, with the hold-downs located on the outer edges of the shear wall panels, and the angle brackets located in the middle. All hold-down brackets of corner walls are simplified to be located at the same point, having the sum of reference stiffness from all nearby hold-downs. For this reason, HD4 and HD5 exist.
Figure 7. Schematic of wall-to-floor link objects.
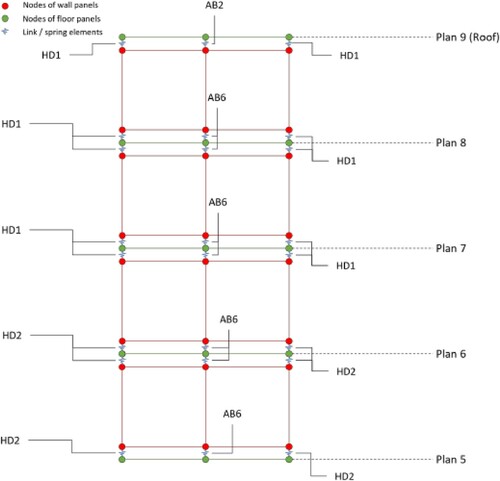
Table 7. Stiffness of angle bracket and hold-down anchors in FE analyses.
Table 8. Overview of the types of angle brackets employed in the FE analyses.
To calculate the reference value of stiffness to be applied to the different types of link elements, the results of experimental analysis from Gavric et al. (Citation2015) are used. For the angle brackets, a linear relationship between the number of screws and stiffness value is assumed, and the values for tensile and shear stiffness are estimated by Equation 11:
(11)
(11) where ka is the analytical stiffness value to be computed, kexp is the experimental stiffness value from (Gavric et al. Citation2015), na is the number of nails used in the analytical connector, and nexp is the number of nails used in the experiment.
As the dimensions of the hold-down brackets are approximately equal throughout the building, the reference value for corresponding tensile stiffness is estimated as a multiplication of a number of hold-down brackets acting in the point of interest, based on the experimental values calculated from Gavric et al. (Citation2015). To ensure the structural stability of structural objects, a large value of stiffness is attributed to all link objects in the out-of plane translational direction. As mentioned earlier, and specify the locations of the different connector types.
Further sensitivity analysis was conducted for the new connector parameters. The sensitivity for each parameter is calculated for each response, which provides 6 individual sensitivities for each parameter. The individual normalized sensitivities are provided in . The values of the MAC sensitivities are not scaled in the figure, as they were in the previous analysis. The blue colour corresponds to a negative sensitivity value; therefore, an increase in parameter value decreases the response value. The red colour corresponds to the opposite; a positive sensitivity value, therefore an increase in parameter value increases the response value. The taller the box, the more response is sensitive to a change in the parameter.
Figure 8. Normalised sensitivity values for connector parameters.
Updating the FE model discussed in Section 3.4 had little impact on the modal natural frequency predictions (Aloisio et al. Citation2020). Speculatively, influences of the masses, stiffnesses and geometric arrangements of shear-walls are more dominants than connections of modal characteristics of medium-rise CLT buildings in general.
4.2. Effect of variations in building footprint
The FE calibrated model is extended here to assess influences variations in the plan geometry and mass of CLT buildings has on the ordering and nature of lower order natural frequencies and mode shapes. Eurocodes and other codes giving guidance on seismic design of buildings using Force-Based Design (FBD) and Performance-Based Design (PBD) approaches (European Committee for Standardization Citation2004b, American Society of Civil Engineers Citation2010, Bureau of Indian Standards Citation2016) require consideration of modes contributing 90% mass participation to motions caused by design-level ground accelerations. Therefore, here modal analyses address how building plan modifications and associated gravitational mass variations affect the number of modes which contribute to 90% mass participation. Ancillary questions related to the ordering of mode types (e.g. sway and torsional) are simultaneously addressed, as is the potential for amplification of motion in particular motion frequency bands (Ussher Citation2017).
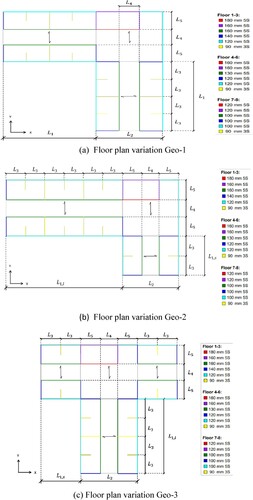
As described in , a Python script was constructed to create FE numerical models corresponding to different building plan geometries. The Python script is a two -step technique in which the first employs an algorithm which creates a three-dimensional grid with nodes at each point. The second step inputs a wall-setup matrix, applies thin orthotropic shell elements between specified nodes, and inputs updated elastic properties as determined appropriate from the study of the reference building. Plan geometries were selected with the intent to create significant eccentricities between the centres of mass and centres of rigidity via the inclusion of plan irregularities. Selected footprints are follows: A right-angle shape with equal lengths legs (Geo-1, (a)); A right-angle shape with different length legs (Geo-2, (b)); and a T-shape (Geo-3, (c)). Floor area per storey, number of storeys, and floor-to-floor height of all variants are the same as for the reference building. The specifications of the walls, floors and connections are also kept the same as for the reference building. These decisions effectively made the effects of varied parameters independent.
Figure 9. Variations in building footprint.
4.2.1. Natural frequencies and mode sequencing
demonstrates a comparison of the first five predicted natural frequencies for the reference and other buildings. The first key observation to be made is that the sequencing of types of modes is the same for all cases investigated, which is attributed to the CLT floors of the particular structures acting as rigid diaphragms. This highlights the importance of coordinating the selection of floor and wall construction materials and methods. It also highlights the need to define for purposes of FE modelling when engineers may or may not assume diaphragms will behave rigidly (as is done in Reinforced Concrete, Structural Steel or Steel-Concrete Composite design). The generality of findings here should not be presumed, as discussed in Section 3.5.
Table 9. Effects of variations of plan geometry on natural frequencies and mode types.
The second key observation to be made based on is natural frequencies for low-order modes tend to be higher for irregular plan buildings, except for mode 2 of building type Geo-3. Third to note is frequency separations between natural frequencies follow no set pattern. Correct overall interpretation of results in is an empirical extrapolation of judgements about the acceptability of the seismic performances of one or a few buildings to infer likely performances of other buildings are unreliable. This leads to the conclusion that equivalent static design or prescriptive design requirements are unreliable ways to design mid-rise CLT buildings to resist the damaging effects of earthquakes.
4.2.2. Contribution of modes to 90% mass participation
compares the number of modes contributing towards 90% mass participation in both orthogonal plan directions during modal analyses. Altering the plan geometry from a pure rectangular footprint to other shapes reduces the number of modes likely to reduce motion amplification during dynamic disturbances. A necessary note of caution is that the finding here may not apply to taller and more slender builders or to buildings with three-dimensional sculpted shapes for which the gravitational centres of storeys do not align vertically. When motion components associated with torsion modes contribute significantly to horizontal motions of floors, architects and engineers will need to take that into account, because aggregated motion accelerations experienced by building occupants during extreme conditions could vary greatly. The potential for damage to structural or non-structural elements could also vary greatly. From an engineering design practice perspective, the key message from analyses summarized in is that simplified analyses based on consideration of only lateral sway of the building are not robustly reliable for wind or seismic design scenarios.
Table 10. Number of modes contributing to 90% mass participation.
4.2.3. Effect of varying the eccentricity on building with footprint Geo-1
(a) illustrates the variation of eccentricity with the corresponding developed masses, and (b) shows the variation of the eccentricity with the first three natural frequencies of the identified modes for the building with footprint Geo-1. The eccentricity defined as the distance between the centre of gravity of masses and stiffnesses is varied by additional masses due to increases in wall volumes since the chosen plan area (Geo-1) in m2 is kept constant. To enforce a change in eccentricity between centre of mass and centre of rigidity, the lengths of certain walls are elongated. This is obtained through changing the geometry of the original grid of nodes, enabled by iterations with the Python script to capture a variety of eccentricities.
Figure 10. Variations in eccentricity versus corresponding masses and natural frequencies, respectively.
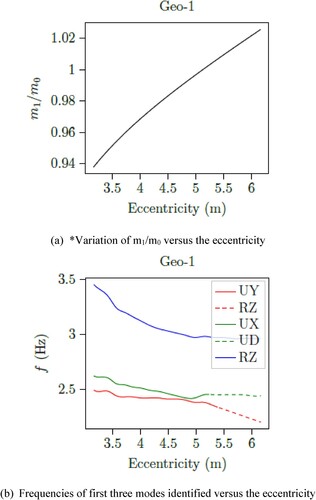
For each variation of the eccentricity, the mass is normalized to the updated mass associated with the original geometry, m0 of the Geo-1 footprint. Thus, the mass variation ranged from a minimum of 94% to a maximum 1.02% of the original mass, leading to a weight variation from about 11,200 to 12,100 kN (ΔWeight = 900 kN). In (b), a dotted line follows the variations in the mode shapes. UX is a translational mode shape in the x-direction, UY is a translational mode shape in the y-direction, UD is a translational mode shape in the diagonal (UX + UY) direction, and RZ is a torsional mode shape along the z-direction.
As shown in , an increase in eccentricity results in increased redistribution of masses without corresponding increases in modal stiffnesses, thereby reflecting decreases in the first three natural frequencies. A practical design implication is that both architectural and structural engineering design choices of CLT buildings should ensure construction features, including building footprint, shear walls and other lateral force resisting systems (LFRS) that limit eccentricities. It may also be observed that up to a 5 m eccentricity, the UX and UY-modes portray a relatively linear reduction in frequency. At the same time, the RZ-mode displays an exponential reduction in frequency. From eccentricity beyond about 5 m, some peculiar phenomena arise; the frequencies of the RZ-mode start to flatten, while the second mode changes shape from UX to UD and the first mode change shape from UY to RZ. This change may imply that the UX and UY-modes have merged into a diagonal mode, while a new mode has occurred at about the same time. The above discussions suggest that simplified empirical formulas may not be adequate in predicting the dynamic performance of such structures. Therefore, a complete dynamic analysis incorporating all design variables is recommended for platform-type CLT buildings.
5. Conclusions
Using Finite Element model simulation techniques is a viable cost-effective alternative to expensive field measurements for determining vibration characteristics of mid-rise CLT buildings.
The approach also has additional advantages of predicting how architectural and engineering design decisions will influence dynamic responses of buildings that have not been constructed to everyday ambient dynamic forces or forces generated by extreme events like earthquakes. Modelling techniques described here yield results in close agreement with measured characteristics of an 8-storey building in Norway. Those techniques show that flexible connections between wall and horizontal CLT elements should be accounted for in engineering design calculations. This is because the presence of metal shear connectors and tie-down anchors in connections alters natural frequencies and mode shapes.
What is presented here is a reliable basis for making design decisions for individual CLT project designs and for assessing or establishing generalized rules for structural design codes.
Acknowledgements
The authors are very grateful to Professor Emeritus Dr Ian Smith, University of New Brunswick for providing editorial suggestions.
Disclosure statement
No potential conflict of interest was reported by the author(s).
References
- Aloisio, A., Boggian, F., Tomasi, R. and Fragiacomo, M. (2021) The role of the hold-down in the capacity model of LTF and CLT shear walls based on the experimental lateral response. Construction and Building Materials, 289, 123046.
- Aloisio, A. and Fragiacomo, M. (2021) Assessment of the seismic response of CLT shear walls using the EEGBW, a Bouc–Wen class predictive model. Infrastructures, 6, 55. doi:10.3390/infrastructures6040055
- Aloisio, A., Pasca, D., Tomasi, R. and Fragiacomo, M. (2020) Dynamic identification and model updating of an eight-storey CLT building. Engineering Structures. doi:10.1016/j.engstruct.2020.110593.
- American National Standards Institute (ANSI) (2012) Standard for Performance Rated Cross-Laminated Timber, Standard ANSI/APA PRG 320-2012 (New York, NY: ANSI), p. 29.
- American Society of Civil Engineers (2010) Minimum Design Loads for Buildings and Other Structures (ASCE Standard ASCE/SEI 7-10).
- Aranha, C. A. (2016) Experimental and Numerical Assessment of the Seismic Behaviour of Log and Cross-Laminated Timber Systems (Tech. Rep. Universidade do Minho Escola de Engenharia), p. 205.
- Buchanan, A. H. (2005) How will timber buildings help New Zealand meet the Kyoto protocol commitments? New Zealand Timber Design Journal, 13(1), 9–13.
- Ceccotti, A. (2008) New technologies for construction of medium-rise buildings in seismic regions: The XLAM case. Structural Engineering International, 18(2), 156–165.
- Computers and Structures, Inc. (CSI) (2014) SAP2000 API Documentation, Technical Knowledge (Berkeley, CA: SAP2000 Database).
- European Commission: Directive of the European Parliament and of the Council (2021) On the Energy Performance of Buildings (Recast). Brussels COM (2021) 802 final 2021/0426 (COD).
- European Commission: Directorate General-Joint Research Centre. (2006) Urban Sprawl in Europe: The Ignored Challenge. Copenhagen. EEA Report No. 12/2006.
- European Committee for Standardization (2004a) (2004) EN 1991-1-1 (English): Eurocode 1: Actions on Structures – Part 1-1: General Actions – Densities, Self-Weight, Imposed Loads for Buildings (The European Union).
- European Committee for Standardization (2004b) (2004) EN 1998-1 (English): Design of Structures for Earthquake Resistance – Part 1: General Rules, Seismic Actions and Rules for Buildings (The European Union).
- Farsangi, E. N., Bogdanovic, A., Rakicevic, Z. T. and Poposka, A. (2020) Ambient vibration testings and field investigations of two historical buildings in Europe. SDHM Structural Durability and Health Monitoring, 14(4), 283–301. doi:10.32604/sdhm.2020.010564
- Follesa, M., Christovasilis, I., Vassallo, D., Fragiacomo, M. and Ceccotti, A. (2013) Seismic design of multi-storey clt buildings according to Eurocode 8. Ingegneria sismica. International Journal of Earthquake Engineering, Special Issue on Timber Structures, 30(4), 27–53.
- Folz, B. and Filiatrault, A. (2004a) Seismic analysis of woodframe structures I: Model formulation. Journal of Structural Engineering, 130, 1353–1360. doi:10.1061/(ASCE)07339445(2004)130:9(1353)
- Folz, B. and Filiatrault, A. (2004b) Seismic analysis of woodframe structures. II: Model implementation and verification. Journal of Structural Engineering, 130, 1361–1370. doi:10.1061/(ASCE)0733-9445(2004)130:9(1361)
- Gavric, I., Fragiacomo, M. and Ceccotti, A. (2015) Cyclic behavior of CLT wall systems: Experimental tests and analytical prediction models. Journal of Structural Engineering, 141(11), 04015034.
- Inel, M., Ozmen, H. B. and Cayci, T. B. (2019) Determination of period of RC buildings by the ambient vibration method. Advances in Civil Engineering. Article ID 1213078. doi:10.1155/2019/1213078
- International Energy Agency (IEA) for the Global Alliance for Buildings and Construction (GlobalABC). (2019) Global Status Report for Buildings and Construction Towards a Zero-Emissions, Efficient and Resilient Buildings and Construction Sector. ISBN No: 978-92-807-3768-4.
- IS:1893:2016 (2016) Criteria for Earthquake Resistant Design of Structures. New Delhi: Bureau of Indian Standards. Available at, https://archive.org/details/1893Part1.
- Izzi, M., Casagrande, D., Bezzi, S., Pasca, D., Follesa, M. and Tomasi, R. (2018) Seismic behaviour of cross-laminated timber structures: a state-of-the-art review. Engineering Structures, 170, 42–52.
- Mordini, A., Savov, K. and Wenzel, H. (2017) The finite element model updating: A powerful tool for structural health monitoring. Structural Engineering International: Journal of the International Association for Bridge and Structural Engineering (IABSE), 17(4), 352–358. doi:10.2749/101686607782359010.
- Mottershead, M. I. and Friswell, J. E. (1995) Finite element model updating in structural dynamics. Solid Mechanics and Its Applications, 38, 282. doi:10.1007/978-94-015-8508-8.
- Mugabo, I., Barbosa, A. R. and Riggio, M. (2019) Dynamic characterization and vibration analysis of a four-story mass timber building. Frontiers in Built Environment, 5(86). doi:10.3389/fbuil.2019.00086
- Polastri, A., Izzi, M., Pozza, L., Loss, C. and Smith, I. (2019) Seismic analysis of multi-storey timber buildings braced with a CLT core and perimeter shear-walls. Bulletin of Earthquake Engineering, 17, 1009–1028. doi:10.1007/s10518-018-0467-9.
- Reynolds, T., Casagrande, D. and Tomasi, R. (2016) Comparison of multi-storey cross laminated timber and timber frame buildings by in situ modal analysis. Construction and Building Materials, 102, 1009–1017. doi:10.1016/j.conbuildmat.2015.09.056.
- Rivera, H. A., Martinez, J. P. and Lozano, J. A. (2015) Translation of SAP2000 Models to Equivalent-Models for Finite Element, Command-Based Softwares, 37–48. ISSN: 2007-5197. https://www.researchgate.net/publication/294736454.
- Sandoli, A., D’Ambra, C., Ceraldi, C., Calderoni, B. and Prota, A. (2021) Sustainable cross-laminated timber structures in a seismic area: Overview and future trends. Applied Sciences, 11, 2078. doi:10.3390/app11052078
- Santaella, B. L. and Tseng, Z. J. (2019) Hole in one: An element reduction approach to modeling bone porosity in finite element analysis. PeerJ, 7, e8112. doi:10.7717/peerj.8112
- Smith, I. and Frangi, A. (2014) Structural Use of Timber in Tall Multi-Storey Buildings. Structural Engineering Document 13. Zurich: International Association for Bridge and Structural Engineering, p. 19.
- Tannert, T., Follesa, M., Fragiacomo, M., González, P., Isoda, H., Moroder, D., Xiong, H. and van de Lindt, J. W. (2018) Seismic design of cross-laminated timber buildings. Wood and Fiber Science, doi:10.22382/WFS-2018-037. Corpus ID: 73545001.
- Timoshenko, S. and Woinowsky-Krieger, S. (1959) Theory of Plates and Shells (2nd ed.). (New York: McGraw-Hill, Classic Textbook, Re-Issued 1987).
- Ussher, E. (2017) Vibration Serviceability Design Analysis of Lightweight Timber Slabs. PhD thesis, Faculty of Forestry and Environmental Management, University of New Brunswick, Fredericton, Canada.
- Van Rossum, G. and Drake, F. L. (2009) Python 3 Reference Manual (Scotts Valley, CA: CreateSpace).
- Wallner-Novak, M., Koppelhuber, J. and Pock, K. (2014) Cross-Laminated Timber Structural Design. proHolz Austria, p. 191. www.proholz.at.
- Weckendorf, J., Ussher, E. and Smith, I. (2016) Dynamic response of CLT plate systems in the context of timber and hybrid construction. Composite Structures, 57, 412–423.
- Worth, M., Gaul, A., Jager, S., Omenzetter, P. and Morris, H. (2012) Dynamic Performance Assessment of a Multi-Storey Timber Building via Ambient and Forced Vibration Testing, Continuous Monitoring and Finite Element Model Updating (Tech. Rep. Department of Civil and Environmental Engineering, The University of Auckland).