
ABSTRACT
Analyzing shifts in the delivery mode of 12 municipal services between 2010 and 2018, in about 41% of the observations, shifts took place, with 54% toward outside production and 46% toward inside production. In the physical domain, most shifts were to cooperation, whereas in the operational domain reverse privatization and also cooperatization are dominant trends. Based on logit models, for services with high asset specificity, we find a lower likelihood of change, whereas for services with high measurement difficulty, we find a higher likelihood of change to outside and away from in-house, and a lower likelihood of change to inside.
Policy Highlights
The use of inter-municipal cooperation and to a lesser extent of municipality-owned firms increased significantly between 2010 and 2018.
In-house production and the use of private firms declined between 2010 and 2018.
There are large differences between shifts in services from the physical and the operational domain.
1. Introduction
In local government, contracting out of municipal services has been important as a reform to promote efficiency. In the United States and Europe, contracting out is a long-standing practice; in fact, many municipal services began with private delivery of such services and shifted to public provision during the twentieth century. In the literature, especially the case of garbage collection has been studied at length, which is partly due to data availability. Already in 2006, Bel and Costas (Citation2006) indicated that privatization had become “rusty” and concluded for Catalonian garbage collection that local reforms already implemented may have almost completely exploited economies of scale. Therefore, even for garbage collection, efficiency gains were hard to realize as local government markets are noncompetitive and have large transaction costs (Bel, Fageda, and Warner Citation2010; Dijkgraaf and Gradus Citation2007). As a reaction, alternatives such as inter-municipal cooperation and municipality-owned firms were explored in the beginning of this century (Tavares Citation2017; Voorn, van Genugten, and van Thiel Citation2017).
Analyses of shifts in the delivery mode of local services in the U.S. over time show not only that privatization and contracting out are important phenomena, but also that reverse privatization and contracting in occur and have over time become more important. Based on the five-yearly International City/County Management Association (ICMA) survey of U.S. local delivery of 67 services, Hefetz and Warner (Citation2004) found that 18% of services in 1997 were new contracts, and 11% had been contracted back-in since 1992. However, in the period 1997–2002, these proportions flipped and “reverse contracting,” or bringing contracted work back in-house, was preferred (see Hefetz and Warner Citation2007). In two more recent investigations, Warner and Hefetz (Citation2012) and Warner (Citation2016) showed that for the periods 2002–2007 and 2007–2012, respectively, reverse contracting and new contracting out were almost evenly matched.
In Europe, since the 1980s, also due to fiscal pressure, municipal provision of many public services has been privatized, but in the last decade, there is increasing evidence of trends in the opposite direction, also for services other than garbage collection. Hall, Lobina, and Terhorst (Citation2013) claim that at the beginning of this century, there was extensive remunicipalization in the water sector in France and the energy sector in Germany, which can be analyzed as a “pendulum” reflecting political struggles. Moreover, in the United Kingdom, Finland, and recently the Netherlands, government’s cleaning contracts were brought in-house. However, this evidence is anecdotal and the authors point out that empirical studies of remunicipalization across different sectors and different kinds of services can be helpful to advance the practical knowledge of policymakers.
Recent empirical research in the Netherlands, the country this study focuses on, has shown that there is also a trend in the form of increased use of municipality-owned firms (corporatization) (Gradus and Budding CitationIn Press). By analyzing the patterns over time in changes in the modes of production for garbage collection in Dutch municipalities in the period between 1999 and 2014, they show that in approximately half of these entities, shifts took place, with 61% toward outside production and 39% toward inside production. Remarkably, almost 38% of the shifts were in the form of corporatization. Another trend was the increased use of inter-municipal cooperation (cooperatization) with 25% of the shifts. Moreover, reverse privatization was favored more than privatization and in recent years (in particular after 2010), the number of shifts dropped remarkably. Demuth, Friederiszick, and Reinhold (Citation2018) investigated shifts in garbage collection in Germany between 2003, 2009 and 2015. Similar to Gradus and Budding (CitationIn Press), they found that switching occurred more often between 2003 and 2009 than between 2009 and 2015, namely 10% versus 5%. They focused on in-house/no-in-house shifts and found that in 2003–2009, 85% of the shifts were toward in-house and in 2009–2015 93%, and showed there was more insourcing in concentrated markets (measured by a Herfindahl–Hirschman index). Regarding concentration, the average declined slightly from 2003 to 2009 and increased substantially from 2009 to 2015. In addition, based on 2000–2006 data for Catalonia, Bel and Fageda (Citation2011) showed an increase in HHI as well and found evidence that large firms are increasing their market share, especially in metropolitan areas.
The purpose of this paper is to extend the empirical analysis of shifts in the delivery mode of services other than garbage collection in the Netherlands. In doing so, we build on Schoute, Budding, and Gradus (Citation2018), who focused on municipalities’ choices of service delivery modes for 12 municipal services, ranging from “garbage collection” to “parking management”, in the Dutch local government setting. They chose these particular services as previous studies had shown that these are most often subject of contracting out decisions and found that, on average, 62% of the 12 services were organized in-house, 9% carried out within an inter-municipal cooperation, 6% contracted out to a municipality-owned firm, and 23% contracted out to a private firm. Also, they investigated the influence of service, political, governance, and financial characteristics on these choices and showed that service and governance characteristics are important elements in contracting out decisions.
For this study, we again surveyed all Dutch municipalities in 2018, providing us the opportunity to identify shifts in the delivery mode of the 12 services in 20 of these municipalities between 2010 and 2018. Interestingly, in these municipalities, on average, 47% of the 12 services is in 2018 organized in-house, 24% carried out within an inter-municipal cooperation, 13% contracted out to a municipality-owned firm, and 17% contracted out to a private firm. In 2010, these percentages were, respectively, 58%, 8%, 8%, and 26%. So, cooperation and municipality-owned firms have become more important, and in-house and private firms have become less important. Similar to Hefetz and Warner (Citation2012), Gradus, Dijkgraaf, and Wassenaar (Citation2014), and Gradus and Budding (CitationIn Press), based on logit models, we also analyze the relationships between several service and municipal characteristics and these shifts in delivery mode. For services with high asset specificity, we find a lower likelihood of change, and for services with high measurement difficulty, we find a higher likelihood of change to outside and away from in-house, and a lower likelihood of change to inside (especially in the form of reverse privatization). In addition, for municipalities with a higher average income and less debt, we find a higher likelihood of reverse privatization. This paper thus contributes to the literature by (a) analyzing shifts in the delivery mode of 12 services (as opposed to only garbage collection) in Dutch local government between 2010 and 2018, and (b) providing some evidence of relationships between service and municipal characteristics and these shifts in delivery mode.
The remainder of this paper is structured as follows. First, in section 2 we describe the shifts in municipal service management over time. This is followed by section 3 “Model and data”. A logit analysis explaining the shifts is presented in section 4. Some concluding remarks and topics for future research are offered in section 5.
2. Shifts in municipal service management
Our data are collected from multiple sources. First, we conducted a multi-purpose survey among 426 Dutch municipalities in 2010.Footnote1 A total of 87 municipalities returned the questionnaire, of which one was unusable, providing a usable response rate of 20.2%. Second, we conducted a multi-purpose survey among all 380 Dutch municipalities in 2018. A total of 120 municipalities returned the questionnaire, of which seven were unusable, providing a usable response rate of 29.7%. As we are interested in shifts, we only used the data for the 20 municipalities that participated in both 2010 and 2018, and analyzed which shifts took place in these municipalities between these years. Although this represents only somewhat more than 5% of all Dutch municipalities, given that these municipalities are well dispersed in terms of major characteristics such as number of inhabitants and geographical regions, we believe this sample is quite informative of the choices of service delivery modes, and shifts therein, in the Dutch local government setting more generally. In addition, our results are in line with Gradus and Budding (CitationIn Press), where only garbage collection was investigated.
In principle, we could have had 240 observations (20 municipalities multiplied by 12 services), but due to missing values, we actually have 206 observations. These missing values are mostly due to the fact that some municipalities do not have certain services (in particular, catering, cafeteria, and parking management). We distinguish between four service delivery modes: in-house, inter-municipal cooperation, municipality-owned firm, and private firm (due to data availability for 2010). From a legal perspective, in-house production and inter-municipal cooperationFootnote2 are subject to public law, whereas a municipality-owned firm and a private firm are subject to private law (Gradus, Dijkgraaf, and Wassenaar Citation2014). Municipal-owned firms thus operate under Dutch private law, while their shares are fully owned by municipalities.
2.1. Shifts in service delivery modes
Our longitudinal dataset makes it possible to measure shifts over time. Similar to Gradus, Dijkgraaf, and Wassenaar (Citation2014) and Hefetz and Warner (Citation2004), a transition matrix is constructed, as shown in , where the mode of production is ordered from left to right (and from top to bottom) toward outside production. This method enables us to compare stability in the form of service delivery and to assess shifts, whether toward outside production or toward inside production.Footnote3
Table 1. Number of services switching mode, all domains
As shown in , overall, the use of inter-municipal cooperation (and to a lesser extent, of municipality-owned firms) increased significantly between 2010 and 2018, whereas in-house production and the use of private firms declined. In 121 of the 206 services, the mode of production did not change (this figure is the sum of the numbers on the diagonal). Thus, there were 85 switches (i.e. 41%), of which 46 (54%; italics in the table) were toward outside production, and 39 (46%; bold in the table) were toward inside production.Footnote4 If we take a closer look at the shifts, we see that especially shifts to inter-municipal cooperation (i.e. 37) and in-house production (i.e. 20) took place. This is different from Gradus and Budding (CitationIn Press), who found that shifts to municipality-owned firms were the dominant trend. However, they investigated only one service from the physical domain (namely, garbage collection). Interestingly, most of the shifts to inter-municipal cooperation by far came from a change to this mode from in-house production, whereas most of the shifts to in-house production by far came from a change to this mode from private firms.
In the Netherlands, local government is seen as the most important and visible level of decentralized government (Gradus and Budding CitationIn Press). Local government has a more citizen-oriented focus compared to national or provincial government. Moreover, in 2015, various public responsibilities, such as home care and support for the elderly and disabled, have been transferred from the central to the local government level. In 2018, municipalities have a budget of about 7% of gross domestic product (GDP) and 20% of government spending. Besides the social domain (which is excluded due to lack of data in 2010Footnote5), the physical domain, with services such as maintenance of roads and green and garbage collection, is important. Furthermore, municipalities have considerable autonomy concerning how they organize the back office of their local service provision (i.e. the operational domain). When analyzing the shifts, we therefore have made a distinction between services in the physicalFootnote6 and the operational domain.Footnote7 In , the number of services from the physical domain switching mode is reported, and in , the number of services from the operational domain switching mode.
Table 2. Number of services switching mode, physical domain
Table 3. Number of services switching mode, operational domain
Interestingly, there are large differences between the physical and the operational domain. Similar to Gradus and Budding (CitationIn Press), in the physical domain shifts to municipality-owned firms and to private firms are important. Remarkably, also shifts to inter-municipal cooperation can be observed frequently. In the operational domain, however, shifts to in-house production and inter-municipal cooperation are more important than shifts to municipality-owned firms. Also note that in the operational domain, shifts to private firms are almost non-existing and that the use of private firms has decreased from 37 in 2010 to 16 in 2018.
shows the number of shifts to the four service delivery modes (from any other mode) as a percentage of the total number of shifts between 2010 and 2018. We label these four shifting (to) trends “in-housesation”, “cooperatization”, “corporatization”, and “privatization”, respectively.
Figure 1. Percentages of shifting trends (2010–2018)
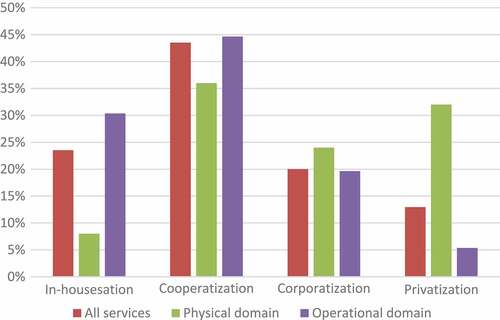
For all 12 services, cooperatization (with 44% of the shifts) is the most important trend. For the operational domain, this percentage is slightly higher (45%), and for the physical domain, it is slightly lower (36%). For the operational domain, also in-housesation (with 30% of the shifts) is important. For the physical domain, both privatization and corporatization (with, respectively, 32% and 24% of the shifts) are popular as well. Overall, remunicipalization (in-housesation and cooperatization) is more important in the operational domain than in the physical domain.Footnote8
shows the number of shifts from the four service delivery modes (to any other mode) as a percentage of the total number of shifts between 2010 and 2018. We label these four reverse shifting (from) trends “reverse in-housesation”, “reverse cooperatization”, “reverse corporatization” and “reverse privatization”, respectively.
Figure 2. Percentages of reverse shifting trends (2010–2018)
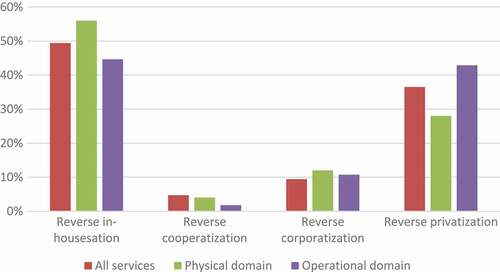
For all 12 services, reverse in-housesation (with 49% of the shifts) is the most important trend. For the physical domain, this percentage is slightly higher (56%), and for the operational domain, it is slightly lower (49%). For both domains, but especially for the operational domain (with 43% of the shifts in this domain), reverse privatization is important as well. Reverse cooperatization and reverse corporatization are less important.
3. Model and data
Similar to Warner and Hefetz (Citation2012), Gradus, Dijkgraaf, and Wassenaar (Citation2014) and Gradus and Budding (CitationIn Press), we apply logistic regression analysis to analyze the relationships between service and municipal characteristics and the shifts in the delivery mode of the 12 services in the period between 2010 and 2018. The dependent variable takes the value 1 for services for which the municipality changes the service delivery mode, and 0 otherwise. We focus on change, change to inside and change to outside, and on reverse privatization and reverse in-housesation.Footnote9 Therefore, five models are estimated, differing with respect to the direction of the shift. Our dependent variables are as follows: (a) change in service delivery mode in general (1 if delivery mode changes, 0 otherwise); (b) delivery mode change to inside (1 if delivery mode changes to more inside production, 0 otherwise); (c) delivery mode change to outside (1 if delivery mode changes to more outside production, 0 otherwise); (d) reverse privatization (1 if delivery mode changes from private production, 0 otherwise); and (e) reverse in-housesation (1 if delivery mode changes from in-house production, 0 otherwise).
Warner and Hefetz (Citation2012) showed that a constellation of factors including service characteristics, municipal characteristics, fiscal concerns and political preferences is important in determining shifts in service delivery modes. In order to deal with the limitation of our data that we do not know when the shifts have exactly taken place during the period 2010–2018, we only focus on characteristics that are relatively stable over time (which is why we, for example, exclude political preferences, given that there have been three elections during the period), and for the characteristics that we do focus on, calculate averages over the period. Therefore, we focus on two service and five municipal (output/scale and financial/wealth) characteristics.
3.1. Service characteristics
Similar to, for example, Warner and Hefetz (Citation2012) and Schoute, Budding, and Gradus (Citation2018), we are interested in two service characteristics: asset specificity and measurement difficulty. In December 2013 to January 2014, we sent a questionnaire to an expert panel of 30 Dutch municipal financial managers. We approached these managers as they are supposed to have a broad overview of the municipal services and the motives behind contracting out decisions. In total, 24 (80.0%) of these managers responded to this survey. In the questionnaire, we provided an extensive definition of the two transaction cost characteristics, which we based on those of Brown and Potoksi (Citation2005) (see also Citation2003), and asked respondents to rate each service on a five-point Likert scale for both asset specificity and measurement difficulty.Footnote10 We averaged the ratings across respondents to create an overall score for asset specificity and measurement difficulty for each service. reports the average service characteristic ratings for each of the 12 services.
Table 4. Average asset specificity and measurement difficulty ratings
As indicates, there is considerable dispersion of the average service characteristic ratings among the 12 services.Footnote11
3.2. Output/scale characteristics
We measure two output/scale characteristics: number of inhabitants and population density. The data for these variables are obtained from Statistics Netherlands. For both variables, we take the natural log in order to improve their distribution. The average number of inhabitants is approximately 27,000 (≈ e10.20), and the average population density is about 300 inhabitants per square kilometer (≈ e5.69).
3.3. Financial/wealth characteristics
We measure three financial/wealth characteristics: number of people with unemployment benefits (per 1,000 inhabitants), average income per household, and municipal debt per inhabitant. We include the number of people with unemployment benefits as a measure of labor market conditions. The data for these variables are obtained from Statistics Netherlands as well. The average percentage of people with unemployment benefits is about 1.96%, the average income per household is about € 40,150, and the average municipal debt per inhabitant is about € 2,580.Footnote12
3.4. Descriptive statistics
presents the descriptive statistics.
Table 5. Descriptive statistics
4. Model estimation results
In the logistic regression analyses, we cluster standard errors by municipality based on the assumption that their choices of service delivery modes are independent across municipalities but not within them (cf. Carr, LeRoux, and Shrestha Citation2009; Levin and Tadelis Citation2010; Schoute, Budding, and Gradus Citation2018). shows the estimation results for the different logistic regression models. As shown in , all five models are significant (all p < 0.01), with McFadden R2’s ranging between 7.90% and 23.7%.,Footnote13, Footnote14
Table 6. Logistic regression analysis results
For the service characteristics, the results show that as a service involves more asset specificity, the likelihood decreases that the municipality changes its service delivery mode. Assets specificity is negatively and significantly (at the 1% level) related to the likelihood of changing. In addition, asset specificity is also negatively and significantly (at the 10% level) related to the likelihood that the municipality changes its service delivery mode to outside. A possible explanation for these findings is that the changing of service delivery modes is a potentially costly undertaking (due to costs of required changes to production and management systems; e.g. Brown, Potoski, and van Slyke Citation2008), and that such transaction costs will typically be higher for more asset-specific services. Interestingly, for the other service characteristic, measurement difficulty, we obtain some opposing results. These results show that as a service is harder to measure, the likelihood increases that the municipality changes its service delivery mode to outside, whereas the likelihood decreases that the municipality changes its service delivery mode to inside. These findings are similar to those of Warner and Hefetz (Citation2012) for U.S. in- and outsourcing, and as explained by them (p. 320), may reflect “Stein’s (Citation1990) notion that governments will seek to contract out services that are difficult to measure […] in order to reduce the political burden they face in dealing with such problematic services.” For reverse privatization, the likelihood increases when measurement difficulty is lower, and for reverse in-housesation we find the opposite.
For the municipal (output/scale and financial/wealth) characteristics, we do not obtain very significant results. For the number of inhabitants, we only find a significant result (at the 10% level) for reverse in-housesation. Larger municipalities tend to re-inhouse less. For unemployment benefits, we only get a significant result (at the 10% level) for reverse in-housesation. Municipalities with a higher number of people with unemployment benefits show more shifts to in-house production. There is some anecdotal evidence that some municipalities insource cleaning and catering for such reason. Also, interestingly, when reverse privatization is investigated, the average income per household and municipal debt per inhabitant are significant (at the 1% and 5% level, respectively). Therefore, for relatively wealthy municipalities, we find an indication for reverse privatization. This is in line with Schoute, Budding, and Gradus (Citation2018).
5. Conclusion
We analyze shifts in the delivery mode of 12 services in 20 Dutch municipalities between 2010 and 2018. We distinguish between four service delivery modes, ranging from inside to outside production: in-house, inter-municipal cooperation, municipality-owned firm and private firm. Overall, among these 20 municipalities, the use of inter-municipal cooperation (and to a lesser extent, of municipality-owned firms) increased significantly between 2010 and 2018, whereas in-house production and the use of private firms declined.
In about 41% of the observations, shifts took place, with 54% toward outside production and 46% toward inside production. Interestingly, there are large differences between services from the physical and the operational domain. In the physical domain, with services such as maintenance of roads and green and garbage collection, most shifts were to cooperation, whereas in the operational domain, with services such as ICT, asset valuation and catering, reverse privatization and also corporatization are dominant trends. For both domains, also reverse in-housesation is important. Overall, remunicipalization (in-housesation and cooperatization) is more important in the operational domain than in the physical domain.
Based on logit models, we also analyze the relationships between several service and municipal characteristics and the shifts in delivery mode in terms of, respectively, change, change to inside, change to outside, reverse privatization and reverse in-housesation. For service characteristics, we used data from an earlier inquiry to measure two characteristics (asset specificity and measurement difficulty) for the Netherlands (Schoute, Budding, and Gradus Citation2018). Of course, due to the relatively small sample, these estimations have their limitations. Nevertheless, some interesting patterns are obtained. For services with high asset specificity, we find a lower likelihood of change, whereas for services with high measurement difficulty, we find a higher likelihood of change to outside and away from in-house, and a lower likelihood of change to inside (especially in the form of reverse privatization). In addition, for municipalities with a higher average income and less debt, we find a higher likelihood of reverse privatization.
There are many avenues for future research. First, we have a small sample of 20 municipalities and two points in time. It would be good to extend this sample at a later date and see how robust our conclusions are. This could especially be interesting for the physical domain as such shifts did not take place in all municipalities. Also, given that our findings may to some extent be influenced by how these municipalities have dealt with (the aftermath of) the fiscal crisis, it would also be good to conduct similar analyses for different (and preferably multiple) time periods. Moreover, a larger time period will give the opportunity to analyze political preferences and fragmentation of the municipal council (e.g. Gradus and Dijkgraaf Citation2019; Gradus and Budding CitationIn Press). Second, more attention can be paid to the social domain. For the social domain, we have only four shifts. Importantly, in 2015, a large decentralization of three governmental tasks in the social services domain to municipalities was carried out (taking up 18 billion euros in annual government spending). Currently, about 70% of municipal expenditure is social expenditure. Therefore, it would be interesting to repeat Schoute, Budding, and Gradus (Citation2018) based on the 2018 survey including the social domain. Third, we did not take local (market) conditions into account, such as the service delivery mode used by neighboring municipalities (e.g. contracting out may be easier if neighboring municipalities also use out-house providers) and market concentration of private firms. Earlier research on Dutch garbage collection has shown that high concentration in regions increases costs and therefore (partly) offsets the advantage of contracting out (e.g. Dijkgraaf and Gradus Citation2007; Gradus, Dijkgraaf, and Schoute Citation2016). Fourth, as many studies show that municipal management is a crucial factor in in- and outsourcing, it is important to investigate the role of the manager and include it in the model (Warner and Hefetz Citation2012). This requires a more thorough investigation of the motives for different trends such as cooperatization and reverse privatization (Wassenaar, Groot, and Gradus Citation2013).
Disclosure statement
No potential conflict of interest was reported by the authors.
Notes
1. This included all 430 municipalities at the time of research except the four largest. These municipalities were excluded because they have special legal, administrative and financial arrangements with the central government which do not apply to other Dutch municipalities (cf. Groot and Budding Citation2004).
2. Gradus, Dijkgraaf, and Wassenaar (Citation2014) distinguish between public WGR (Law on Common Arrangements) entities, where the executive board is directed by the mayors and aldermen of participating municipalities, and cooperation not in this form but executed by a neighboring municipality. Similar to Schoute, Budding, and Gradus (Citation2018), we combine them.
3. We define shifts (change) to inside as shifts toward more inside production (i.e. from inter-municipal cooperation, municipality-owned firm and private firm to in-house, from municipality-owned firm and private firm to inter-municipal cooperation, and from private firm to municipality-owned firm) and shifts (change) to outside as shifts toward more outside production (i.e. from in-house to inter-municipal cooperation, municipality-owned firm and private firm, from inter-municipal cooperation to municipality-owned firm and private firm, and from municipality-owned firm to private firm).
4. On average, the 20 municipalities changed the mode of production of 4.25 of the 12 services (SD = 2.07; range = 1–8). Their average number of switches toward outside production was 2.30 (SD = 1.92; range = 0–6), whereas their average number of shifts toward inside production was 1.95 (SD = 1.32; range = 0–5).
5. We only have data for shifts of the social security department (paying social benefits and providing help in finding a job). There are only four shifts (three from in-house to cooperation and one from cooperation to in-house). By legislation, municipalities are limited in their choices of service delivery modes for this domain.
6. The services in the physical domain are: garbage collection (residential solid waste collection); maintenance of roads (small infrastructural works, including street repair); green maintenance (maintenance of green areas, including tree trimming and planting); sport facilities (taking care of physical buildings for sport activities); and parking management (management of parking facilities, including parking lots and parking areas).
7. The services in the operational domain are: payroll administration (tasks involved in paying personnel); catering (food provision outside the canteen (in meeting rooms, etc.)); cafeteria (food provision inside the canteen); ICT (IT services); asset valuation (the valuation of real estate, especially for tax assessing); and cleaning (cleaning the municipal building(s)).
8. It should be noted that remunicipalization refers to shifts from the private law domain to the public law domain. Note that shifts from inter-municipal cooperation to in-house are almost non-existing.
9. Similar to Hefetz and Warner (Citation2004), we aimed to estimate models for the other potential dependent variables if these refer to either the first or the last “To” or “From” column or row (before ”Number of shifts”) of , as these are special cases of changes to inside or outside. However, for the shifts in terms of in-housesation and privatization, we consider the number of observations in the particular groups too small for a (statistically) powerful analysis.
10. The asset specificity scale was anchored by the words very low (scored 1) and very high (scored 5). Similarly, the measurement difficulty scale was anchored by the words very easy (scored 1) and very difficult (scored 5).
11. Overall, consistent with Brown and Potoksi (Citation2005), the two service characteristics are positively correlated (r = 0.375), indicating that services that are relatively difficult to measure also tend to involve more asset specificity.
12. Except for the service characteristics and average income per household, we have calculated all independent variables as the average over the years 2010, 2012, 2014 and 2016, because we do not know when exactly during the 2010–2018 period the shifts have taken place. We have calculated average income per household as the average over the years 2011, 2012, 2013, 2014, 2015 and 2016, because Statistics Netherlands changed their definition of this variable in the course of 2010.
13. Variance inflation factors (VIFs) indicate that multicollinearity is not a problem in these analyses (average VIF = 2.34; range between 1.16 (for asset specificity) and 3.99 (for number of inhabitants)).
14. In addition to these overall analyses, we have also estimated the logistic regression models for the physical and operational domains separately. These subgroup analyses mainly show that whereas for measurement difficulty the results are quite consistent between the two domains, this is not the case for asset specificity. We find significant negative effects of asset specificity on the likelihood of change, change to outside and reverse in-housesation for the operational domain, but not for the physical domain. This suggests that asset specificity especially decreases the likelihood of such changes for services from the operational domain. On the other hand, these subgroup analyses also show that average income per household has a significant positive effect on reverse privatization for the physical domain, but not for the operational domain, which suggests that average income per household especially increases the likelihood of such changes for services from the physical domain. Given the highly exploratory nature of these analyses, mainly due to the limitations of our dataset, we do not tabulate and further discuss the results in this paper; however, interested readers can obtain a document with these results upon request.
References
- Bel, G., and A. Costas. 2006. “Do Public Sector Reforms Get Rusty? an Empirical Analysis on Privatization of Solid Waste Collection.” Journal of Policy Reform 9: 1–24. doi:10.1080/13841280500513084.
- Bel, G., and X. Fageda. 2011. “Big Guys Eat Big Cakes: Firm Size and Contracting in Urban and Rural Areas.” International Public Management Journal 14 (1Re-municipalization of public services: Trend or hype? ): 4–26. doi:10.1080/10967494.2011.547746.
- Bel, G., X. Fageda, and M. E. Warner. 2010. “Is Private Production of Public Services Cheaper than Public Production? A Meta-Regression Analysis of Solid Waste and Water Services.” Journal of Policy Analysis and Management 29 (3Re-municipalization of public services: Trend or hype? ): 553–577. doi:10.1002/pam.v29:3.
- Brown, T. L., and M. Potoksi. 2005. “Transaction Costs and Contracting: The Practitioner Perspective.” Public Performance and Management Review 28 (3Re-municipalization of public services: Trend or hype? ): 326–351.
- Brown, T. L., and M. Potoski. 2003. “Transaction Costs and Institutional Explanations for Government Service Production Decisions.” Journal of Public Administration Research and Theory 13 (4Re-municipalization of public services: Trend or hype? ): 441–468. doi:10.1093/jopart/mug030.
- Brown, T. L., M. Potoski, and D. M. van Slyke. 2008. “Changing Modes of Service Delivery: How past Choices Structure Future Choices.” Environment and Planning C: Government and Policy 26 (1Re-municipalization of public services: Trend or hype? ): 127–143. doi:10.1068/c0633.
- Carr, J. B., K. LeRoux, and M. Shrestha. 2009. “Institutional Ties, Transaction Costs and External Service Production.” Urban Affairs Review 44 (3Re-municipalization of public services: Trend or hype? ): 403–427. doi:10.1177/1078087408323939.
- Demuth, J., H. W. Friederiszick, and S. Reinhold. 2018. “Reverse Privatization as a Reaction to the Competitive Environment: Evidence from Solid Waste Collection in Germany.” ESMT Working Paper 18–02 . doi:10.1142/S2424835518500029.
- Dijkgraaf, E., and R. H. J. M. Gradus. 2007. “Collusion in the Dutch Waste Market.” Local Government Studies 33 (4Re-municipalization of public services: Trend or hype? ): 573–588. doi:10.1080/03003930701417601.
- Gradus, R. H. J. M., and E. Dijkgraaf. 2019. “Poorer and Less Political Fragmented Dutch Municipalities Take Tighter Waste Reduction Decisions.” Waste Management 88 (3Re-municipalization of public services: Trend or hype? ): 328–336. doi:10.1016/j.wasman.2019.03.059.
- Gradus, R. H. J. M., E. Dijkgraaf, and M. Schoute. 2016. “Is There Still Collusion in the Dutch Waste Market?” Local Government Studies 42 (5Re-municipalization of public services: Trend or hype? ): 689–697. doi:10.1080/03003930.2016.1194267.
- Gradus, R. H. J. M., E. Dijkgraaf, and M. W. Wassenaar. 2014. “Understanding Mixed Forms of Refuse Collection, Privatisation and Its Reverse in the Netherlands.” International Public Management Journal 17 (3Re-municipalization of public services: Trend or hype? ): 328–343. doi:10.1080/10967494.2014.935237.
- Gradus, R. H. J. M., and G. T. Budding. In Press. “Political and Institutional Explanations for Increasing Re-Municipalization.” Urban Affairs Review. will appear in. doi:10.1177/1078087418787907.
- Groot, T. L. C. M., and G. T. Budding. 2004. “The Influence of New Public Management Practices on Product Costing and Service Pricing Decisions in Dutch Municipalities.” Financial Accountability & Management 20 (4Re-municipalization of public services: Trend or hype? ): 421–443. doi:10.1111/fam.2004.20.issue-4.
- Hall, D., E. Lobina, and P. Terhorst. 2013. “Re-Municipalisation in the Early Twenty-First Century: Water in France and Energy in Germany.” International Review of Applied Economics 27 (2Re-municipalization of public services: Trend or hype? ): 193–214. doi:10.1080/02692171.2012.754844.
- Hefetz, A., and M. E. Warner. 2004. “Privatization and Its Reverse: Explaining the Dynamics of the Government Contracting Process.” Journal of Public Administration Research and Theory 14 (2Re-municipalization of public services: Trend or hype? ): 171–190. doi:10.1093/jopart/muh012.
- Hefetz, A., and M. E. Warner. 2007. “Beyond the Market versus Planning Dichotomy: Understanding Privatisation and Its Reverse in US Cities.” Local Government Studies 33 (4Re-municipalization of public services: Trend or hype? ): 555–572. doi:10.1080/03003930701417585.
- Hefetz, A., and M. E. Warner. 2012. “Contracting or Public Delivery? The Importance Of Service, Market, and Management Characteristics.” Journal Of Public Administration Research and Theory 22 (2Re-municipalization of public services: Trend or hype? ): 289-317. doi: 10.1093/jopart/mur006.
- Levin, J., and S. Tadelis. 2010. “Contracting for Government Services: Theory and Evidence for US Cities.” Journal of Industrial Economics 58 (3Re-municipalization of public services: Trend or hype? ): 507–541. doi:10.1111/j.1467-6451.2010.00430.x.
- Schoute, M., G. T. Budding, and R. H. J. M. Gradus. 2018. “Municipalities’ Choices of Service Delivery Modes: The Influence of Service, Political, Governance and Financial Characteristics.” International Public Management Journal 21 (4Re-municipalization of public services: Trend or hype? ): 502–532. doi:10.1080/10967494.2017.1297337.
- Stein, R. M. 1990. Urban Alternatives: Public and Private Markets in the Provision of Local Services. Pittsburgh, PA: University of Pittsburgh Press.
- Tavares, A. 2017. “Ten Years After: Revisiting the Determinants of the Adoption of Municipal Corporations for Local Service Delivery.” Local Government Studies 43 (5Re-municipalization of public services: Trend or hype? ): 697–706. doi:10.1080/03003930.2017.1356723.
- Voorn, B., M. L. van Genugten, and S. van Thiel. 2017. “The Efficiency and Effectiveness of Municipally Owned Corporations: A Systematic Review.” Local Government Studies 43 (5Re-municipalization of public services: Trend or hype? ): 820–841. doi:10.1080/03003930.2017.1319360.
- Warner, M. E. 2016. “Pragmatic Publics in the Heartland of Capitalism: Local Services in the United States.” In Making Public in a Privatized World: The Struggle for Essential Services, edited by D. A. McDonald, 189–202. London: Zed Books.
- Warner, M. E., and A. Hefetz. 2012. “Insourcing and Outsourcing: The Dynamics of Privatization among U.S. Municipalities 2002-2007.” Journal of the American Planning Association 78 (3Re-municipalization of public services: Trend or hype? ): 313–327. doi:10.1080/01944363.2012.715552.
- Wassenaar, M. W., T. L. C. M. Groot, and R. H. J. M. Gradus. 2013. “Municipalities’ Contracting Out Decisions: An Empirical Study on Motives.” Local Government Studies 39 (3Re-municipalization of public services: Trend or hype? ): 414–434. doi:10.1080/03003930.2013.778830.
