
 ?Mathematical formulae have been encoded as MathML and are displayed in this HTML version using MathJax in order to improve their display. Uncheck the box to turn MathJax off. This feature requires Javascript. Click on a formula to zoom.
ABSTRACT
The Doing Business reports have evoked an intense policy debate about whether countries should simplify regulatory rules or make them more stringent. We argue that doing business in developing countries is based on deals struck between firms and the state, rather than rules. We show that there is a weak relationship between rules and deals, and at low levels of state capability, more stringent rules leading to less compliance, rather than more. We provide a diagnostic approach to rules reform where the appropriate reform depend on the level of stringency of the rules, and the level of its state capability.
I. Introduction
Among the many, many “knowledge products” generated by the World Bank, the Doing Business (DB) indicators almost certainly get the most media attention and exert the largest influence on developing country governments. Countries follow their performance on their DB ranking over time and improvements are met with delight, both among the politicians and the country’s national media and, conversely, falls in rankings are met with consternation, complaint and denial. Underlying this attention is an assumption that improvements in DB ranking imply a reduction in the transaction costs of doing business and that these reductions will lead to higher investment, as well as an increase in the efficiency of investment, and hence higher growth (World Bank, Doing Business Citation2018). Further, the country’s ranking in the DB is taken as a reliable signal to foreign investors of the country’s attraction as a destination for foreign direct investment and, given the global competition for foreign direct investment, most developing country governments have a strong incentive to out-compete other developing country governments in signalling that their countries are a good place to do business.
The DB indicators have also generated the most controversy.Footnote1 One recent critique of the DB has been on the sensitivity of aggregate country rankings to the small changes in the methodology.Footnote2 But a more fundamental and influential critique has been against the underlying assumption: that improvement in DB is a desirable objective. This critique argues that laws and regulations are necessary for countries to meet their legitimate public policy objectives, such as collecting taxes, protecting workers’ rights, promoting health and safety standards in the workplace, and improving the natural environment. The laws and regulations that are needed for these public policy objectives may be seen as constraining the ability of firms to do business easily, but are nevertheless needed for overall societal welfare in the country in question (Altenburg and von Drachenfels Citation2006; Berg and Cazes Citation2007; Lee, McCann, and Torm Citation2008).Footnote3
Unfortunately, both the DB and its critics have incorrect assumptions about the way business is actually done in the developing world. The DB indicators measure a country’s De Jure processes for doing business: what would happen if existing regulations and policies were applied as written. This view assumes that (i) firms get regulatory clearances according to a country’s rules, with few systematic deviations from these rules in actual practice; and (ii) states, via their agencies and organisations responsible for implementation, actually carry out due diligence before giving regulatory clearances to firms.Footnote4 However, as Hallward-Driemeier and Pritchett (henceforth HP) Citation2015) have shown, the World Bank’s Doing Business (DB) reports do not provide an accurate picture of a country’s business environment. For three different indicators, HP compare the De Jure times reported in the DBFootnote5 with distribution of the times reported for those same three indicators from the World Bank’s Enterprise Surveys (ES), which reflect the reported experiences of a sample of firms. HP show the DB and ES for the same questions produce completely different results about the business environment, both across countries (there is little to no correlation of DB and ES) and within countries (where there is massive discrepancy and large variance across firms). For example, according to the DB, De Jure it would take about 180 days to get a construction permit in India in 2014. The ES data from firms that actually did get construction permits in that same year, showed huge variance across firms, as some firms reported needing only 1 day, while others needed up to 365 days. The average reported time was 33 days, five months less than the DB time of 180 days. HP argue that these massive discrepancies between DB and ES show that the DB De Jure compliance times do not represent the actual rules of doing business, the reality is that firms do business in a deals environment.
A “deal” implies that actual outcomes, what happens to any specific investor, depend in some, perhaps very small, part on the formal rules, but also on the ways in which my specific characteristics (e.g. relationship to those in power) and actions (e.g. bribes, lobbying, use of intermediary “fixers”) influence outcomes.
The common definition that “institutions” create the “rules of the game”, combined with the idea that “institutions” can be “strong’ or “weak”, leads to confusion. With “weak” institutions the “rules of the game” are not rules, in the usual meaning of the word, but hyper-specific, personalised, and many times unpredictable (ex ante and ex post) and contested, deals. The predicted regulatory outcomes for specific firms, like how long it will take to receive a construction permit, or what taxes a firm will pay, or whether one is allowed to sell this product on this street, cannot be determined by examining the formal rules. The formal rules establish mappings between facts about states of the world and actions of publicly authorised agents, but these laws, regulations and policies are not the reality; reality is based on deals, which are based on characteristics and which influence actions.
As HP argue,
when strict De Jure regulations meet weak governmental capabilities for implementation and enforcement … researchers and policy makers should stop thinking about regulations as creating “rules” to be followed, but rather as creating a space in which “deals” of various kinds are possible (p. 123).
This suggests that any understanding of the business environment of developing economies makes it imperative to first empirically characterise the actually reported deals and try and understand what drives the observed patterns. This is the motivation of this paper.
In this paper, we contribute to the debate on Doing Business in developing countries in two important ways. First, we define a number of measures for the deals environment in developing countries, such that cross-country comparisons are made possible. Using data from the ES, we define these measures for all ES country-years that have a minimum of 30 firms in the ES sample with data on the relevant indicators. The ES has conducted more than one survey corresponding to different years in some of these counties, so we have a sample of 136 country-years that satisfies the minimum number of 30 sampled firms. We find that the countries where firms report the highest proportion of quick deals (less than 15 days) are not a uniform group, but fall at opposite ends of a spectrum. Both failing states, such as Sudan, and high performing states, such as Malaysia, have predominately quick deals. This suggests that governance capabilities or regulatory stance alone may not be able to explain why we see such wide variation in deal-making across countries.
Our second contribution is an exploration of the correlates of deal-making across countries, focusing in particular on the interaction between the stringency of the s, as reported by Doing Business, and the level of state capability. We find that the association of the proportion of “quick deals” (or, conversely, “slow deals”) and the DB depends on the level of state capability, as in states with low capability increases in regulatory stringency are associated with increases in the proportion of firms reporting quick deals, strongly suggesting that premature load bearing from high levels of formal regulation decreases compliance. The potentially important implications for approaching “policy” we discuss at the end of the paper.
Section II empirically describes and classifies the nature and varieties of deals environments in developing countries. Section III defines some measures of the deals environment and caries out some preliminary investigation on their correlates. Section IV carries out regression exercises to describe correlates of the deals environment. Section V discusses the implications of the results for policy choices. Section VI concludes.
II. Understanding the deals environment in developing countries
How does one characterise the actual “deals” environment in a given country? We throw some light on this question by showing the difference between deals and rules in developing countries, as well as the differences between the various speeds of reported deals. Deals are different from rules (though, confusingly in our eyes, the “rules of the game” may be deals, not rules). Rules are (predominately) impersonal interactions between the state and businesses, whereas deals are based on particular (person- or firm-specific) relationships between businesses and political leaders or the bureaucracy or other modes of influence. Rules are the same for all businesses with the same regulatory relevant characteristics (so a rule may treat firms differently by size or sector or purpose), whereas deals differ from case to case, even for the regulatory “same” firm. Following HP, we characterise the de facto outcomes based on information from the Enterprise Survey as “deals” between businesses and the state, as distinguished from the De Jure “rules” reported in the Doing Business indicators.
HP use three measures for deals, based on questions in the World Bank’s Enterprise Survey. One is about the time it takes to start a business or to obtain an operating licence. The enterprise survey asks, “Approximately how many days did it take to obtain this operating licence from the day of the application to the day it was granted?” The second question involves construction permits. The manager or owner of the company is asked: “In reference to that application for a construction-related permit, approximately how many days did it take to obtain it from the day of the application to the day the permit was granted?” The third is about the time taken to process imports.
We use data from 136 country-years that have a minimum of 30 sampled firms. Country-year-wise descriptive statistics of this variable are given in Table A1 in the Appendix. We use only the construction permit, as the number of surveys with adequate numbers of firms on operating licences is much lower.Footnote6
presents kernel density functions for s (DB) and de facto days (ES) needed for construction permits, pooled across all the developing countries. The rules related to getting construction permits are not a description of their actual behaviour, as in practice they get their permits much faster than the rules stipulate. The modal number of days for DB is 180, whereas the modal days for ES is 15. This is so fast that it indicates the prevalence of some type of deal.
Figure 1. There is a vast discrepancy between De Jure “rules” and the de facto “deals” outcomes.
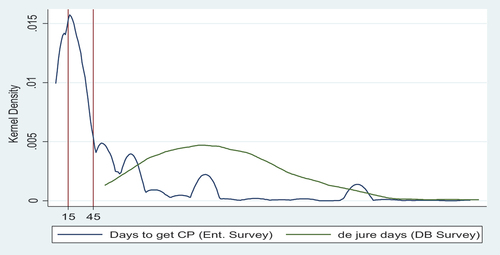
We characterise deals as quick, moderate or slow. Quick deals are those that complete the regulatory process within 15 days. Moderate deals are those that complete the regulatory process in between 15 and 45 days. If it took more than 45 days for firms to obtain the licence or permit, we define it as a slow deal. It may be noted that this nomenclature has no normative implication, but only provides a way to classify deals according to the time needed by firms in order to get their regulatory requirements processed.
There are three important aspects of the ES days distribution. First, there is a significant portion of this distribution on the left tail, which involves regulatory clearances within very few days, which is likely too short a period to undertake any due diligence or substantive review. About a third of all firms in the ES report a “quick deal”.
Second, there is a significant portion on the right tail (a bump at 365 days) that takes “too many” days to complete regulatory clearance – more than the De Jure and order of magnitude larger than the typical de facto. These are either extraordinarily complex cases that legitimately take a long time to review, or, given the deals nature of the enforcement environment, it could, in effect, be inflicting harassment on the firms by delaying approvals. As seen in the distributions of DB and ES in , two-thirds of all firm responses about construction permit compliance times are bunched below 45 days – below the lowest reported DB time and not anywhere near the middle of the De Jure distribution of 180 days. Thus, a third of the distribution is firms with “slow” deals.
Third, another third of the distribution are firms with “moderate” deals, between 15 and 45 days. This distribution of ES reports contrasts with the distribution of rules, which is one observation per country/year. This is significantly flatter, indicating a larger variety of approaches to the policies towards ease of doing business across developing countries.
The number and proportion of firms under each of these types of deal for each ES country-year is given in Table A2 in the Appendix.
represents the kernel distribution of deals for countries that have mostly quick, moderate and slow deals, respectively. While the horizontal axes of the graphs are not all to the same scale, there are (red) lines marking 15 days and 45 days in each graph, so that the distributions can be compared.
Figure 2. Countries are heterogeneous in deal making.
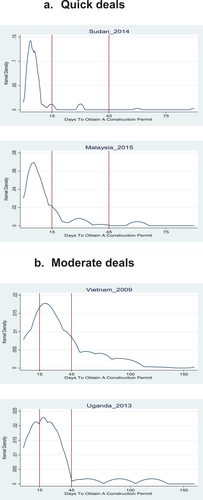
Figure 2. (Continued).
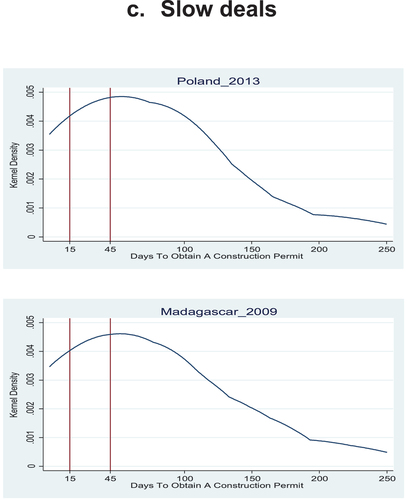
The quick deal environments are across very different income and governance levels. Countries with a predominantly quick deals environment include very high middle-income countries like Malaysia (83%), but also much poorer countries without, shall we say, a strong reputation for governance, like Sudan (94%). Countries with predominantly a moderate deals environment include high-income countries like Hungary (56% moderate) as well as low-income countries like Uganda (44%) and low middle-income countries like Vietnam (38%). Countries with a slow deals environment include high-income countries like Poland (68% slow) as well as very low-income countries like Madagascar (60%). Perhaps not surprisingly, the very high percent ’slow’ countries are dominated by Eastern Europe and Russia (nine of the 13 highest percent slow countries).
III. Deals environments, rules and state capability: a preliminary exercise
This section explores the cross-national relationship between the deals environment, s, and state capability. We use the proportion of quick deals (<15), moderate deals (15< ES<45) and slow deals (<45) in line with the discussion in the previous section.Footnote7
There are two obvious factors that may influence deals. First, the s define the official approach to the state–business relationship. By legally fixing a process with few days required for compliance, governments could hope to provide better deals to firms. We use the DB report for the country-year of the ES to proxy for this factor. Second, state capability is sometimes defined as the ability to implement existing laws, regulations and policies. We create a state capability index based on principal components analysis of the six (strongly correlated) variables from the World Governance Index: (i) voice and accountability (ii) rule of law (iii) regulatory quality (iv) political stability (v) government effectiveness and (vi) corruption control. These two, official regulation and state capability, are conceptually independent and shows there is only a weak correlation (−0.11).
Figure 3. Relationship between Doing Business (construction permit) and state capability.
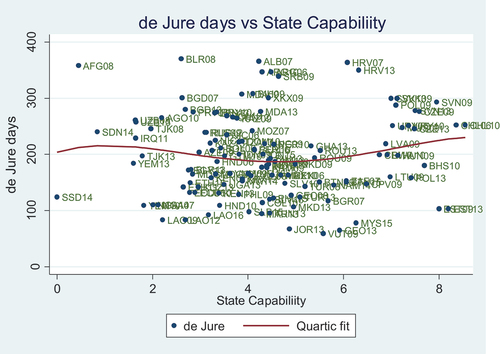
There is a fairly high correlation across countries of nearly all governance indicators and there is a literature on how many principal components these various indicators contain. The first principal component of six WGI variables captures close to 80% of the joint variation. Many authors argue that there is really only one principal component in the standard governance indicators, while others argue that there are two or more, often with one representing the “democracy/human rights” aspects of governance and another “state capability” (Drumm Citation2015). For our present purposes, one rough-and-ready index based on the first principal component will do.Footnote8
The proportion of quick, moderate and slow deals is plotted against the Doing Business reported days in and Appendix Figures A1 and A2, respectively (each of which also shows an illustrative quartic fit). shows a lower proportion of quick deals, the higher the DB measure. There is some relationship between the deals environment and the DB, but it is weak, in two senses.
Figure 4. Relationship between quick deals and Doing Business (construction permit).
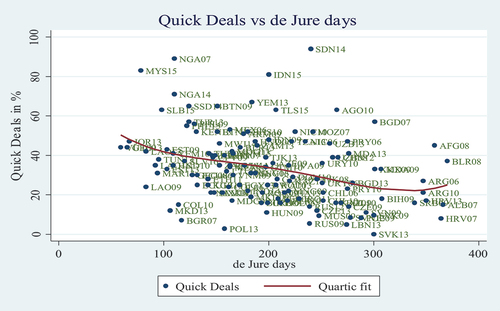
First, the relationship is weak in the sense that massive increases in the DB are associated with modest decreases in the proportion of quick deals. Following the quartic fit, one can see that countries with a DB of 100 days have roughly 40% quick deals, whereas countries with a DB of 300 days still have, on average, more than 20% quick deals – firms who report taking less than 15 days. Obviously, if De Jure regulations increased compliance times one for one – shifted the distribution of reported compliance times uniformly to the right a 200-day increase in the De Jure should completely eliminate quick deals. For that matter, even if each De Jure regulatory day added uniformly one-tenth of a day to each firm’s reported compliance times, this should also drive the proportion of quick deals to zero (as even firms reporting zero days at DB of 100 would be at 20 if the uniform shift were even one ES day for each 10 DB days).
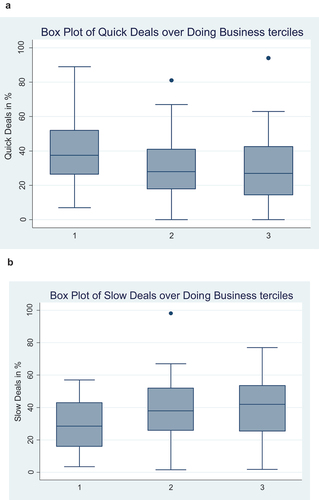
Second, the relationship is weak in the more traditional sense that the “explanatory power” of DB for reported times is weak. show the box plot of the distribution of “quick” and “slow” deals across the terciles of DB. The fraction of “quick deals” does decline with the De Jure DB measure of the rule – but only moderately from lowest tercile to middle tercile and not at all above that (so the median fraction of quick deals is roughly the same in the most restrictive tercile as the middle tercile). These 25th-75th boxes massively overlap. Even though the median DB days is 69 days higher for the middle tercile than the bottom tercile (least restrictive), the 75th percentile of countries in the middle tercile is 44% of firms reporting quick deals (under 15 days), compared to the median of 40% of quick deals, even in the least restrictive countries.
Figure 5. (a) Distribution of quick deals for Doing Business terciles. (b) Distribution of slow deals for Doing Business terciles
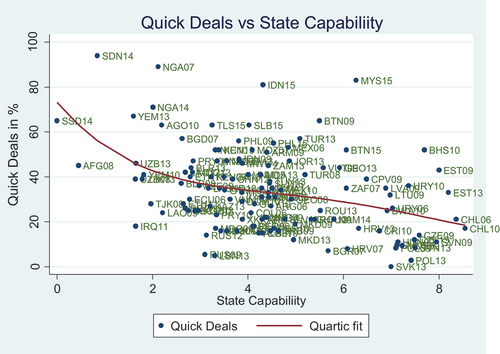
shows that countries with a higher state capability index (SCI) have fewer quick deals, the fitted (“predicted” in the very narrow and technical sense) value of the proportion of quick deals falls from over 60% to under 20% across the range of observed SCI (the corresponding figures for moderate and slow deals are in Appendix Figures A3 and A4). This strong association of reported times suggests that quick deals are often the result of weak implementation via regulatory capture and/or influence or evasion, rather than the result of better regulation or the more speedy completion of regulatory processes. In other words, firms are able to get permits and licences much faster, without due diligence being undertaken for their business activities, by influencing the regulatory bureaucracy and/or their political bosses. As a country’s state capability increases, there is greater ability to counter the pressure for regulatory capture and hence the proportion of such quick deals falls (even at the constant levels of De Jure regulation – on which more below).
Figure 6. Relationship between quick deals and state capability.
IV. Regression Analysis of the Deals Environment
We present two sets of regression exercises in this section. In the first set, we explore the multi-variate correlates of the fraction of quick, moderate and slow deals, using simple OLS regressions. Our interest is in the associations of these measures of deals with s (DB days) and the State Capability (SCI). We also run Instrumental Variable (IV) Regressions to address issues of endogeneity.
In the second set of regression exercises, we focus on the complex relationship of the deals environment with s and State Capability. To do this, we allow for two types of non-linearity in these relationships. The first type of non-linearity is captured by spline regressions that allow the association to differ above and below the median (so that, for instance, the DB could have less association with quick deals at higher than lower levels of DB). For the second type of non-linearity, we allow an interactive term, so that we can investigate whether the association of the DB on quick or slow deals depends on the level of state capability.
For the first set of regressions, the general empirical specification we use is as follows:
where i stands for country and r is the year of the ES survey (the number of years for which a survey is available for a particular country varies from one to three, see Table A1). D is the proportion of deals that are quick, moderate and slow (we estimate separate equations for each of these three dependent variables). S is state capability (an ordinal measure, varying from 1 to 10). R is the as measured by the DB number of days to obtain a construction permit. Z are time-varying controls and W are the time-invariant controls.
The dependent variable in these regressions are measures of the deals environment, which are effectively the informal property rights institutions, mainly in developing countries. Thus the control variables (other than De Jure days and state capability) need to be determinants of institutional quality in these countries. We use five explanatory factors from the literature that are considered to be exogenous determinants of institutional quality. These are
(i) “State history”, a measure of the historical length of statehood of a country. This variable was originally constructed by Bockstette, Chanda, and Putterman (Citation2002) and have been used in a number of recent studies (Iliev and Putterman (Citation2007), Dombi and Grigoriadis (Citation2020)). Recent studies have shown that this measure has a non-linear impact on development (Borcan, Olsson, and Putterman Citation2018). In line with this view, we hypothesize that State history may have an ambiguous effect on the deals environment, possibly a positive relationship with both quick and slow deals.
(ii) “Globalization”, a measure associated with more competition and facilitating imitation of good practices from the world (La Porta, Lopez-de-Silanes, and Shleifer Citation2008). Thus we hypothesize that more globalized countries will also experience a higher proportion of quick deals and a lower proportion of slow deals.
(iii) “Oil rent”, “Gas rent” and “Forest rent” as three alternative types of rent acquired from natural resources with a narrow economic or geographical base (as opposed to rent from more diffused natural resources-based activities like agriculture). Developed by Isham et al. (Citation2005), these types of rents are associated with rent-seeking economic activities that lead to deals with a very narrow base of preferred firms. Thus our hypothesis is that higher rent from these sectors lead to lower proportion of quick deals and ambiguous effect on other types of deals.
(iv) “Ethnic fractionalization” measuring the extent to which a country is ethnically divided (Easterly, Ritzen, and Woolcock Citation2006). A significant literature has related ethnic fractionalization with broad-based corruption in developing countries. Based on this literature, we hypothesize that higher levels of this variable will be correlated with a higher proportion of quick deals, while the relationship with other types of deals may be ambiguous.
(v) “British legal origin” measuring whether the legal system in a country was of the British common law type, rather than the French, German or Scandinavian civil law. This is a dummy variable that has been collected from La Porta, Lopez-de-Silanes, and Shleifer (Citation2008). There are a number of studies (e.g., Glaeser & Shleifer, Citation2002; Beck, Demirgüç-Kunt, and Levine Citation2003) that demonstrate that the British common law is much more amenable to investment and growth. In this paper we assume that a stronger formal legal institution that is business-friendly will indirectly influence the informal deals environment as well and hence we expect a positive relationship with quick deals and a negative relationship with slow deals.
We also control for log of per capita income, as an omnibus variable representing levels of development.
It may be noted that some of these variables are time variant such as globalization and the rents from different sources while others are time invariant such as state history or legal origin.
present the results for the measures quick deals, moderate deals and slow deals, respectively.Footnote9 The first equation (column 1) estimates the deals variable as a function of just the variables DB De Jure days and state capability. Column 2 adds control variables including log per capita GDP and measures of institutions.Footnote10 Column 3 and 4 allows for endogeneity in the two variables of interest, DB De Jure and state capability, presenting results of Instrumental Variable regressions corresponding to columns 1 and 2. The instruments used are the absolute value of latitude of a country and the five-year lagged-values of the State Capability measure. The first variable acts as an instrument for DB De Jure and the second variable as the instrument for current State Capability.
Table 1. Correlates of the percentage of quick deals (<15 days).
Table 2. Correlates of the percentage of moderate deals (15–45 days).
Table 3. Correlates of the percentage of slow deals (>45 days).
For the absolute value of the latitude of a country to be considered an instrument for the variable DB De Jure, it needs to meet the exclusion restriction – that is, while latitude must be a determinant of “rules”, it should not have any direct effect on the “deals” regime. Note that in the literature on the relationship between institutions and growth, the focus is on formal institutions, which, in our study, corresponds to “rules”. In this literature, latitude is commonly used as a determinant of better (formal) institutions, and the underlying argument is in terms of colonial expansion. For example, Hall and Jones (Citation1999, p 101) states, “ … it appears that Western Europeans were more likely to settle in areas that were broadly similar in climate to Western Europe, which again points to regions far from the equator.” This implies that formal institutions are strongly influenced by history. Since history was itself determined significantly by geography (distance from equator, a la hall and Jones), this makes geography (latitude) a determinant of formal institutions. Also note that this means formal institutions/rules are slow moving variables. Otherwise, the effects of history would not have persisted for so long, right up to the present,
Is there a possibility of a similar effect of latitude on “deals” regimes. Here, it is important to note the differences between “deals” and “rules”. As described previously, “ … A ‘deal’ implies that actual outcomes, what happens to any specific investor, depend in some, perhaps very small, part on the formal rules, but also on the ways in which my specific characteristics (e.g. relationship to those in power) and actions (e.g. bribes, lobbying, use of intermediary ‘fixers’) influence outcomes.” This clearly means that “deals” are the outcome of current political developments, with current political elites creating and sharing rent with a group of current business elites. In other words, deals are determined by current politics, rather than by history, Moreover, since this arrangement is person specific (particularly the political elite who provides the deals), they can change completely with a change in the person in power (due to death, regime change, or simply a transfer of power.) This seem to suggest strongly that they are not determined by colonial history, but are largely determined by current political regime changes. Thus, it seems highly likely that the effect that latitude has on rules through history, would not persist in case of deals.
Next we consider whether latitude/geography may affect deals, not through history, but through other channels. While this is a theoretical possibility, the nature of the two variables seem to suggest that this is improbable. For any country, the latitude is an unchanging variable, while it’s deals regime is volatile, with the possibility of fluctuations between good and bad deals regimes for any political regime change. This clearly makes latitude an unlikely determinant of deals regimes.
How justified is it to use 5 year lagged values of State Capability as an instrument for current State Capability?As we have argued in this study, higher State Capability leads to less deals because it enables the State to push back against regulatory capture, which would otherwise enable more deals. In this framework, lagged State Capability could indeed impact deals if the time involved to close the deals was long enough. If for example, a business applies for a license in year T-N and receives the permit in year T, then, deals in period T will depend on State Capability in year T-N. In reality we find almost all deals are completed within a year. To see this, note that the highest mean number of days to get a construction permit in any country in our sample is 179 days (roughly 6 months) for Croatia for the year 2007 (see Table A1 in the Appendix). Next, note that our instrument is State Capability 5 years back, i.e., for the year T-5. Clearly, given the speed of the completion of the deals, a direct impact of State Capability in Year T-5 on the deals in year T seems improbable. The only impact it could have, given the persistence of State Capability, is an indirect one through it’s effect on the State Capability in year T. Therefore, the 5 year lagged State Capability as an instrument for current State Capability meets the exclusion restriction.Footnote11
In Table A4 in the Appendix, we report the first stage of the IV regressions. Both the first-stage regressions and the test for underidentification reported in shows that the instruments pass the test for weak instruments.
indicate that there is a statistically significant relationship between the Deals environment, s and State Capability. In particular, Rules and State Capability both have a negative relationship with Good Deals and a positive relationship with Bad Deals.Footnote12 Column 1 and 2 of (OLS estimates without and with control variables) suggests that, on average, an increase by 100 days in the De Jure rules in a country is associated with only about 6 to 8% fewer quick deals. This implies that stronger rules have very limited association with weaker deals environment. However, Column 3 and 4 of the same table (TSLS estimates without and with control variables) show that stricter rules may actually have a somewhat stronger association with weaker deals environment. Here, on average, an increase by 100 days in the De Jure rules in a country is associated with about 17 to 21% fewer quick deals. Similarly in , The OLS and TSLS estimates suggest that on average, an increase by 100 days in the De Jure rules in a country is associated with about 7 to 10% more slow deals.
Let us next look at the association between the state capability index (that ranges between 0 and 10) and the deals environment. From , we find that a unit increase in the state capability index is associated with about 3.2 to 5.4% fewer quick deals, depending on whether we consider the OLS or the TSLS estimate. indicates that a similar increase in the state capability index is associated with about 3.4 to 3.9% higher slow deals. Thus, increased De Jure Regulations and higher State Capability lower the proportion of Good Deals and increase the proportion of Bad Deals in a country. Moreover, the instrumental variable regressions indicate that there is a strong relationship between these two variables and the deals environment, even after controlling for endogeneity.
Amongst the control variables, whether the country has a British legal origin shows a positive relationship with quick deals. This variable has a negative relationship with moderate and slow deals, although it is statistically significant only in column 2 for moderate deals. None of the other variables, including log per capita income, has any significant relationship with the deals variables. Hence, in the next set of regressions, we will focus on the complicated relationship between the de facto deals environment, state capability index, and De Jure regulation.
As we had observed in above, there are non-linearities in the relationships between deals and rules, and deals and state capability. In the second set of regressions, we attempt to capture these non-linearities. We allow for the effects of rules and state capability on deals to differ, depending on whether the measures of rules and state capability for a particular country is higher or lower than the median values of rules and state capability. We also introduce an interaction term between s and State Capability, in order to study whether the impact of the former on the deals environment depends on the values of the latter. The equation is as follows:
where S+ and R+ are measures of state capability and rules when they are above their respective median values and S− and R− are measures of state capability and rules when they are below their respective median values.Footnote13 We estimate Equationequations (1)(1)
(1) and (Equation2
(2)
(2) ) using pooled Ordinary Least Squares. We use a robust estimation method, clustering standard errors at the country level, as the measures of deals, rules and state capability would be correlated across multiple waves for the same country. Further, we do not use normal (0,1) dummies for R+ and R- as well as S+ and S- to avoid avoids the multicollinearity/perfect-collinearity problem standard in regular dummies. Instead, we use a STATA algorithm called mkspline, to address this problem.
For the equation where the proportion of quick deals is the dependent variable, if higher rules and higher state capability lead to lower proportion of quick deals, we would expect the coefficients on S and R to be both negative. Further, if we expect that more stringent rules lead to lower compliance in weak state capability countries, we expect the coefficient on the interaction term of R and S to be negative as well.
The regression results corresponding to alternative versions of Equationequation (2)(2)
(2) are presented in . , column 1, confirms the negative relationship between the quick deals variable and the DB De Jure days and state capability variables. Column 2 (that includes controls) shows that increases in state capability from low levels decrease quick deals; less so above the median, with the coefficient on State Capability (below median) being negative and significant, while the coefficient on State Capability (above median) is negative but statistically insignificant. The coefficients on DB rules, below and above median, also depict a similar relationship.
Table 4. Correlates of the percentage of quick deals (<15 days).
Table 5. Correlates of the percentage of moderate deals (15–45 days).
Table 6. Correlates of the percentage of slow deals (>45 days).
Columns 3 and 4 suggest an interactive effect between the formal regulation (DB days) and state capability. With a linear interaction term, the estimated impact of increased DB regulatory days on the percentage of quick deals depends on the level of state capability. In column 3 of , the equation is
So the predicted impact on the percentage of deals that are quick from increasing the DB days by 100 days is:
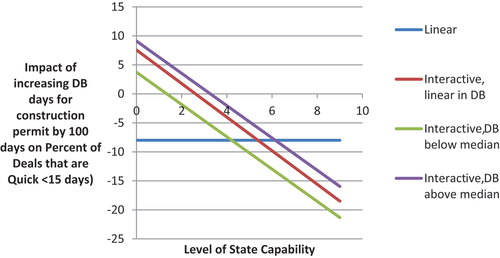
At the point estimates this is (.07 − .03*SC)*100 and is shown in . Column 1 of suggests that, on average, an increase by 100 days in the regulation is associated with 8% fewer quick deals (the horizontal line). But the interactive effect suggests that, while this is true of the country with state capability of 5 (on a 0 to 10 scale), this is not true for countries with low capability. For a country of very low capability (an index of 1, roughly Sudan’s level), the predicted effect of increasing the De Jure regulatory days to get a construction permit by 100 days is to increase the percentage of firms that actually report completing the process in less than 15 days by 5 percentage points. That is, higher stringency of regulation is associated with less apparent compliance.
Figure 7. Increasing the De Jure regulation reduces quick deals for higher-capability states, but not for weak-capability states.
From column 4 of , we can also calculate the expected impact of increasing regulation on quick deals when the DB is either below or above the median (i.e., 193 days). What the estimates suggest is that the impact on the percentage of deals that are quick of an increase in the DB s, is the unexpected result of increasing the percentage of quick deals only for those countries that start from a higher than average DB regulation. This result therefore combines the non-linearity of the spline from column 3 with the interaction effect. This result is consistent with what we observe in the graphs above, where, for instance, Sudan and Afghanistan have very low state capability, above average DB De Jure days, and yet also above average percentage of quick deals.
shows the same results for slow deals (>45 days), which are, reassuringly but not surprisingly, symmetric: increases in regulation reduces the fraction of deals that are slow for low-capability countries, particularly when regulation is above the median.
Figure 8. Increasing regulation increases the percentage of deals that are “slow” in strong capability countries, not in weak capability countries.
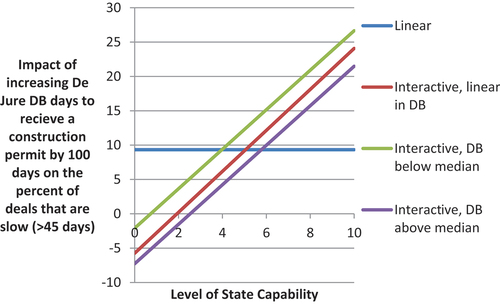
The first finding is that the impact of De Jure regulation on what firms report is non-linear, i.e., increasing the De Jure regulation by 100 days increases the median reported days by 8 days when the increase starts from above the median, but by 11 days when it is below the median. The second finding is the interactive effect that the impact of De Jure on de facto is much weaker (and, for the weakest, in the opposite direction) in countries with weak state capability and stronger in states with strong capability. The third (in some sense a mechanical consequence of the above two) is that increasing regulation in very weak states actually reduces the median reported compliance times.Footnote14
While the interactive effects are striking, we want to be the first to acknowledge the many weaknesses. Both the simple spline term at the median and the multiplicative interactive term are very, very strong and essentially arbitrary functional form restrictions that may not be benign. The measurement error in our variables generally, and in particular the large differences in the number of firm observations from each survey (some countries have just barely over 30, whereas eight countries have over 200 firm observations), has not been incorporated. That said, these results are the first large-scale cross-national data describing patterns of associations amongst rules, deals and state capability that have been predicted from individual cases, but never seen across countries.Footnote15
V. What should a policy maker do?
Consider a policy maker in the Ministry of Industry in a hypothetical developing country or emerging economy. What do our results imply for his or her policy choices, when faced with the possibility of easing the Doing Business in some observable measure where the policy maker has the power to change the rules (say, simplifying the regulations to obtain a construction permit)? Our results suggest that the desired policy option for the official would depend on whether the country in question is a low- or high-capability state, and whether the DB rules in the country are higher or lower than the average, (that is, more stringent or less stringent). Therefore, what the official should do would depend on whether his or her country is placed in the -two-by-two quadrant below (we use median DB days to obtain a construction permit to categorise countries in the more stringent or less stringent s rows, and the median value of our state capability measure to categorise countries as being high or low state capability), as in . We provide concrete country examples for each of the four cells of to illustrate our argument.Footnote16
Figure 9. Policy diagnostic map for doing business.
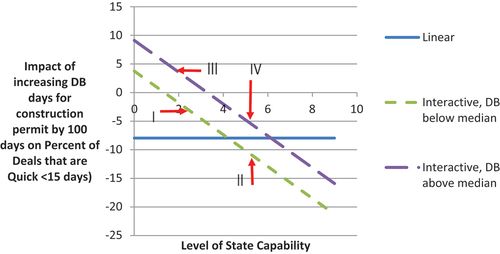
Table 7. Doing Business diagnostics.
First consider Uruguay (case IV), which has high state capability as well as more stringent s.Footnote17 Uruguay is the archetypical country for the DB case for easing regulations – with high state capability, compliance is high in Uruguay, so deals mirror rules to a large extent. Though there may be a case for not relaxing s to maintain public purpose objectives, there may be a stronger case for the ministry of industry official in Uruguay to ease DB, if it were to lead to higher investment and growth.
Now consider Poland (case II), also a country with high state capability, but with below median (less stringent) DB indicators.Footnote18 For the Polish ministry of industry official, there would have to be compelling evidence that this particular element is an important obstacle to business, as further reductions may actually compromise on some important public purpose goal. In this case, the ministry of industry official in Poland would need to balance public policy objectives against the DB policy prescription of further relaxing the ease of doing business, and may choose not to do anything with the .
Next consider Nigeria (case I), a country with low state capability and low s.Footnote19 As we have seen from the previous section, for a country like Nigeria, with low state capability, de facto deals, and not rules, dictate the economic environment, and there is very limited compliance with regulations in these contexts. With an already low DB, there is very little that the ministry of industry official in Nigeria needs to do, and the overall policy message for such a country example would be to strengthen state capability, such that compliance can increase in the future.
Finally consider Sudan (case II), a country with low state capability and high s.Footnote20 One may consider Sudan as the prime candidate for DB reform, as arguably simplifying regulations in the country would bring in more investment and possibly lead to higher economic growth – a desirable policy objective for one of the poorest countries in the world. However, our results have already shown that there is very limited compliance in a country such as Sudan, and the deviation of deals from rules is the highest in this context. The case for lowering the formal rules is not that it would lead to greater ease in doing business, but rather, counter-intuitively, it is more likely to lead to accomplishing public purposes. By maintaining stringent and complex formal regulation in an environment where state capability is low, this risks being a lose-lose-lose policy. It loses in forcing firms into illicit or semi-illicit non-compliance. It loses in being undermined in a way that almost certainly thwarts the averred public purpose of the regulation. And it loses in creating a low-level capability trap in state capability, due to premature load bearing. Potentially, quite dramatic reduction in formal regulation could be win-win-win, rather than the difficult trade-off for Uruguay or possible losses for Poland.
VI. Conclusions
The annual Doing Business exercises encourages countries to provide a better business environment by quantifying the difficulty faced by firms in fulfilling existing formal legal regulatory processes. The quantification is based on expert opinion on a large number of relevant rules and regulations in these countries and this encourages countries to change their legal procedures and rules, such that these regulatory processes are, by law, simplified and completed within a shorter period of time. Thus, better rankings on the DB index require countries to achieve an “ease of doing business” by providing regulatory rules that are as simple as possible, and the required processing according to these rules needs to be as fast as possible. There are two interpretations to this Doing Business approach.
One interpretation is that it is based on a complete misunderstanding of the reality of how firms actually do business in developing countries. It is both obvious to the typical person in the street and easy to document empirically that the way business is done is through striking deals with the political and bureaucratic elite, either via connections or through intermediaries. These deals make the legal rules largely ineffectual, both as obstacles to business (but do strongly affect who can do business successfully) and in their (purported) public purpose, such as collecting taxes or enforcing regulations. Our study shows that for most firms in most developing countries in the world, the regulatory process we can document takes massively less time than is stipulated by the corresponding rules. In many countries in which the DB indicators state that getting a construction permit takes six months or more, the majority of firms report compliance times of less than 15 days.
The other interpretation of the politics of the advocacy exercise of Doing Business is that it understands this pervasive De Jure-de facto gap, but it is predominately concerned with creating the conditions for foreign investment – and foreign investors are significantly impeded in their deal making abilities relative to domestic investors. Perhaps the Doing Business indicators could be labelled the “Doing Business for that small subset of foreign investors from developed countries, who must, due to their own domestic regulations – which, given high state capability, are actually enforced – try and comply with the laws of the country as written”. Of course, it is an open empirical question whether the foreign investors do in fact operate in greater compliance with De Jure regulations, or whether they themselves simply operate in another deal-making space, in which foreign investors ask for, and get, formal and legal regulatory forbearance (or tax exemptions).
Since deals, as opposed to s, are firm specific, each country has a mixture of quick, moderate and slow deals (corresponding to different firms). Thus the overall business environment in a country is determined by which type of deals is most prevalent. Using this idea, this paper creates a number of measures of the business environment in a country, defining them as quick deals, moderate deals and slow deals. Using cross-country data, we find that simpler rules indeed have a relationship with quick deals as well as slow deals, but none with moderate deals. More specifically, a simplification of the rules is associated with a higher proportion of quick deals and a lower proportion of slow deals – but only in countries with quite strong state capability. In countries with weak capability, increases in regulation (especially from very high levels) actually increase the likelihood of quick deals (through even reduced regulatory compliance).
Given the pervasiveness of deals in defining the business environment in most developing countries, and where existing formal regulations are creating an implementation capability trap, then both sides of the debate about the Doing Business indicators are wrong. On the one hand, if the regulatory processes faced by firms in actually doing business are not actually the De Jure policies measured by the Doing Business indicators, then changing these may have no effect on the way in which business is done and hence not be related to improved investment, innovation or growth. On the other hand, if deals are subverting the public purposes of the policies and clearances are not happening according to the existing De Jure laws, and due diligence is not actually undertaken before such clearances, then “relaxing” these regulations may also have no effect on actual enforcement or achievement of public purpose. Given the wide and pervasive discrepancy between the De Jure and de facto, it is not obvious that either simplifying or reducing rules and regulations from their existing levels to make it easier for business to invest, or strengthening these rules and regulations to safeguard health, safety, environmental and other public policy concerns, will necessarily (or even likely) have a material effect on the actual goals either to increase investment and growth or meet societal goals around better labour or environmental standards, especially in weak state capability contexts. Thus, the premise of rules reforms – that relaxing strong “rules” will either improve the true ease of Doing Business or weaken the accomplishment of public purpose – becomes doubly false. Changing ease of Doing Business could affect neither.
Though the focus of our paper is on the Doing Business indicators, our findings speak to the wider debate on how to build state capability in weak regulatory contexts (see Pritchett, Andrews, and Woolcock Citation2013; Andrews, Pritchett, and Woolcock Citation2017). The conventional approach to state building in countries with weak institutional settings is to try and spread “best practice”, irrespective of organisational capability – or a realistic plan to build such capability – and low- and middle-income countries, for a variety of reasons, are asked to adopt formal laws and regulations. However, this creates an impossible environment for the implementing organization, as the pressures on them not to enforce the “beautiful” but unrealistic law become unbearable and the organisational norm quickly becomes one of accommodating non-compliance (in a variety of ways). And, once that norm is established, this low-level trap is very difficult to escape. Firms facing tough laws and weak compliance do not really lobby for strong capability and better laws, as it is easier for any given firm to accommodate for itself via a deal, rather than lobby for new rules. The advocates for the purpose of the regulation, having achieved the passing of a “beautiful” law, do not want it relaxed. The politicians and heads of organisations often directly benefit from the de facto discretion that tough regulation combined with low capability for enforcement gives them. All of this reinforces the point that building state capability in any endeavour needs to start from the political authorisation to solve locally nominated problems, not from the vague idea that equates capability with rule compliance.
JEPR_Rev2_Appendix.docx
Download MS Word (115.6 KB)Disclosure statement
No potential conflict of interest was reported by the author(s).
Supplementary material
Supplemental data for this article can be accessed online at https://doi.org/10.1080/17487870.2022.2125391
Notes
1. For example, see critical discussions in Gelb and Ramachandran (Citation2018) and Sandefur and Wadhwa (Citation2018).
2. For example, the former chief economist of the World Bank, Paul Romer, criticised the Doing Business methodology in the case of Chile, where the addition of new components, such as the amount of time firms spend in dealing with taxes, led to the drop in Chile’s ranking in the DB indicator during the tenure of the socialist President, Michelle Bachelet (see Zumbrun and Talley (Citation2018). This controversy led the World Bank to constitute an external audit of Chile’s ranking in the DB indicators in 2018. In 2021, after data irregularities on Doing Business 2018 and 2020 were reported internally in June 2020, the World Bank paused the next Doing Business report and initiated a series of reviews and audits of the report and its methodology.
3. See Martin-Prével and Mousseau (Citation2016) and Bretton Woods Project (Citation2017).
4. While the measure captures the median duration that local experts indicate is necessary to complete a procedure in practice, the DB methodology explicitly assumes that firms carry out every activity – even in practice – “by the rules”. See https://www.doingbusiness.org/content/dam/doingBusiness/media/Annual-Reports/English/DB19-Chapters/DB19-About-Doing-Business.pdf.
5. The DB reports assess 11 elements of a country’s policies that relate to private firms, including starting a business, trading across borders, dealing with construction permits, enforcing a contract, and paying taxes. The measures for each element are created by experts (one to four lawyers or accountants) in each country, who are asked to estimate the “typical” time and cost that it would take a hypothetical “standard” firm (privately and domestically owned, limited liability company with 10–50 employees, operating in the country’s largest city) to comply, based on their assessment of formal regulations as they exist on the books (see HP: 124).
6. It should be noted that ease of obtaining construction permits is just one of the factors that describe the investment climate in the Doing Business indicators, and there are other measures such as enforcement of contracts and trading across borders. We focus on construction permits for two reasons: a) it provides a summary measure of the deals that make take place between bureaucrats and politicians on one hand and firms on the other, and b) the data on construction permits is available for a large number of countries.
7. While HP looked at variation in three measures of regulatory compliance in the Enterprise Surveys – days taken to obtain an operating licence, days taken to obtain a construction permit, and days taken to clear customs – we confine our analysis to construction permits, as there are enough firm-level observations of this variable to permit a robust measure of deals for a sufficient number of countries.
8. There has been considerable debate on how best to measure state capability. While the World Governance Indicators (WGI) have come under some criticism for lack of consistency over time (see Apaza Citation2009), other measures such as ICRG’s Bureaucratic Quality, have been criticised for their subjective nature (see Savoia and Sen Citation2015). We use the WGI, as they cover all the countries in our sample. However, our results are robust to alternative measures of state capability, such as the ICRG measure of bureaucratic quality.
9. It could be argued that there may be a bias in our results, given the low number of observations (126) in our base sample. However, the number of observations in our econometric analysis is in line with other studies that use cross-country econometric methods, such as Acemoglu, Johnson, and Robinson (Citation2001).
10. Adding the control variables causes the sample size to fall modestly (from 129 to 98 observations), but the results of columns 1 and 2 on the reduced sample are essentially the same.
11. As pointed out by Reed (Citation2015), lagged values of the explanatory variable are valid instruments if the lagged values do not themselves belong in the respective estimating equation, and if they are sufficiently correlated with the simultaneously determined explanatory variable.
12. Table A5 in the appendix re-estimates the IV regression in column 3 for a sample that includes only the latest waves of the enterprise survey in each country. This estimation tests whether the results are robust when there is only one sample point from each country (as opposed to column 3, say, where many countries have data from multiple waves of the enterprise surveys). Here, together with the five-year lagged-values of the state capability measure, we have used values of De Jure Days from the previous wave of enterprise survey as instruments. The results are similar to those in column 3.
13. We interpret R+ and R- as more stringent and less stringent rules, as indicated by the DB measure. However, it should be kept in mind that a higher R, for example, does not necessarily imply more stringent rules but may reflect less efficient approval processes for construction permits and operating licenses.
14. Raj et al. (Citation2020) also find a negative relationship between governance and deal making using Enterprise Survey data for Indian states.
15. One important caveat to our results is that we are not able to address selection bias in our estimates which may result from the exit of firms who may decide not to apply for construction permits in in countries with very stringent rules. However, the selection bias may work in favour of our results, if the firms which exit are the ones which would have reported slow deals, leading to the proportion of quick deals being lower than its reported value.
16. It is important to note that the balancing of public policy objectives and increasing investment/growth opportunities is often contextual, and that ultimately the choices that policy makers make would depend on their own specific country context, including social and political constraints.
17. The De Jure number of days it takes to obtain a construction permit in Uruguay is 251, when the median is 193. Uruguay’s state capacity measure is 7.03 when the median value is 4.26.
18. Poland’s DB value is 158 and the state capacity measure is 7.41.
19. Nigeria’s DB value is 110 and the state capacity measure is 2.11.
20. Sudan’s DB value is 240 and its state capacity measure is 0.84.
References
- Acemoglu, D., S. Johnson, and J. A. Robinson. 2001. “The Colonial Origins of Comparative Development.” American Economic Review 91 (5): 1369–1401. doi:10.1257/aer.91.5.1369.
- Altenburg, T., and C. von Drachenfels. 2006. “The “New Minimalist Approach” to private-sector Development: A Critical Assessment.” Development Policy Review 24 (4): 387–411. doi:10.1111/j.1467-7679.2006.00331.x.
- Andrews, M., L. Pritchett, and M. Woolcock. 2017. Building State Capability: Evidence, Analysis, Action. Oxford: Oxford University Press.
- Apaza, C. 2009. “Measuring Governance and Corruption through the Worldwide Governance Indicators: Critiques, Responses, and Ongoing Scholarly Discussion.” PS: Political Science and Politics 42 (1): 139–143.
- Beck, T., A. Demirgüç-Kunt, and R. Levine. 2003. “Law and Finance: Why Does Legal Origin Matter?” Journal of Comparative Economics 31 (4): 653–675. doi:10.1016/j.jce.2003.08.001.
- Berg, J., and S. Cazes (2007). “The Doing Business Indicators: Measurement Issues and Political Implications.” Economic and Labour Market Paper 2007/6. Geneva: International Labour Organization.
- Bockstette, V., A. Chanda, and L. Putterman. 2002. “States and Markets: The Advantage of an Early Start.” Journal of Economic Growth 7 (4): 347–369. doi:10.1023/A:1020827801137.
- Borcan, O., O. Olsson, and L. Putterman. 2018. “State History and Economic Development: Evidence from Six Millennia.” Journal of Economic Growth 23 (1): 1–40. doi:10.1007/s10887-017-9152-0.
- Bretton Woods Project (2017). “After 15 Years, World Bank’s Doing Business Report Still Missing the Mark’, 7 December.” London: Bretton Woods Project.
- Dombi, Á., and T. Grigoriadis. 2020. “State History and the finance-growth Nexus: Evidence from Transition Economies.” Economic Systems 44 (1): 100738. doi:10.1016/j.ecosys.2019.100738.
- Drumm, B. D. (2015). Distinguishing earth, water, fire and air: Factor analysis to determine the four fundamental elements of state capability. BSc thesis, Harvard College, Cambridge, MA.
- Easterly, W., J. Ritzen, and M. Woolcock. 2006. “Social Cohesion, Institutions, and Growth.” Economics and Politics 18 (2): 103–120. doi:10.1111/j.1468-0343.2006.00165.x.
- Gelb, A., and V. Ramachandran (2018, 16 January). “How to Avoid Indicator Scandals: Three Ways to Fix the Doing Business Index.” Center for Global Development. accessed 5 March 2019. https://www.cgdev.org
- Glaeser, E. L., and A. Shleifer. 2002. “Legal Origins.” The Quarterly Journal of Economics 117 (4): 1193–1229.
- Hall, R. E., and C. I. Jones. 1999. ”Why Do Some Countries Produce so Much More Output per Worker Than Others?.” The Quarterly Journal of Economics 114 (1): 83–116.
- Hallward-Driemeier, M., and L. Pritchett. 2015. “How Business Is Done in the Developing World: Deals versus Rules.” Journal of Economic Perspectives 29 (3): 121–140. doi:10.1257/jep.29.3.121.
- Iliev, P., and L. Putterman. 2007. “Social Capability, History and the Economies of Communist and Postcommunist States.” Studies in Comparative International Development 42 (1–2): 36. doi:10.1007/s12116-007-9002-8.
- Isham, J., M. Woolcock, L. Pritchett, and G. Busby. 2005. “The Varieties of Resource Experience: Natural Resource Export Structures and the Political Economy of Economic Growth.” World Bank Economic Review 19 (2): 74–141. doi:10.1093/wber/lhi010.
- La Porta, R., F. Lopez-de-Silanes, and A. Shleifer. 2008. “The Economic Consequences of Legal Origins.” Journal of Economic Literature 46 (2): 285–332. doi:10.1257/jel.46.2.285.
- Lee, S., D. McCann, and N. Torm. 2008. “The World Bank’s “Employing Workers” Index: Findings and Critiques – A Review of Recent Evidence.” International Labour Review 147 (4): 416–432. doi:10.1111/j.1564-913X.2008.00043.x.
- Martin-Prével, A., and F. Mousseau (2016, 3 November). ‘Neoliberalism for All: The World Bank’s Doing Business 2017’. Oakland Institute. Accessed 5 March 2019. https://www.oaklandinstitute.org
- Pritchett, L., M. Andrews, and M. Woolcock. 2013. “Seeing like a State: Techniques of Persistent Failure in State Capability for Implementation.” Journal of Development Studies 43 (1): 1–18.
- Raj, R., K. Sen, and S. Kar. 2020. “Unmaking “Make in India”: Weak Governance, Good Deals, and Their Economic Impact.” Economic and Political Weekly 55 (11): 43–53.
- Reed, W. R. 2015. “´on the Practice of Lagging Variables to Avoid Simultaneity´.” Oxford Bulletin of Economics and Statistics 77 (6): 897–905. doi:10.1111/obes.12088.
- Sandefur, J., and D. Wadhwa (2018, 18 January). ‘Chart of the Week #3: Why the World Bank Should Ditch “Doing Business” Rankings – In One Embarrassing Chart’. Center for Global Development. Accessed 5 March 2019. https://www.cgdev.org/blog/chart-week-3-why-world-bank-should-ditch-doing-business-rankings-one-embarrassing-chart
- Savoia, A., and K. Sen. 2015. “Measurement, Evolution, Determinants and Consequences of State Capacity: A Review of Recent Research.” Journal of Economic Surveys 29 (3): 441–458. doi:10.1111/joes.12065.
- World Bank, Doing Business (2018, October 31). Doing Business 2019: Training for Reform. Washington, DC: International Bank for Reconstruction and Development/The World Bank. accessed 2 July 2019. https://www.doingbusiness.org/en/reports/global-reports/doing-business-2019
- Zumbrun, J., and I. Talley (2018, 12 January). ‘World Bank Unfairly Influenced Its Own Competitiveness Rankings’. The Wall Street Journal, January 12. Accessed 5 March 2019. https://www.wsj.com/articles/world-bank-unfairly-influenced-its-own-competitiveness-rankings-1515797620