Abstract
We study a deterministic continuous-time predator–prey model with parasites, where the prey population is the intermediate host for the parasites. It is assumed that the parasites can affect the behavior of the predator–prey interaction due to infection. The asymptotic dynamics of the system are investigated. A stochastic version of the model is also presented and numerically simulated. We then compare and contrast the two types of models.
1. Introduction
Since the pioneering work of Kermack and McKendrick Citation17 on an SIRS model, epidemic models have received considerable attention in the scientific community. Many of these mathematical models have contributed to the understanding of the evolution of the diseases and provide valuable information for control strategies. We refer the reader to Citation3 Citation5 Citation8 Citation13 Citation19 and literature cited therein for general epidemic models. On the other hand, the majority of the epidemic models in the literature deal with evolution of the disease within a population. More recently, researchers have investigated predator–prey models with infectious diseases Citation7 Citation11 Citation12.
It is well documented that parasites can play an important role in shaping population and community dynamics and maintaining bio-diversity Citation15 Citation16. For trophically transmitted parasites, the populations are transmitted up the food chain from immediate host species to the definite host populations via predation. Consequently, the interactions between prey and predator are affected by the presence of the parasites. For instance, it is often found that infected individuals are less active and hence can be caught more easily Citation14. However, for the parasites to be successful, it is important to restrict host's predation mortality as well as the disease related mortality.
In this manuscript we study a deterministic predator–prey model with parasites, where the parasites are not explicitly modeled. The modeling assumptions are similar to that given by Fenton and Rands Citation10. The community under current investigation is composed of two host species, one preys on the other. The predator–prey populations harbor parasites that use the prey species as an intermediate host to transmit the disease to the definitive host, the predator species. The infection rate is modeled by the simple mass action and we use a Holling type I function to model the functional response of the predator. The resulting model consists of four ordinary differential equations. Existence conditions for boundary and interior steady states are derived and some global results are obtained using a simple comparison method. We also perform numerical simulations to study the model. A stochastic model based on the deterministic model is formulated in terms of continuous time Markov chain and simulated numerically. We then compare and contrast the two models.
The deterministic model presented here is different from the predator–prey models studied by Chattophadhyay and Arino Citation7, by Hadeler and Freedman Citation11, and by Han et al. Citation12. In Citation11, it is assumed that both the infected and uninfected prey can reproduce at the same rate and there is no disease related mortality for both the infected prey and predator. Moreover, the authors use a Holling II functional to model the predation. However, the force of infection is also modeled using simple mass action. Han et al. Citation12 on the other hand study four predator prey models with infectious diseases, where both simple mass action and standard incidence are investigated. However, their models are based on the decomposition of the logistic differential equation. In Citation7, it is also assumed that both infected and uninfected prey can reproduce and with the same rate.
Our model derivation is based on a model proposed by Fenton and Rands Citation10. Although no rigorous mathematical analysis was presented in Citation10, it was found in Citation10 that increasing the parasite's manipulation will decrease the uninfected predator population size and so that the population may become extinct in the stochastic reality of the natural world if parasite's manipulation is too high. Our numerical study shows that increasing the parasite's manipulation increases both the infected prey and predator population sizes of the periodic solution. Therefore increasing parasite manipulation is likely to increase its persistence in the deterministic world. Moreover, the persistence result for the parasite derived in this study is expressed in terms of a threshold that involves only the nontrivial boundary steady state with nonzero uninfected populations. The expression is very easy to verify and also shows that the parasite will be more likely to survive if its manipulation is larger. These analytical results no longer hold when we consider a corresponding continuous-time Markov chain model. Both the infected and uninfected prey and predator populations may become extinct in the stochastic model while they can persist in the deterministic model.
In the following section a deterministic model is presented. A stochastic model is given in Section 3 and the final section provides a brief summary and discussion.
2. A deterministic model
We assume that the parasite is a microparasite and so the parasite population is not explicitly modeled in the system. We only consider an individual of each species as infected or uninfected. Let x 1 and x 2 denote the uninfected and infected prey populations, respectively, and y 1 and y 2 be the uninfected and infected predators, respectively. In the absence of the predator and the parasite, the prey population reproduces at per capita rate r with carrying capacity 1/q. It is assumed that the infected prey does not reproduce.
We adopt a simple Holling type I function as the functional response, and let e denote the predator conversion rate. Since infected prey may increase its probability of being preyed upon, we let θ denote the factor that effects the interaction between prey and predator. The predator preys on both infected and uninfected prey indiscriminately when θ=1. If θ<1, then the infected prey has a less chance of being captured. The infected prey will be more likely to be preyed upon if θ>1. The natural death rates of the infected prey and predator are denoted by d 1 and d 2 respectively. The disease related mortality rates of the prey and predator populations are denoted by α1 and α2. These parameters are assumed to be constants.
A simple mass action is used to model the force of infection between infected prey and uninfected predator. The parasites in the predator produce infective stages at a constant rate λ, which are passed into the environment where they either die at rate μ or are consumed by the prey at a rate ν. For simplicity, it is assumed that the external parasite stages are short and fast and so we do not model them explicitly in the model. Under these biological assumptions, the model takes the following form:
We first convert system Equation(1) into a dimensionless form. Let
Lemma 2.1
Solutions of system (2) remain non-negative and are bounded.
Proof
Since ,
and
, solutions of system Equation(2)
remain non-negative. Let
. Then
. It is clear that there exists M>0 such that x
1 (t)≤M for all t≥0. Hence
, where
. As a result,
and solutions of system Equation(2)
are bounded. ▪
If initially there is no predator population, then the prey population will stabilize in its carry capacity level K. That is, if , then
for t>0 and
if x
1 (0)>0. On the other hand if
, then
for all t>0 and system Equation(2)
reduces to the following two-dimensional system:
We now begin to study simple solutions of system Equation(2). The system always has two steady states: E
0=(0, 0, 0, 0), the extinction steady state where both prey and predator populations cannot survive, and E
1=(K, 0, 0, 0), where only the uninfected prey can survive. The Jacoban matrix of system Equation(2)
evaluated at E
0 has the following form:
Lemma 2.2
The steady state E
1=(K, 0, 0, 0) is globally asymptotically stable for system (2) in
if K<d
2.
Proof
Notice . Since
, for any given ϵ>0 there exists t
0>0 such that
for t ≥ t
0. We choose ϵ>0 so that
. It follows that
for t ≥ t
0 and hence
. Therefore for any given ϵ>0 we can find t
1>0 such that
for t ≥ t
1. Thus
for t ≥ t
1 implies
since ϵ>0 was arbitrary. Consequently, for any ϵ>0, there exists t
2>0 such that
for t ≥ t
2, and from the x
2 equation in system Equation(2)
, we obtain
. As a result,
if x
1(0)>0 and the proof is complete. ▪
We now assume K > d
2 for the remainder of the discussion. Letting x
2=y
2=0, we obtain another steady state , where x¯
1=d
2 and
. This is the steady state for which only the uninfected prey and predator can survive and the parasites cannot invade the populations. The corresponding Jacoban matrix has the following form:
Lemma 2.3
Let K>d
2. Then steady state
exists, where x¯1=d
2
and
. If
, then E
2
is globally asymptotically stable in Γ.
Proof
Since d
2<K, steady state E
2 exists. We apply a simple comparison method. Observe that . Given any ϵ>0 we can find t
0>0 such that
for t ≥ t
0. By our assumption, we can choose ϵ>0 so that
. Then for t ≥ t
0 we have
Since Hopf bifurcation is impossible to occur for system Equation(2) when E
2 loses its stability by the discussion just before Lemma 2.3, we next investigate the existence of interior steady states. Let (x
1, x
2, y
1, y
2) denote a positive equilibrium. Its components must satisfy the following equations:
Lemma 2.4
Let K>d
2. Then system (2) has no interior steady state if inequality
Equation(4)
holds, i.e., if E
2
is locally asymptotically stable, and system
Equation(2)
has a unique interior steady state
if
Equation(4)
is reversed, i.e., if E
2
is unstable. Moreover, system
Equation(2)
is uniformly persistent if inequality
Equation(4)
is reversed.
Proof
Suppose Equation(4) holds. Then f(d
2)<0. We claim that system Equation(2)
has no interior steady state. If β≤e, then f is concave up with f(0)=c. If c≤0, then EquationEquation (6)
has a positive solution x
1*>K. Hence system Equation(2)
has no feasible interior steady state by EquationEquation (5)
. Similarly, if c>0, then EquationEquation (6)
may have two positive solutions. However, since f(d
2)<0 and f(K)<0, these two solutions will not lie between d
2 and K as required in EquationEquation (5)
, and hence system Equation(2)
has no interior steady state. If β>e, then f is concave down. If c≥0, then since f (d
2)<0 there is no interior steady state by EquationEquation (5)
. Observe that the solutions of EquationEquation (6)
vary continuously with respect to coefficients a, b, and c. Fix any a, b, and c with a<0. If c=0, then EquationEquation (6)
has a unique positive solution −(b / a) provided b>0, where −(b / a)<d
2 since f(d
2)<0. Suppose c<0. If EquationEquation (6)
has a unique positive solution then this positive solution is (−b/2a) with b>0 and b
2−4ac=0, which is clearly less than d
2 since
. If EquationEquation (6)
has two positive solutions denoted by x
11* and x
12* with
, then it is necessary that b>0. It follows that
. We conclude that system Equation(6)
has no solutions satisfying system Equation(5)
and as a result system Equation(2)
has no interior steady state. Suppose inequality Equation(4)
is reversed. Then steady state E
2 is unstable and it is necessary that β>e, i.e., f is concave down. If f(0)≥0, then since f(d
2)>0 and f(K)<0, system Equation(6)
has a unique positive solution x
1* that lies between d
2 and K. Hence system Equation(2)
has a unique interior steady state. Similar conclusion is reached if f(0)<0. We conclude that system Equation(2)
has a unique interior steady state
if inequality Equation(4)
is reversed. To prove uniform persistence of system Equation(2)
, first notice system Equation(2)
is dissipative by the proof of Lemma 2.1. It is clear from J(E
0) that the stable manifold of E
0 lies on the x
2
y
1
y
2-hyperplane and the unstable manifold lies on the x
1-axis. Since an eigenvector of J(E
1) with respect to
can be chosen to be
, the unstable manifold of E
1 lies outside of the positive cone of ℝ4 and the stable manifold of E
1 lies on the x
1
x
2
y
2-hyperplane. Furthermore, since inequality Equation(4)
is reversed, J(E
2) has a unique positive eigenvalue
. An eigenvector of J(E
2) belonging to λ+ within scalar multiplications is
with [ytilde]
1<0 and, therefore, the unstable manifold of E
2 also lies outside of
. Let
denote the negative eigenvalue of J
2. Then an eigenvector of J(E
2) associated to λ− has the form
with ŷ
2<0. Therefore, the stable manifold of E
2 also lies outside of the interior of
. We conclude that the boundary flow of system Equation(2)
is isolated and acyclic with acyclic covering {E
0, E
1, E
2}, where the stable set of each E
i
does not intersect with the interior of
for i=0, 1, 2. Consequently, system Equation(2)
is uniformly persistent by Citation6. ▪
From an earlier discussion, we can conclude that system Equation(2) undergoes a transcritical bifurcation when E
2 becomes nonhyperbolic. Recall in the boundary equilibrium
we have x¯
1=d
2 and
. Therefore
, and
Furthermore, using the original model parameters, inequality Equation(4) can be rewritten as
We remark that the left-hand side of inequality Equation(7) is different from R
0, the basic reproductive ratio, defined in EquationEquation (2)
of Citation10. Indeed, in terms of our notations of system Equation(1)
, R
0 defined in Citation10 is
We now use numerical simulations to study system Equation(2). We adopt the following parameter values: K=5, d
2=0.5000,
,
, e=0.1000, and
. Since K > d
2, steady state E
1=(K, 0, 0, 0) is unstable and there is another boundary steady state
with x¯
1=0.5, and y¯
1=10. We calculate θ for which the left-hand side of Equation(7)
is one, denoted by θ
c
, where
for our parameter values. Recall that E
2 is locally asymptotically stable when inequality Equation(7)
holds. In particular, inequality Equation(7)
is true if and only if
. Although it is not presented here, numerical simulations showed that solutions with positive initial conditions converge to E
2 for
for the initial conditions randomly chosen.
Once θ passes beyond θ
c
, steady state E
2 becomes unstable and the model has a unique interior steady state E* by our earlier mathematical analysis. Simulations do reveal the existence of a unique interior steady state E* and all solutions with positive initial conditions randomly simulated converge to the interior steady state when θ is only little larger than θ
c
. Therefore, numerical simulations confirm our earlier observation that Hopf bifurcation cannot occur when E
2 loses its stability. However, as we increase θ to 0.0571, a positive periodic solution exists. Therefore, a Hopf bifurcation has occurred when θ is larger than and less than 0.0571. The x
2, y
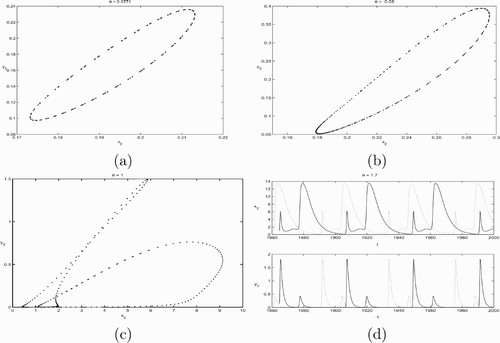
2 components of the periodic solution are plotted in and with different θ values.
Notice the positive periodic solution that appears in corresponds to a positive fixed point of the associated Poincaré map for system Equation(2). The bifurcation of the fixed point for the Poincaré map is itself a bifurcation of the periodic solution for system Equation(2)
. If it is a saddle node bifurcation of the map, then it would imply the birth and disappearances of two periodic solutions. If it is a period two bifurcation, then the positive periodic solution will double its period.
As we increased θ, we noticed that the positive periodic solution becomes nonoval. It was suspected that the periodic solution either doubled its period or the system has two positive periodic solutions as shown in and . However, a closer examination reveals that the same periodic solution persists with roughly the same period. See for the x
2, y
2 components of the solution with initial condition and
when θ=1.7. The solutions took much longer to converge to the positive periodic solution. Therefore, we conjecture that the positive periodic solution is globally asymptotically stable whenever it exists. We also tested the system for sensitive dependence on initial conditions for large values of θ and found that the model is not sensitive to initial conditions.
Figure 1. This figure plots solutions of system Equation(2) with parameter values K=5, d
2=0.5000, α2=0.2000, β=0.8000, e=0.1000, and γ=0.2000. When θ=0.0571, the x
2, y
2 components of the solution is plotted in (a). (b) provides the x
2, y
2 components of the solution with θ=1.0. (c) plots the x
2, y
2 components of a solution with initial condition (1.8252, 2.6981, 1.8207, 0.4637) after some transient behavior has been truncated with θ=1. (d) plots x
2 and y
2 components of two solutions against time with θ=1.7.
3. A stochastic model
In the previous section we used a deterministic model to study the interaction between prey, predator, and parasites. It was implicitly assumed in the model that only one possible reality can evolve under time by obeying the laws governed by the ordinary differential Equationequations (1). Since the process of population interaction might evolve in an indeterminacy manner, in this section we propose a stochastic model, a counterpart of system Equation(2)
, to study population interaction. Specifically, we will use a continuous-time Markov chain model to study the population interaction under random effects. We refer the reader to Citation1
Citation4 for stochastic models with applications to biology.
Let , and y
2(t) denote the random variables of the uninfected prey, infected prey, uninfected predator, and infected predator, respectively. The time t is continuous, however, the values of the random variables are discrete. Given the deterministic model Equation(2)
, we assume for Δ t sufficiently small that the transition probabilities
are given by
Of course, there are many different stochastic models that correspond to the same deterministic model Equation(2), but we shall use the above formulation. Similar to the Poisson process, the random variable for the interevent time has an exponential distribution. The resulting model is a multivariate process and we will not pursue the study analytically. Instead we will focus on numerical simulations to study the stochastic process.
To simulate our model, we use the same parameter values as for the deterministic model Equation(2). Specifically, we choose d
2=0.5000,
,
, e=0.1000,
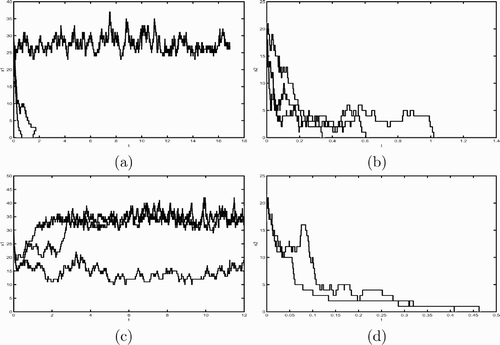
, and K=5. When θ=0.02, the deterministic model assures that both the uninfected prey and predator can persist. This is not the case for our stochastic model. From the sample paths given in we see that some uninfected prey populations do go to extinction. However, for the sample paths provided in that the infected prey all become extinct. We then increase θ to 0.55. According to our previous study on the deterministic system, it is known that both the infected and uninfected prey and predator can persist. This is not true again for the continuous-time Markov chain model. Although it is clear that the uninfected prey populations can survive for the sample paths simulated in , it is not the case for the infected prey population as shown in .
Figure 2. This figure plots three sample paths of the continuous-time Markov chain model with parameter values d 2=0.5000, α2=0.2000, β=0.8000, e=0.1000, θ=0.2, γ=0.2000, and K=5. (a) and (b) plot three sample path for x 1 population size and x 2 population size, respectively, when θ=0.02. (c) and (d) plot x 1 and x 2 populations, respectively, when θ=0.55. The initial population size is (50, 1, 20, 1) for all simulations.
4. Discussion
In this manuscript we investigated a deterministic predator–prey model with an infectious disease. Both the uninfected prey and predator can become infected and thus infectious when they interact with infected individuals in the other species. In terms of the original parameters, we see that the predator will become extinct if . This is due to the predator's large natural death rate which cannot be compensated by the predation. Notice that this inequality does not depend on θ.
When the above inequality is reversed and inequality Equation(7) holds, then only the uninfected prey and predator can persist. Observe now that θ plays a role in the persistence of the infected populations. In particular, inequality Equation(7)
is true if θ is small when other parameter values are kept at the same values. The left-hand side of inequality Equation(7)
increases with increasing θ. When inequality Equation(7)
is reversed, it was showed that there is a unique interior steady state and hence the infected populations can survive. Consequently, we conclude that the parasites are more likely to persist if the infected prey is more likely to be preyed upon. On the other hand, since the left-hand side of inequality Equation(7)
is a decreasing function of α1 and α2, we see that decreasing disease related mortality for both the prey and predator populations can promote persistence of the parasites. Therefore, the parasite cannot be too lethal in order for its survival.
Moreover, as we increase θ, the interior equilibrium becomes unstable and there is a positive periodic solution for the system. As a result, there is a periodic outbreak of the disease in the populations. The infected population levels remain low for sometime before they reach high population sizes. This phenomenon may cause serious problems if the prey and/or predator populations are our natural resources.
We also formulate a stochastic model using a continuous-time Markov chain, where the time is continuous and the random variables are discrete. No mathematical analysis is performed on this stochastic model. However, numerical simulations for this specific formulation conclude that populations can always become extinct due to random effects of demography, predation, and transmission of the disease, as compared with the circumstance when the populations can persist in the deterministic model. The results of the stochastic model make the interaction between these populations more unpredictable. In addition to the life strategies that evolve over time to increase fitness for the populations, the persistence of the populations may however depend largely on chance.
Additional information
Notes on contributors
Sophia R.-J. Jang
Current address: Department of Mathematics Statistics, Texas Tech University, Lubbock, TX, USAReferences
- Allen , L. J.S. 2003 . An Introduction to Stochastic Processes with Applications to Biology , Upper Saddle River, NJ : Prentice Hall .
- Allen , L. J.S. 2006 . An Introduction to Mathematical Biology , Upper Saddle River, NJ : Prentice Hall .
- Anderson , R. M. and May , R. M. 1986 . The invasion, persistence, and spread of infectious diseases within animal and plant communities . Philos. Trans. R. Soc. Lond. Biol. Sci. , 314 : 533 – 570 .
- Bailey , N. 1990 . The Elements of Stochastic Processes with Applications to Natural Sciences , New York : John Wiley & Sons .
- Brauer , F. and Castillo-Chavez , C. 2001 . Mathematical Models in Population Biology and Epidemiology , New York : Springer .
- Butler , G. and Waltman , P. 1986 . Persistence in dynamical systems . J. Differ. Equ. , 63 : 255 – 263 .
- Chattophadhyay , J. and Arino , O. 1999 . A predator–prey model with disease in the prey . Non-linear Anal. , 36 : 747 – 766 .
- Diekmann , O. and Heesterbeek , J. 2000 . Mathematical Epidemiology of Infectious Diseases , Chichester : Wiley .
- Dobson , A. and Keymer , A. 1985 . Life history models, in Biology of the Acanthocephala , Edited by: Crompton , D. and Nickol , B. 347 – 384 . Cambridge, , UK : Cambridge University Press .
- Fenton , A. and Rands , S. A. 2006 . The impact of parasite manipulation and predator foraging behavior on predator-prey communities . Ecology , 87 : 2832 – 2841 .
- Hadeler , K. P. and Freedman , H. I. 1989 . Predator–prey populations with parasite infection . J. Math. Biol. , 27 : 609 – 631 .
- Han , L. , Ma , Z. and Hethcote , H. W. 2001 . Four predator prey models with infectious diseases . Math. Comput. Modelling , 34 : 849 – 858 .
- Hethcote , H. 2000 . The mathematics of infectious diseases . SIAM Rev. , 42 : 599 – 653 .
- Holmes , J. and Bethel , W. 1972 . Modification of intermediate host behaviour by parasites . Zool. J. Linn. Soc. , 51 : 123 – 149 . Behavioural Aspects of Parastie Transmission (Suppl I)
- Holt , R. D. and Pickering , J. 1985 . Infectious disease and species coexistence: A model of Lotka–Volterra form . Am. Nat. , 126 : 196 – 211 .
- Hudson , P. J. , Dobson , A. and Newborn , D. 1998 . Prevention of population cycles by parasite removal . Science , 282 : 2256 – 2258 .
- Kermack , W. O. and McKendrick , A. G. 1927 . Contributions to the mathematical theory of epidemics: Part I . Proc. R. Soc. Lond. A , 115 : 700 – 721 .
- Thieme , H. R. 1992 . Convergence results and a Poincaré–Bendixson trichotomy for asymptotically autonomous differential equations . J. Math. Biol. , 30 : 755 – 763 .
- Thieme , H. R. 2003 . Mathematics in Population Biology , Princeton : Princeton University Press .