
 ?Mathematical formulae have been encoded as MathML and are displayed in this HTML version using MathJax in order to improve their display. Uncheck the box to turn MathJax off. This feature requires Javascript. Click on a formula to zoom.
Abstract
We model the extent to which age-targeted protective sequestration can be used to reduce ICU admissions caused by novel coronavirus COVID-19. Using demographic data from New Zealand, we demonstrate that lowering the age threshold to 50 years of age reduces ICU admissions drastically and show that for sufficiently strict isolation protocols, sequestering one-third of the countries population for a total of 8 months is sufficient to avoid overwhelming ICU capacity throughout the entire course of the epidemic. Similar results are expected to hold for other countries, though some minor adaption will be required based on local age demographics and hospital facilities.
1. Background
COVID-19, the infectious disease caused by the SARS-CoV-2 virus, was initially observed in Hubei province of China during December 2019 and has since spread to all but a handful countries, causing (as of the time of writing) an estimated 1.7 million infections and 100, 000 deaths ([Citation13], April 11th 2020). COVID-19 has a basic reproductive number, , currently estimated in the region of 2.5–3 [Citation6]. Social distancing and general quarantine measures can reduce
temporarily, but not permanently. For
, left unchecked COVID-19 can be expected to infect more than 90% of the population, with
of the population infected at the epidemic peak. Even with significant quarantine measures in place the population will not reach ‘herd immunity’ to this virus until 2/3 of the population has gained resistance – either through vaccination or infection and subsequent recovery.
In order to place these numbers in a concrete context, a recent survey in New Zealand indicated that the country had a total of 520 ventilator machines [Citation7]. Given the country's demographics (see Table ), and current estimates of ICU risk per age cohort, the country would expect to see at minimum 66,000 ICU patients over the course of an epidemic. Thus, assuming that severe cases require 14 days in ICU, treatment of all patients would require over 900,000 ventilator days – amounting to 5 years of continuous use of all ventilators. This is 15 times more demand than could be accommodated in the expected 4 months span of an unmitigated epidemic. The details of this calculation may vary from country to country, but the final conclusion is ubiquitous: hospitals are not prepared for this disease.
Table 1. Here we provide demographic data for New Zealand [Citation10], along with risk of ICU admission per infection for each age group [Citation3]. Finally we give the expected number of ICU admissions, assuming  of each age category becomes infected over the course of the epidemic- the minimum required to reach herd immunity.
Efforts to ‘flatten the curve’ will need to reduce the epidemic peak not merely by a factor of 2, but instead by an order of magnitude or more. Even in the most optimistic scenarios, for the most well-equipped countries, such efforts must be maintained for years on end.
Societal lockdown may be effective at eradicating COVID-19 locally, but when lockdown is complete a large susceptible population will remain; if the virus is later re-introduced, as expected in our globalized and interconnected world, a new epidemic is likely to occur. While buying time allows for manufacturing of new medical equipment, and further scientific investigations, lockdown efforts cannot be maintained indefinitely. Even optimistic predictions anticipate a vaccine will take no less than 1 full year to develop. For this reason, it proves necessary to discuss not just what measures are needed but also how society might return to normal in places where eradication fails, and over what time frame this can be achieved.
2. Targeted sequestration
As has been observed in South Korea [Citation5], death rate is tightly correlated with age. While deaths in younger age categories are observed, a recent report from Italy [Citation9] indicates that the vast majority of deaths occur in patients with known pathologies. It should thus be possible to predict who is most at risk with high fidelity. By controlling which 2/3rds of the population become infected we may avoid overtaxing the healthcare system and thus minimize mortality.
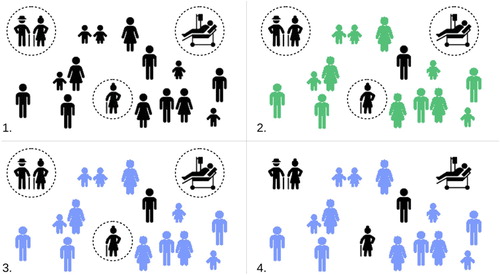
We consider a strategy in which initially all of society (bar essential service workers) are locked down for 2–4 weeks so as to break the initial uncontrolled epidemic spread. At the end of this time, rather than reduce social distancing measures uniformly over all society, a government could instead engage in a program of ‘targeted sequestration’; those individuals with no risk factors would be encouraged to return to work and socialize, while at risk individuals would be asked to remain at home and strictly reduce external contacts (‘protective sequestration’). The infection would be allowed to pass through the large, low risk population, resulting in a small number of ICU admissions due to occasional unexpected complications. Once the epidemic has passed through the low risk population, sequestration measures can be lowered in stages, with each stage exposing successively higher risk populations. Despite the increased risk on the individual level, the reduced susceptible population for each subsequent stage would lead to a natural ‘flattening of the curve’, and a smaller fraction of these later populations becoming infected. Eventually herd immunity would be achieved, and restrictions on interaction could be dropped entirely. Figure gives a schematic representation of this approach.
Figure 1. A schematic illustration of protective sequestration. Susceptible population in black, infectious population in green, and recovered population in blue. (1) We sequester at risk populations as quickly, and as strictly as possible. (2) COVID-19 is allow to spread through the large, low risk population. This leads to a small number of hospitalizations, which the hospital system is able to cope with. (3) The low risk population recovers, and herd immunity is achieved. (4) Quarantine is (cautiously) removed, and high risk individuals are able to return to normal social activity.
Similar strategies were alluded to by Ferguson et al. [Citation3], who advised social distancing for those over the age of 70, and investigated explicitly by Chikina and Pegden [Citation2], who completed a comprehensive sensitivity analysis suggesting a significant reduction in mortality for a wide range of parameters. Both papers proposed a fixed age of division (70 and 65 years of age, respectively), and explored what might be considered reasonable parameter ranges of ‘contact reduction’, predicting, even in their most optimistic estimates, hundreds of thousands of fatalities. There is, however, no reason to restrict the age threshold to 65 or 70 years of age, and, as we shall show, lowering this age threshold to 50, can reduce fatalities substantially.
3. The model
In order to illustrate the general approach described above, we consider a simple Susceptible-Infectious-Recovered (SIR) type model, in which our population is divided both by disease status and by age cohort [Citation1]Footnote1. Here we lump people by decade, as this is the granularity that fatality rates and ICU admission data are reported. We assume mean infectious period , and a fixed infection rate
, with
[Citation12]. Interactions between age cohorts are governed by the contact matrix
. Entry
gives the contact rate between age cohort i and age cohort j. This is the system parameter that can be changed through public policy and human behaviour.
(1)
(1)
In order to simulate targeted sequestration measures, we select some threshold age A, and some time window during which sequestration measures apply. We define two contact matrices, one for the sequestration period, and one for the non-sequestration period. These matrices take the form:
(4)
(4) During sequestration, we assume a contact rate
, for high risk individuals (i, j>A), and
across risk categories. Individuals in the low risk group (
) have contact rate
where
is the total population low risk population. (
gives the higher risk sequestered population. Similarly
gives the susceptible sequestered population, and
gives the infectious population not under sequestration .) This choice of
approximately preserves the total number of interactions experienced by the non-sequestered population, by compensating for the loss of interaction caused by the removal of the sequestered individuals.
ICU demand at any given time is given by , where here
is the probability of ICU admission for age category k (see Table ). Cumulative ICU bed demand is
. Full R code for all models is publicly available on Github [Citation4]. Readers are encouraged to adapt demographic and clinical parameters based on their own circumstances, and in response to further research.
4. Results
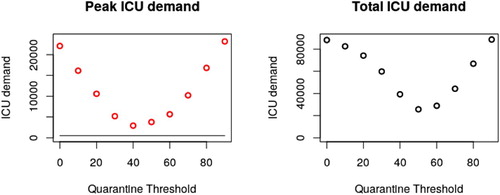
Simulation of the above system for a range of age thresholds A results in ICU demand as depicted in Figure . Figure summarizes peak ICU demand as a function of A. Peak ICU demand is minimized for a threshold , and total ICU demand is minimized for
.
Figure 2. Epidemic curves assuming 110 days of sequestration (), for a variety of age thresholds A. Available ventilator numbers are given by the black line. Note that the results of restricting contact for everyone and no one are largely the same, with lockdown measures simply delaying the peak. An age cut off of 50 years (teal curve) captures a large enough portion of the population to achieve herd immunity, while reducing fatalities compared to cut offs at 60 or 70 years.
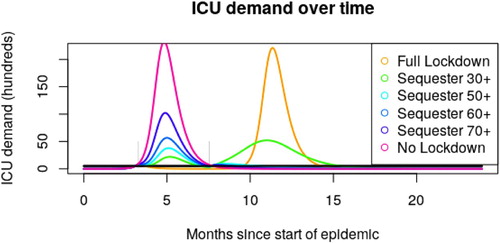
Figure 3. Depending on the placement of our age threshold, both peak and total ICU admissions vary. Given that hospital facilities are rapidly overwhelmed in even the best case scenario above, total ICU demand is expected to be a reasonable proxy for total fatalities. A threshold at 50 years of age minimizes this number. Exploration of parameter space (Appendix 2) suggests that this threshold is robust to changes to and γ, but varies based on local demographics. Changing the risk profile of our age groups results in the same optimal age threshold, so long as risk is still correlated with age (though results are better with stronger correlation).
In order to understand the importance of our various contact rate parameters, it proves useful to determine the total number of infections due to imperfect sequestration (that is contact between your high and low risk populations). This value is well approximated by
(5)
(5)
Derivation of this expression is given in Appendix. Figure verifies this expression for a variety of values by comparing Equation (Equation5
(5)
(5) ) to the results of full scale SIR simulation.
Figure 4. Total infections caused by contact between sequestered individuals and the wider population assuming . Black circles give the predictions based on full SIR dynamics, red crosses give the predictions of Equation Equation5
(5)
(5) . Note that these calculations only include infections caused by imperfect sequestration and ignore infections occurring either outside the high risk population, or outside the period of sequestration.
![Figure 4. Total infections caused by contact between sequestered individuals and the wider population assuming κH=0.1. Black circles give the predictions based on full SIR dynamics, red crosses give the predictions of Equation Equation5(5) Infections from leakage=NH(1−exp[−βκ×RL(∞)γN−βκQNH]).(5) . Note that these calculations only include infections caused by imperfect sequestration and ignore infections occurring either outside the high risk population, or outside the period of sequestration.](/cms/asset/6d48b375-b013-436f-8fad-f70b73c6ca5c/tjbd_a_1795285_f0004_oc.jpg)
While complicated at first glance, Equation (Equation5(5)
(5) ) provides two key insights: first, we observe that all reductions in cross category contact rate,
, lead to a corresponding reduction in infections – halving
will (approximately) halve the number of high risk individuals getting infected. Second, we observe the importance of keeping
well below the epidemic threshold. So long as
, distancing measures are strict enough to prevent self-sustaining chains of infection in the sequestered population and
has only moderate impact. However, if the contact rate
approaches the threshold
, the number of infections increases very quickly. Hence while it is preferable to keep
as small as possible, it is critical to keep
small enough. Once this has been achieved, efforts can be focused elsewhere.
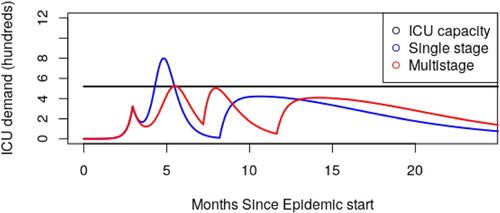
So far we have seen how careful selection of age threshold can reduce ICU admission (Figure ) and also how reducing cross group contact reduces infection (Figure ). This leads naturally to the question of ‘What is our best case scenario – how do we achieve this outcome?’ In Figure , we showed how a single stage quarantine approach can decrease mortality. In Figure , we show how a two stage approach can do even better, under ideal circumstances bringing peak ICU demand below capacity. Given that ICU overflow translates almost directly to patient mortality, this is a very desirable goal.
Figure 5. Assuming perfect division between age groups (), we are able to keep ICU demand below ICU capacity using a multi-stage release strategy. For the blue curve, we sequester everyone over 50 years of age from day 90 till day 250 (5 months). For the red curve, we sequester everyone over 50 years of age from day 90 to 220, and everyone over 60 years of age from day 220 to 355 (that is to say, two 4-month windows). At no point is the under 50 population sequestered, although moderate social distancing is required in the first window. Sequestering only the 60+ cohort in the first 5-month window (as opposed to 50+) leads to overflowing ICU capacity by a factor of 5. Note: Our goal here is to demonstrate the possibility of staying below ICU capacity, not to propose a specific calendar that should be followed. These figures should be taken as indicative as opposed to prescriptive.
5. Discussion
5.1. Logistics
Above we have simulated a variety of possible containment strategies through simply changing a few parameter values. Implementing such policies in real life will be significantly harder. A few of the most pressing logistical issues which need analysis are:
Establishing food delivery infrastructure so that sequestered individuals can stay at home.
Partitioning health care facilities so as to prevent mixing between treatment groups.
Communication and public education so that people understand both what is required for the approach to work, and how it benefits them.
Rearranging our workforce, so as to account for the large number of senior staff who will no longer be available in person.
Identifying new jobs that will need to be carried out, so as to maintain division between age categories as effectively as possible.
The existence of mixed-age-group houses significantly complicates efforts to minimize
5.2. Assumptions to be investigated
We have explored means of minimizing the death toll and burden on the medical system. This work is based on a number of assumptions. Each of these assumptions must be verified before any of the above plans are implemented:
We have taken the ICU admission rates provided by Ferguson et al. as our baseline assumption [Citation3]. If it is later found that the ICU admission risk amongst younger generations are higher than expected, it is likely that ICU capacity will be exceeded. Nonetheless, separation of age cohorts still leads to a net improvement in outcome compared to homogeneous epidemic response, as it allows the medical system to deal with separate epidemic peaks as opposed to a single larger peak [Citation2].
We assumed that infection provides immunity or at least resistance to COVID-19. If it is found that infection does not result in subsequent resistance, or resistance is short lived, then any protocol that depends on herd immunity will fail.
We have made simplifying assumptions about community structure. It is likely that community structure, for example, the existence of retirement homes, is likely to result in small, highly connected susceptible communities, even after the vast bulk of the population is immune. Such communities would inevitably lead to a large number of ICU admissions if infected. This is likely to be an ongoing problem regardless of the approach taken, however, with the bulk of the population immune, we anticipate that spread of COVID-19 between such susceptible populations will be greatly reduced, making contact tracing easier, and spreading outbreaks out over a larger period of time (in comparison to many retirement homes being infected simultaneously, during the primary epidemic).
The plan proposed here reduces death substantially compared to unconstrained, or even partially constrained epidemics. However, it must be noted that outright prevention of an epidemic via contact tracing and containment, will, as always, provide superior results, wherever such approaches are implemented swiftly enough to prove successful.
5.3. Opportunities
There are a number of research avenues that may improve upon the outcomes we have described.
We have considered a simple age structured population; this was driven primarily by the availability of age structured ICU risk data. With better understanding of the underlying health conditions associated with severe COVID-19 outcomes, and better demographic data on the frequency of these risks, it will be possible to apply protective sequestration to high and medium risk individuals in our under 50 age cohort, and simultaneously, reduce isolation requirements for individuals over 50 who have a clean bill of health.
We assumed a ‘predetermined’ epidemic response strategy. Future developments in serological testing would allow more dynamic strategies to be adopted, based on weekly testing of antibody levels in the population; decisions on epidemic response measures could then be made based on observed immunity levels in the population, rather than simply occurring at 3-month intervals. Such screening and feedback would greatly mitigate various uncertainties in the model.
Finally, although here we have considered age-targeted sequestration as these approaches apply to the population of New Zealand, this was merely for the sake of concreteness; nothing in the approach described is specific to that country. Readers are encouraged to make use of our code [Citation4] and explore the dynamics given their own local demographic data. We consider the case of Indian and Italian demographic spread in Appendix 2.
6. Conclusion
Wherever possible, local eradication of SARS-CoV-2 via contact tracing and isolation is, as always, a preferable option. However, where this is no longer possible, protective sequestration measures can be a powerful method of reducing mortality. Previous authors [Citation2,Citation3] have alluded to and explored the use of age targeting, but such approaches, when only applied to retirees and those with significant health complications are almost guaranteed to overwhelm ICU capacity. By reducing the age threshold to 50, and including those with even moderate risk factors in the sequestration group, a staggered approach can be used to maintain ICU admissions below hospital capacity. Any government willing to take the extraordinary measure of shutting down all of society should, at the very least, consider the significantly less drastic measure of sequestering one-third of their population.
To the low risk population, our strategy offers a fast return to functional society, and, for those few who do get sick, access to medical facilities and staff who are dealing with a manageable number of cases. To the high risk population, targeted sequestration offers the possibility of avoiding COVID-19 altogether. By releasing a large portion of the population from lockdown after a small number of weeks, age-targeted sequestration balances the need to maintain a functional society and economy, with the limitations of hospital resources, and has the potential to significantly reduce casualties.
Acknowledgements
This work is based on modelling done in collaboration with the Interventional Modelling Team at the Department of Medical Microbiology and Infection Prevention at the University Medical Center Groningen. Further advice and feedback was provided by the Mathematical Biology team of the University of British Columbia. Special thanks to Corinna Glasner, Alejandra Herrera and Kate Sedivy-Haley for editorial comments are various stages of manuscript preparation. Person icons used in the figures from ‘The Noun Project’.
Disclosure statement
No potential conflict of interest was reported by the author(s).
Additional information
Funding
Notes
1 Exploration with a SEIR type model gives qualitatively similar results with respect to the relative ICU admission rates of proposed plans. See Appendix 2, Figure A3
References
- F. Brauer, C. Castillo-Chavez, and Z. Fen Texts in Applied Mathematics Mathematical Models in Epidemiology, Springer-Verlag, New York, 2019.
- M. Chikina and W. Pegden, Age-targeting for COVID-19 mitigation, Tech. rep., February 2020. Available at http://math.cmu.edu/˜wes/covid.html.
- Imperial College COVID-19 Response Team Neil M Ferguson. Impact of non-pharmaceutical interventions (NPIs) to reduce COVID-19 mortality and healthcare demand. Tech. rep., March 2020. Available at https://www.imperial.ac.uk/media/imperial-college/medicine/sph/ide/gida-fellowships/Imperial-College-COVID19-NPI-modelling-16-03-2020.pdf.
- A. Jamieson-Lane, alastair-JL/COVID_strategy, April 2020, original date: 2020-03-19T12:59:03Z
- KCDC Division of Risk assessment and International cooperation. The updates on COVID-19 in Korea as of 30 March, March 2020, available at https://www.cdc.go.kr/board/board.es?mid=a30402000000&bid=0030.
- Y. Liu, A.A. Gayle, A. Wilder-Smith, and J. Rocklöv, The reproductive number of COVID-19 is higher compared to SARS coronavirus, J. Travel Med. 27(2) (March 2020. Publisher: Oxford Academic. doi: 10.1093/jtm/taaa021
- NZ Ministry of Health. Intensive Care and Ventilator Capacity in District Health Boards, March 2020.
- Population Pyramids of the World from 1950 to 2100. Library Catalog. Available at www.populationpyramid.net.
- Report sulle caratteristiche dei pazienti deceduti positivia COVID-19 inItal iaIl presente reportè basato sui dati aggiornatial 17 Marzo 2020. Tech. rep., March 2020. Available at https://www.epicentro.iss.it/coronavirus/bollettino/Report-COVID-2019_17_marzo-v2.pdf.
- Stats NZ. Place Summaries | New Zealand | Stats NZ. Available at https://www.stats.govt.nz/tools/2018-census-place-summaries/new-zealand.
- L. Tindale, M. Coombe, J.E. Stockdale, E. Garlock, W. Yin, V. Lau, M. Saraswat, Y-H. Brian Lee, L.Zhang, D. Chen, J. Wallinga, and C. Colijn, Transmission interval estimates suggest pre-symptomatic spread of COVID-19, medRxiv, Publisher: Cold Spring Harbor Laboratory Press, March 2020, pp. 2020.03.03.20029983.
- WHO, WHO-china joint mission on covid-19 final report. Tech. Rep. WHO, February 2020
- Worldometer, Coronavirus Mortality Rate (COVID-19)-Worldometer, March 2020. Library Catalog. Available at www.worldometers.info
A. Appendix 1
Analytic formula for the effects of sequestration leakage
In order to understand the effects of our various parameters, we wish to estimate the effects of contact between our sequestered and non-sequestered populations. While simulations determine such results quickly enough, the determination of an analytic expression is useful for quickly judging the importance of each parameter. In order to determine such a formula, we proceed in three steps.
First, we calculate the number of infections a quarantined individual expected to receive from the non-quarantined population. This is equal to . Because
we find
. The value
is a function of
, found by solving
. In the case
.
For our next step, we must account for the fact that infections that enter our quarantined population may then spread (especially important when ). Whenever
, transmission is unable to sustain itself and this spread can be modelled as a subcritical branching process. Such a process leads to an expected population of
infections before extinction – that is to say, each imported infection is expected to lead to
infections total.
Multiplying the results of the previous two steps gives , the total number of infections due to quarantine leakage that each quarantined individual expects to encounter. The actual number of infections a given individual receives is Poisson distributed, and the probability of receiving zero infections is thus given by
.
In total combining the above, we end up with
(A1)
(A1) individuals infected due to quarantine leakage. This is given as Equation (Equation5
(5)
(5) ) in the main text.
A. Appendix 2: Exploration of parameter space
Here we give a brief exploration of parameter space, demonstrating the robustness of our results to changes in and age demographics (see Figures A1 and A2). We also consider replacing our SIR model with the more complicated SEIR model (Figure A3). While this has an effect on the timescale of our pandemic, the resulting ‘optimal approach’ is unchanged, hence we rely on the simpler SIR model in the main text.
Figure A1. Here we consider the effects of either increasing or decreasing markedly. While higher
results in a more severe epidemic, age threshold for sequestration that minimizes total ICU demand remains unchanged, and is largely determined by what fraction of the population is required to reach herd immunity. (Not pictured) Changes to γ while holding
constant have and even lesser impact, changing our timescale but having no effect whatsoever on peak or total ICU usage.
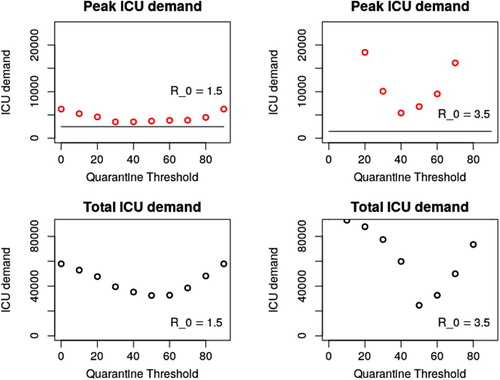
Figure A2. Here, we imagine holding total population constant while considering either a age distribution similar to India (median age 28.4 years) or Italy (median age 47.3 years) [Citation8]. The median age in NZ is 37.3 years. We observe that for older populations, the age threshold must be raised, and for younger populations it may be lowered. Generally speaking, the guiding principle is ‘what fraction of the population can be sequestered, while avoiding a second epidemic wave. As might be expected, younger populations have better health outcomes, although this effect may be complicated by variability in availability of medical services between regions.
![Figure A2. Here, we imagine holding total population constant while considering either a age distribution similar to India (median age 28.4 years) or Italy (median age 47.3 years) [Citation8]. The median age in NZ is 37.3 years. We observe that for older populations, the age threshold must be raised, and for younger populations it may be lowered. Generally speaking, the guiding principle is ‘what fraction of the population can be sequestered, while avoiding a second epidemic wave. As might be expected, younger populations have better health outcomes, although this effect may be complicated by variability in availability of medical services between regions.](/cms/asset/fd9b896d-3bad-4798-8967-f752ca441ce8/tjbd_a_1795285_f0007_oc.jpg)
Figure A3. We consider an SEIR type model, in which SARS-COV-19 is assumed to have an incubation period of 4 days[Citation11], and other infectious parameters are as stated previously. We observe that epidemic time is increased, but the overall response of each possible age threshold is largely uneffected.
![Figure A3. We consider an SEIR type model, in which SARS-COV-19 is assumed to have an incubation period of 4 days[Citation11], and other infectious parameters are as stated previously. We observe that epidemic time is increased, but the overall response of each possible age threshold is largely uneffected.](/cms/asset/073cfaf7-c192-40a6-a600-327b1acff82d/tjbd_a_1795285_f0008_oc.jpg)