
 ?Mathematical formulae have been encoded as MathML and are displayed in this HTML version using MathJax in order to improve their display. Uncheck the box to turn MathJax off. This feature requires Javascript. Click on a formula to zoom.
ABSTRACT
Self-medication is an important initial response to illness in Africa. This mode of medication is often done with the help of African traditional medicines. Because of the misconception that African traditional medicines can cure/prevent all diseases, some Africans may opt for COVID-19 prevention and management by self-medicating. Thus to efficiently predict the dynamics of COVID-19 in Africa, the role of the self-medicated population needs to be taken into account. In this paper, we formulate and analyse a mathematical model for the dynamics of COVID-19 in Cameroon. The model is represented by a system of compartmental age-structured ODEs that takes into account the self-medicated population and subdivides the human population into two age classes relative to their current immune system strength. We use our model to propose policy measures that could be implemented in the course of an epidemic in order to better handle cases of self-medication.
1. Introduction
COVID-19 is a zoonotic disease caused by a new coronavirus called Severe Acute Respiratory Syndrome Coronavirus Type 2 (SARS-CoV-2). Since the first reported case in December 2019 in Wuhan, China, COVID-19 has spread all over the world and was declared a pandemic by the World Health Organization (WHO) on March 11, 2020; the disease has since claimed over 360, 308 lives (as of May 28, 2020) [Citation7]. Humans across the globe are responding to it in diverse modalities. The modalities chosen depend on both cultural, socio-economical factors and perception of COVID-19 and are aimed at reducing the transmission of the virus or management of the disease. Some adopted measures include; social distancing, self-medication, regular washing of hands; and as a nation, border closing, travel restrictions, providing good heath care and modulation of socio-economic factorsFootnote1.
Currently, given the absence of an effective vaccine or drug against COVID-19 and also considering the overwhelmed and strained healthcare facilities, there is an increased interest for self-medication, as witnessed by a surge of related web searches [Citation21]. This phenomenon characterizes particularly low-resources settings, such as Bangladesh, India, and African countries [Citation18].
In Africa, there is a wide range of management and therapeutic options for diseases ranging from modern medicine to traditional medicine and prayers. In this wide range, Self-medication and the use of complementary/alternative medicine (CAM) occupies an important part for social, economic, and psychological reasons. Governments in these countries are generally faced with a number of challenges, including limited resources and poor infrastructure and patient's health literacy [Citation5]. Most Africans are using self-medication and prayers to manage and treat COVID-19 Footnote2,Footnote3. This is fuelled by the rapid spread of rumours in favour of these modalities on social media. These rumours are positively welcomed by the population at large, raising questions on the impact of self-medication and the and use of CAM on the spread of the disease in Africa.
Mathematical models have been developed to assess the transmission dynamics of the COVID-19 pandemic. Chen et al. [Citation4] formulated and studied a simplified reservoir-people transmission network model to assess the transmissibility of the SARS-CoV-2. Lin et al. [Citation16] proposed conceptual models that consider individual behavioural reactions and governmental actions on the COVID-19 epidemics. Yang et al. [Citation26] developed a mathematical model that incorporated multiple transmission pathways to explore the role of the environment reservoir on the transmission of COVID-19 disease. Ivorra et al. [Citation11] developed a new Q-SEIHRD model to study the impact and importance of the ratio of detected cases to the real total infected cases on the spread of the virus. Several approaches and methods including but not limited to the framework adopted by [Citation13] have been used to study the dynamics of the COVID-19. To the best of our knowledge, no other model for COVID-19 takes into account the impact of self-medication on the evolution of the disease.
In this paper, we propose a new epidemic SEIHQR age-structured compartmental model of the COVID-19 in order to evaluate the impact of self-medication on the spread of the disease. Our model also consider an age-structure partitioning of infected individuals who do not self-medicate, and includes hospitalized and quarantined/isolated individuals. Overall, our modeling framework provides an alternative way to describe the epidemic of COVID-19 and provides conditions when self-medication could be considered beneficial in the course of an epidemic or not. In the sequel, we formulate and describe the mathematical model in Section 2.1. The values for the parameters of the model are estimated in Section 2.2, followed by the Results in Section 3, then a Conclusion in Section 4.
2. Model formulation and parameter estimation
In this section, we formulate the mathematical model and estimate some of the values for model parameters.
2.1. Mathematical model
Our deterministic model follows from the block diagram in Figure . The list of variables and their descriptions are given in Table . In this paper, a ‘young’ person is any human aged below 50, and who has a ‘strong’ immune system. A senior human is thus anyone aged above 50, or whose immune system is weakened by either aging or current medical conditions.
Figure 1. Framework for the model.
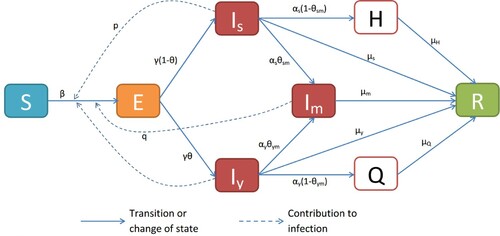
Table 1. Variables of the model. All concentrations are in units of population numbers.
We assume that the total human population considered in the model remains unchanged throughout the outbreak. Thus,
(1)
(1)
Our model takes the form of an SEIR model with additional compartments for isolated (Q) and hospitalized (H) persons. We assume that infection occurs when there is a direct contact between a susceptible (S) and any other person of the infected/infectious classes ( or
), at a maximal rate of β. It is believed that the contact rate between susceptible and young infected person is larger than the contact rate of S with senior infected ones, since youths are mobile and socialize more than seniors. For simplicity, we assume that the hospitalized and isolated individuals do not transmit the disease.
Accordingly, the contact rate of S with is the baseline β while the contact rates of S with
and
are lower (
and
, respectively). In our model, only ‘detected’ cases of the disease are considered. Detection is determined either by medical officials (
, i = s, y) or by alternative means (
, i = s, y). Self-medicated infected people are off-the-radar and cannot be taken care of by an official medical personnel. We assume that people who recover and those who die from the disease are removed from the population at risk. We lump both categories into one and call it ‘removed’ (R). Given the short time considered in the study, we assume that those who recovered are immune. Hence, our system of equations takes the following form:
(2)
(2) where
, and all the other parameters are positive.
2.2. Parameter estimations
In this section, we use biological evidence to estimate most parameters of our model. The remaining parameters which cannot be estimated due to lack of biological evidence are estimated using the method of Bayesian inference with reported rolling 7-day average data for COVID-19 in Cameroon from March 17 to June 08, 2020.
Estimate for γ: The incubation period for COVID-19 is 1–14 days, with mean of approximately 5.2 days[Citation15,Citation24]. We take
Estimate for the 's: Using available preliminary data, the median time from onset to clinical recovery for mild cases is approximately 2 weeks and is 3–6 weeks for patients with severe or critical diseases. Among patients who have died, the time from symptom onset to outcome ranges from 2 to 8 weeks [Citation24]. We take the time from symptom onset to ‘removal’ (recovery or death) to be 2 weeks for mild cases, and 2–7 (average of 4 weeks) weeks for severe cases. Since the disease is mild for
and Q, and potentially severe for
and H, we take
Since
is composed of
and
, we take
The removal rate from the medicated compartment value is in line with the authors in [Citation1], that found a median value from the time from symptom onset to ‘removal’ to be 21 days [12.82–29.32] among the youth and 25 days [17.22–32.78] among the seniors. The assumption is equally in line with the authors in [Citation2,Citation14,Citation23,Citation25,Citation27] that found no age effect on the time from symptom onset to ‘removal’ and, as such, no statistically different differences between young and senior individuals.
Estimate for and
: In this work, we assume that individuals
and
are confirmed of their sickness to COVID-19 1–3 days after symptoms' onset (either through testing or symptoms checklist). We also assume that seniors are more aware and prompt to detect any health issues than younger individuals. So, we take
The remaining parameters are estimated using emcee, a pure-Python implementation of Goodman & Weare's Affine Invariant Markov chain Monte Carlo (MCMC) Ensemble samplerFootnote4. The MCMC program is sampled from the natural logarithm of the following unnormalized posterior distribution, :
where
is a vector of the unknown model parameters, D the rolling 7-day average of the number of reported cases and
is the prior distribution. The likelihood function is assumed to be a Poisson distribution. To this end, suppose we have n reported cases i.e.
and corresponding time
then the probability of observing
is given by:
where
is taken to be the solution of the model. The prior distributions for the parameters are assumed to be uniform distributions.
We obtained data on the rolling 7-day average of the number of confirmed COVID-19 cases in Cameroon from March 17, 2020 to June 08, 2020 from Global Change Data Lab Footnote5. The estimated baseline values for , are reported in Table alongside the baseline values for the other model parameters estimated from the literature. Figure shows the simulated 7-day rolling average of number of cases from Cameroon (obtained using the parameter values in Table ) plotted alongside the actual rolling 7-day average. We obtained a normalized mean square error value of 0.76. This statistic indicates that our model with the estimated baseline parameter values (Table ) fit the the data accurately. The normalized mean square error is calculated as follows:
Where
indicates the 2-norm of a vector.
, where
indicates a bad fit and 1 a perfect fit.
Figure 2. The rolling 7-day average of COVID-19 confirmed cases in Cameroon The parameters' values are listed in Table , with .
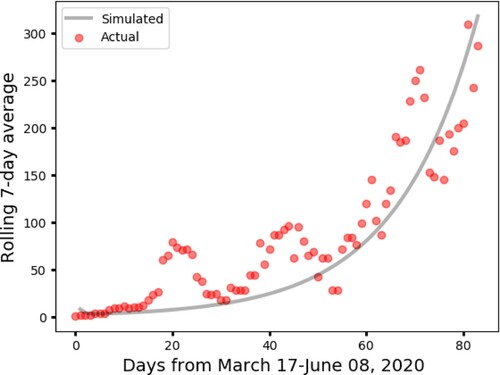
Table 2. Baseline values for the model parameters. The credible intervals for the fitted parameter values: β, p, q, θ, ,
are respectively
,
.
Because of the lack of testing equipment in small cities in Cameroon, we assume that the reported cases in Cameroon are from major cities: Douala, Yaoundé, Bafousam, Buea, Bamenda, Garoua, Kousséri, Maroua, Mokolo, Ngaoundéré, Bertoua, Edéa and Loum. These cities have a total population of approximately 10 millions. Hence, we set .
3. Results
Given System (Equation2(2)
(2) ), we used the next generation matrix to derive the following expression for the basic reproduction number
:
(3)
(3) Substituting the parameters' values in the
equation, we obtain an
for the COVID-19 outbreak in Cameroon to be 2.4038.
Besides controlling the disease spread by contacts through social distancing, wearing of masks, and washing of hands, Equation (Equation3(3)
(3) ) shows that COVID-19 can be controlled at three different levels:
Increasing detection measures (
and
Increasing the removal rate of the infected persons that are not self-medicating (
These two control strategies correspond to the terms
The third level deals with
3.1. Sensitivity analysis
We performed parameter sensitivity analysis of our model relative to the basic reproduction number (Equation3
(3)
(3) ). The analysis was done using the Latin Hypercube Sampling-PRCC method developed by Kirschner et al. [Citation12,Citation20]. The ranges for the parameters were
of their baseline values in Table .
We see in Figure the parameters that are mostly correlated with are β,
, q and
. The remaining parameters are intermediate, except γ,
and
which have little to no effect on
.
Figure 3. Parameter sensitivity analysis relative to . The ranges for the parameters are between
of their baselines in Table . The most negatively correlated parameter relative to
is
, and the most positively correlated parameters are
and q.
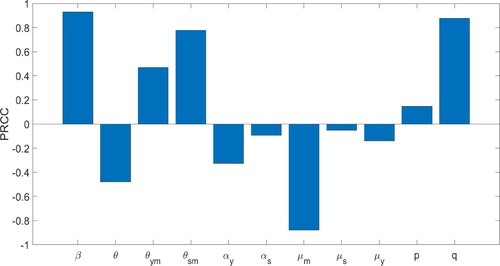
It is natural that the contact rate β is the most positively correlated parameter relative to . In fact, policies, such as barrier measures, aimed at decreasing β are usually included in the first response against any epidemic. We also see that the proportion of contact between susceptible and self-medicated people is highly positively correlated with
. This observation is interesting since the
's are off-the-radar and continue to interact with the population. Decreasing q will significantly decrease the disease spread, and hence result in a decrease in disease fatality. The parameter
is more positively correlated with
than
implying that prioritizing younger people for detection and treatment is more effective in decreasing
than prioritizing seniors.
The parameter is the most negatively correlated with
. In fact, the basic reproduction number
decreases significantly as the self-medicated individuals are removed. In addition, this sensitivity analysis of
implies that the reproduction number decreases as the removal rate of self-medicated people increases. But as discussed above, the removal rate can indicate either recovery or death of patients. The large observed sensitivity of the basic reproduction number on this removal rate justifies our inclusion of self-medication in this study.
3.2. Differential analysis
Policy or control strategies aimed at containing the early spread of the disease requires understanding how the value of changes with respect to the controllable parameters which are;
. From the perspective of a policy maker, to control the early spread of the disease, it is necessary to implement policies that will ensure a basic reproduction number which is strictly less than one. To get an understanding of how the basic reproduction number changes with respect to changes in the controllable parameters, we proceed onto computing partial derivatives of
with respect to these parameters and obtain:
We observe the following:
The rates of change,
We find that
3.3. Numerical results
We further illustrate the effect of self-meditation on the peak levels and times at which the disease outbreak is more severe. Figures and represent the various times and peak levels for all combinations of self-medication patterns, and the combined effect of and
on the disease severity and
, respectively. The parameter values are given in Table where, in Figure , we take the following notations:
Figure 4. Effect of self-medication (SM) on the disease outbreak level and time of peak occurrence. The horizontal axes scale the time in days and the vertical axes scale the percentage of humans. The highest and earliest peak in the number of infectious cases occurs when both youths and seniors self-medicate (a–d). The highest peak in H occurs when only the youths self-medicate (e). In (f), we see that the highest peak, Q when only seniors self-medicate, occurs later than the peak of Q when both youths and seniors self-medicate, and earlier than when only youths self-medicate. In all cases, the no self-medicating (“No SM”) scenario leads to smallest and latest outbreak peaks.
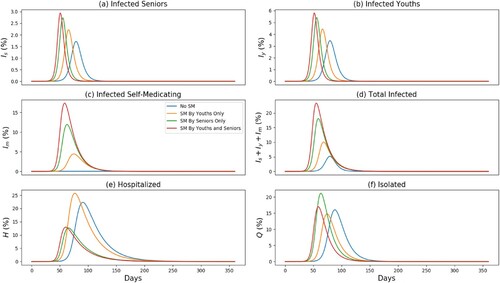
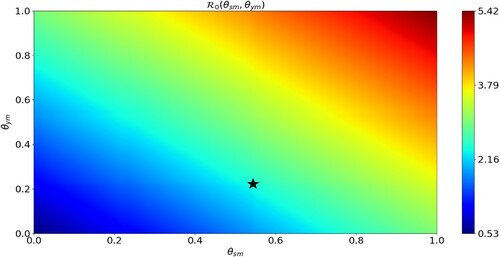
Figure 5. Effect of self-medication on the disease outbreak severity. The horizontal axis scales the fraction of infected seniors who self-medicate () and the vertical axis scales the fraction of infected youths who self-medicate (
). The colour bar measures the value of
as a function of
and
.
is minimal when both
and
are small enough, and
is maximal when both
and
are large. The black star is
and represents the case of the parameters in Table .
Table
We see in Figure (a–d) that the highest and earliest peak in the number of infectious cases occurs when both the youths and seniors self-medicate (closely followed by the case when only the youths self-medicate). In fact, the free circulation of self-medicating youths (and seniors) in the community will lead to a larger spread of the disease since the youths have a higher transmission rate than the seniors.
Interestingly, the highest peak in the number of hospitalized cases occurs when only the youths self-medicate Figure (e), and the highest peak in the number of isolated cases occurs when only seniors self-medicate Figure (f); in this later scenario, the highest peak occurs after those of the cases when only the youths or both the youths and the seniors self-medicate. Recall our assumption that only seniors are hospitalized and only the young persons are isolated after testing positive to the disease. Thus, if the youths self-medicate, they are off-the-radar for preventive measures and will eventually transmit the disease to more people, including the seniors. The later will then be hospitalized at higher rate as depicted in Figure (e). Consequently, the self-medication of the youths lead to smaller numbers of isolated humans Figure (f). Our model also illustrate that, for the parameter values in Table , the disease fatality is significantly reduced when self-medication is prohibited. In fact, the time it from the onset of the disease to the peak is considerably increased, and the peak value is significantly small relative to the cases where self-medication is applied.
The fact that is more sensitive to the disease outbreak level than
is because a senior that is infectious but not self-medicating either self-isolate or is hospitalized. Compare to the proportion of infectious senior, it is the self-medicating population that are the ‘super spreaders’. This is because they feel that they are protected by the self-medication (as is the case with those who took hydroxy chloroquine [Citation17,Citation19] or other drugs, such antibiotics [Citation8,Citation21]). Thus, if more self-medicated people are removed from a community compared to the number of infected seniors removed, it may have a greater impact on the outbreak level.
Figure shows the values of of as both
and
vary. We see that
is minimal (respectively, maximal) when both
and
are small enough (respectively, large enough). Moreover, it is more beneficial to prohibit self-medication among the population of youths than among the seniors since
increases faster with respect to
when
is kept fixed than vice versa.
4. Conclusion
Understanding the factors that contribute to the spread of the SARS-CoV-2 (COVID-19) is of paramount importance in the global race to create mitigating measures and control policies. Our findings support existing research results that increased contact/transmission rate, increased fraction of people who become sick from SARS-CoV-2 infection and non-removal of infected people can increase the severity and duration of the epidemic. These results explain why globally accepted strategies in controlling the spread of the virus involve social distancing, isolation (quarantine) and medical treatment of infected patients[Citation3,Citation6].
Our work exemplifies self-medication as an important but frequently overlooked factor that has been shown to contribute the spread and severity of the SARS-CoV-2 infection despite the prescribed official preventive and control measures. We hypothesized that there remains a population of infected individuals who opt for self-medication and whose actions and behaviours can affect the persistence or eradication of SARS-CoV-2 within a mixed population. Among other results, we found that both self-medicating young and senior individuals can increase the value of for SARS-CoV-2 while removal of self-medicating individuals reduces the severity of the epidemic. Removal of the infected self-medicating patients can come in several forms including treatment if the alternative drug used in self-medication is efficacious, in which case the self-medicating patient recovers; the other form of removal is death.
Self-medication can serve as a behavioural method of survival, especially, in environments with limited facilities such as Africa. It could also be associated with fear, adventuring and curiosity and active involvement in past medicare procedures by patients among others [Citation10,Citation22]. Concerns related to self-medication such as wrong protocol and drug dosage, side effects, lethal or dangerous drug interactions and risk of exposing family and the larger population to the infection are some avoidable risks that countries' governments should target when facing an epidemic such as COVID-19 [Citation9,Citation10,Citation22].
In the light of the numerical and differential analyses in this paper, we recommend policies along the following guidelines:
Design and implement measures to infer the fraction of infected who opt for self-medication. This can be done by surveying the communication channels of the people; for instance, social media.
Monitor the inferred fraction of infected who self-medicate, then design and implement measures that aim at decreasing this fraction. Disease-awareness campaigns on social and state media can be used at this stage.
If the inferred fraction of self-medicated patients can be durably maintained below their thresholds, then continue to improve detection measures such as contact tracing.
If the inferred fraction of self-medicated patients cannot be maintained below their threshold, then divert resources from improving the detection measures to investigating the reasons why the fraction of self-medicating patients is remaining high. An example of such reason could be that the alternative drugs used by the self-medicating patients are relatively efficacious in treating the disease. Protocols for confirming this observation should be implemented and, if validated, the alternative drugs can then be added to the official list of recommendations.
In summary, our findings indicate that an urgent and radical increase in the identification and isolation of self-medicated individuals can be an important tool in the control of the COVID-19 pandemic. Therefore, there is a need to adopt strategies such as the use of the media for spreading correct medical information, compiling a database of those who request specific drugs associated with COVID-19, creating a unified health data repository, increasing rapid testing and contact tracing techniques in order to reduce the persistence and severity of the COVID-19 infection.
For future studies, the present work should be viewed as a first step toward predicting the effect of self-medication, with alternative non-official drugs, on the outcome of an epidemic. We simplified our model formulation by assuming that there is no infection at hospitals or within the isolation/quarantine centres; these assumptions could be dropped in an extension of this work for more realistic results.
Author's contributions
The main idea of this paper was proposed by J.D.K. and N.S.; J.D.K., R.F.T. and N.S. designed and analyzed the model; and all authors were responsible for the interpretation of results and preparation of the manuscript.
Ethics and consent
All authors have been personally and actively involved in substantial work leading to the paper, and will take public responsibility for its content.
Paper context
After the new coronavirus made its way around the world, several models were formulated and analysed to inform policy makers. To the best of our knowledge, none of these models takes into account the impact of self-medication on the evolution of the disease caused by the virus. Here, we propose an age-structured model for the disease that takes into account the self-medicating population. Our findings suggest that control and preventive measures should target self-medication.
Acknowledgements
J.D.K. acknowledges support from Canada's International Development Research Centre (IDRC) (Grant No. 109559-001). This work was conducted while NS was a Postdoctoral fellow at the University of British Columbia (Okanagan). As a Postdoctoral Researcher, RFT enjoyed the support of McGill University. The authors acknowledge the feedbacks from Dr. Nicola Bragazzi.
Disclosure statement
No potential conflict of interest was reported by the author(s).
Additional information
Funding
Notes
References
- M.P. Barman, T. Rahman, K. Bora, and C. Borgohain, COVID-19 pandemic and its recovery time of patients in India: A pilot study, Diabet. Metab. Syndrome Clin. Res. & Rev. 14(5) (2020), pp. 1205–1211.
- Q. Bi, Y. Wu, S. Mei, C. Ye, X. Zou, Z. Zhang, X. Liu, L. Wei, S.A. Truelove, T. Zhang, and W. Gao, Epidemiology and Transmission of COVID-19 in Shenzhen China: Analysis of 391 cases and 1, 286 of their close contacts, MedRxiv. 2020;
- Centers for Disease Control and Prevention, Coronavirus Disease 2019 (COVID-19): Interim US guidance for risk assessment and public health management of healthcare personnel with potential exposure in a healthcare setting to patients with coronavirus disease (COVID-19), Attachment A Attachment B Attachment C Attachment D Visitors WARNING We are currently having cases of COVID-19 on this facility This virus can cause severe disease in older adults. 2020;65
- T.M. Chen, J. Rui, Q.P. Wang, Z.Y. Zhao, J.A. Cui, and L. Yin, A mathematical model for simulating the phase-based transmissibility of a novel coronavirus, Infect. Dis. Poverty 9(1) (2020), pp. 1–8.
- P.A. Dalinjong, A.Y. Wang, and C.S.E. Homer, Are health facilities well equipped to provide basic quality childbirth services under the free maternal health policy? findings from rural northern Ghana, BMC Health Serv. Res. 18 (2018), pp. 959.
- M. Day, Covid-19: identifying and isolating asymptomatic people helped eliminate virus in Italian village, Bmj 368 (2020), pp. m1165.
- E. Dong, H. Du, and L. Gardner, An interactive web-based dashboard to track COVID-19 in real time, Lancet Infect. Dis. 20 (2020), pp. 533–534.
- A.M.A. Faqihi and S.F. Sayed, Self-medication practice with analgesics (NSAIDs and acetaminophen), and antibiotics among nursing undergraduates in University College Farasan Campus, Jazan University, KSA, Annales pharmaceutiques francaises. Elsevier, 2020.
- L. Grigoryan, F.M. Haaijer-Ruskamp, J.G. Burgerhof, R. Mechtler, R. Deschepper, A. Tambic-Andrasevic, R. Andrajati, D.L. Monnet, R. Cunney, A. Di Matteo, and H. Edelstein, Self-medication with antimicrobial drugs in Europe, Emerging Infect. Dis. 12(3) (2006), pp. 452.
- C.M. Hughes, J.C. McElnay, and G.F. Fleming, Benefits and risks of self medication, Drug Safety 24(14) (2001), pp. 1027–1037.
- B. Ivorra, M. Ferrández, M. Vela-Pérez, and A. Ramos, Mathematical modeling of the spread of the coronavirus disease 2019 (COVID-19) considering its particular characteristics. The case of China, Tech. Rep., MOMAT, 03 2020. avaiable at https://doi-org.usm.idm.oclc.org.
- D.E. Kirschner, Uncertainty and sensitivity functions and implementation, University of Michigan, 2007–2008, available at http://malthus.micro.med.umich.edu/lab/usadata
- A.J. Kucharski, T.W. Russell, C. Diamond, Y. Liu, J. Edmunds, S. Funk, and R. Eggo, Early dynamics of transmission and control of COVID-19: a mathematical modelling study, Lancet Infect. Dis. 20(5) (2020), pp. 553–558.
- J.R. Lechien, C.M. Chiesa-Estomba, S. Place, Y. Van Laethem, P. Cabaraux, Q. Mat, K. Huet, S. Hans, and M.R. Barillari, Clinical and epidemiological characteristics of 1420 European patients with mild-to-moderate coronavirus.
- Q. Li, X. Guan, P. Wu, X. Wang, L. Zhou, Y. Tong, R. Ren, K.S. Leung, E.H. Lau, J.Y. Wong, and X. Xing, Early transmission dynamics in wuhan, China, of novel coronavirus-Infected pneumonia, N. Eng. J. Med. 382 (2020), pp. 1199–1207.
- Q. Lin, S. Zhao, D. Gao, Y. Lou, S. Yang, S.S. Musa, M.H. Wang, Y. Cai, W. Wang, L. Yang, and D. He, A conceptual model for the coronavirus disease 2019 (COVID-19) outbreak in Wuhan, China with individual reaction and governmental action, Int. J. Infect. Dis. 93 (2020), pp. 211–216.
- M. Makowska, R. Boguszewki, M. Nowakowski, and M. Podkowińska, Self-Medication-Related behaviors and Poland's COVID-19 lockdown, Int. J. Environ. Res. Public Health 17(22) (2020), pp. 8344.
- B. Malik and S. Bhattacharyya, Antibiotic drug-resistance as a complex system driven by socio-economic growth and antibiotic misuse, Sci. Rep. 9(1) (2019), pp. 1–12.
- M. Malik, M.J. Tahir, R. Jabbar, A. Ahmed, and R. Hussain, Self-medication during Covid-19 pandemic: challenges and opportunities, Drugs & Therapy Perspect. 36(12) (2020), pp. 565–567.
- S. Marino, I.B. Hogue, C.J. Ray, and D.E. Kirschner, A methodology for performing global uncertainty and sensitivity analysis in systems biology, J. Theor. Biol. 254 (2008), pp. 178–196.
- D. Onchonga, A google trends study on the interest in self-medication during the 2019 novel coronavirus (COVID-19) disease pandemic, Saudi Pharm. J. SPJ 28(7) (2020), pp. 903.
- M.E. Ruiz, Risks of self-medication practices, Current Drug Safety 5(4) (2010), pp. 315–323.
- I. Voinsky, G. Baristaite, and D. Gurwitz, Effects of age and sex on recovery from COVID-19: analysis of 5, 769 Israeli patients, J. Infect. 81 (2020), pp. e102–e103.
- WHO-China, Report of the WHO-China Joint Mission on Coronavirus Disease 2019 (COVID-19), WHO. 382 February 16–24, 2020; pp. 1199–1207.
- J. Wu, W. Li, X. Shi, Z. Chen, B. Jiang, J. Liu, D. Wang, C. Liu, Y. Meng, L. Cui, and J. Yu, Early antiviral treatment contributes to alleviate the severity and improve the prognosis of patients with novel coronavirus disease (COVID-19), J. Internal Med. 288 (2020), pp. 128–138.
- C. Yang and J. Wang, A mathematical model for the novel coronavirus epidemic in Wuhan, China, Math. Biosci. Eng. 17(3) (2020), pp. 2708.
- F. Yu, L. Yan, N. Wang, S. Yang, L. Wang, Y. Tang, G. Gao, S. Wang, C. Ma, R. Xie, and F. Wang, Quantitative detection and viral load analysis of SARS-CoV-2 in infected patients, Clin. Infect. Dis. 71 (2020), pp. 793–798.