
 ?Mathematical formulae have been encoded as MathML and are displayed in this HTML version using MathJax in order to improve their display. Uncheck the box to turn MathJax off. This feature requires Javascript. Click on a formula to zoom.
Abstract
Kaposi Sarcoma (KS) is the most common AIDS-defining cancer, even as HIV-positive people live longer. Like other herpesviruses, human herpesvirus-8 (HHV-8) establishes a lifelong infection of the host that in association with HIV infection may develop at any time during the illness. With the increasing global incidence of KS, there is an urgent need of designing optimal therapeutic strategies for HHV-8-related infections. Here we formulate two models with innate and adaptive immune mechanisms, relevant for non-AIDS KS (NAKS) and AIDS-KS, where the initial condition of the second model is given by the equilibrium state of the first one. For the model with innate mechanism (MIM), we define an infectivity resistance threshold that will determine whether the primary HHV-8 infection of B-cells will progress to secondary infection of progenitor cells, a concept relevant for viral carriers in the asymptomatic phase. The optimal control strategy has been employed to obtain treatment efficacy in case of a combined antiretroviral therapy (cART). For the MIM we have shown that KS therapy alone is capable of reducing the HHV-8 load. In the model with adaptive mechanism (MAM), we show that if cART is administered at optimal levels, that is, 0.48 for protease inhibitors, 0.79 for reverse transcriptase inhibitors and 0.25 for KS therapy, both HIV-1 and HHV-8 can be reduced. The predictions of these mathematical models have the potential to offer more effective therapeutic interventions in the treatment of NAKS and AIDS-KS.
1. Introduction
Despite significant progress made in ending the HIV/AIDS epidemic, an estimated 38 million people were living with HIV at the end of 2018, resulting in about 2 deaths. The African region remains to be the most affected, accounting for two-third of the people living with HIV worldwide (https://www.who.int/gho/hiv/en/). Although HIV-positive people who start antiretroviral therapy (HAART) have the same life expectancy as their HIV negative peers, they develop co-morbidities on average 16 years earlier than HIV negative people (http://www.natap.org/2020/CROI/croi_134). KS is one of the most common malignancies causing co-morbidity in patients with human immunodeficiency virus-1 (HIV-1) infection, especially at the later HIV stage (AIDS). Most of AIDS-related cancers are caused by oncogenic viruses such as Epstein Barr virus (EBV), human herpesvirus 8 (HHV-8) and Human papillomavirus (HPV) [Citation7].
There are four different forms of KS: Classic or sporadic KS, African or Endemic KS, AIDS-associated or epidemic KS and Transplant or Immunosuppression-associated or Iatrogenic KS [Citation13]. The development of each of these forms is dependent on prior infection with HHV-8. However, HHV-8 infection alone is insufficient for the development of KS and some form of immunodeficiency is necessary for disease progression [Citation31].
Most individuals infected with African KS and Classic KS but with strong immune responses have remained latently infected with HHV-8 throughout their lifetime [Citation13,Citation14] The co-factors involved in the development of Classic and Endemic KS are not fully understood although environmental and genetic factors such as age, sex, malnutrition and so on have been implicated [Citation13]. Progression from HHV-8 infection to KS is a complex process. For instance, not every AIDS patient develops KS even in the face of profound immunosuppression, only a minority of HHV-8-infected transplant recipients develop iatrogenic KS, and that people with Classic or Endemic KS are not typically immunosuppressed [Citation17,Citation20].
Whether HHV-8 infection develops into an asymptomatic or symptomatic KS, depends on the interplay between HHV-8 and the host immune system. When HHV-8 infection occurs, the immune system promotes an environment where cellular proliferation, cell migration, angiogenesis and cytokine/chemokine production are enhanced [Citation13]. The immune response occurs in two stages: first by triggering the innate response and second, if the infection persists, the adaptive response [Citation30]. A review by Foreman et al. [Citation13] has suggested how infection of progenitor cells by HHV-8 can initiate the development of all forms of KS. For individuals dually infected with both HIV-1 and HHV-8, the HHV-8 infection is enhanced by the HIV-1 growth factors which stimulate both uninfected and infected B-cells to proliferate in response to T-cell signals [Citation13]. The T-cell signals stimulate the latently infected B cells. These cells that were dormant are now capable to proliferate and increase the population of HHV-8 producing cells.
With regard to mitigating the spread of the disease, especially in the case for childhood diseases and malaria, preventive measures are given priority over treatment. Current protocol advises individuals going to malaria endemic areas to take malaria prophylaxis drugs 1 week before departure to prepare their immune system to fight and clear the infection before it develops into active disease. In this study, our objective is to demonstrate how administration of HAART to individuals co-infected with HIV-1 and HHV-8 can prevent the occurrence of KS by ensuring low HIV-1 viremia which prevents reactivation of latently infected B cells [Citation13].
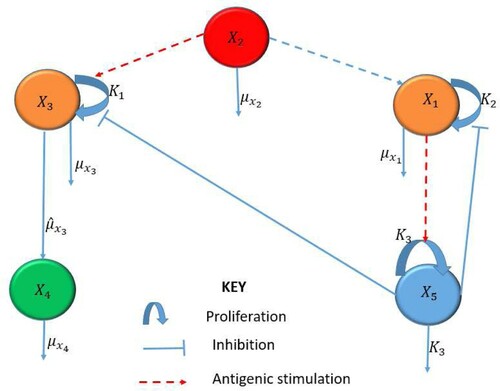
When a pathogen invades the body, the body triggers an innate, non-specific immune response to clear the infection. This response consists of cellular (immune cells) and chemical (e.g. cytokines) defenses to reduce the growth of the population of infected cells and to eliminate the pathogens. The innate immune response may be viewed as a way to suppress and control HHV-8 infection before the adaptive immune response characterized by the clonal expansion of lymphocytes is activated. Using mathematical modelling, we show that a dynamic motif in Figure comprising of interactions between infected B cells, infected progenitor cells, KS cells, HHV-8 virions and the innate immune response, is able to prevent a potentially NAKS from developing into a clinical disease. This has twofold implications. First, key innate immune signalling molecules induced by viral infection lead to the production of a broad range of antiviral proteins and cytokines. Uncontrolled release of these cytokines can lead to cytokine storm, causing tissue damage or indirectly causing pathology even before the initiation of HAART [Citation23]. Second, antibody test can detect HIV infection as early as 1–2 weeks after exposure and testing after 2 or 3 weeks is not very useful (http://i-base.info/guides/testing/what-is-the-window-period). Hence, it is essential to understand at what level to deem the innate immune response or cytokine therapy to be safe.
Figure 1. Schematic diagram of the MIM describing interactions for NAKS.
If the infection progresses despite the innate response, the immune system mounts a more robust, longer lasting adaptive or acquired immune response. Hence, we construct a second model that mimics the body's adaptive immune response by including the interactions as in Figure between HIV-1 virions, HIV-1- and HHV-8-specific effector cells, infected CD4 T cells, uninfected B- and CD4 T cells. The initial condition of MAMl will be determined by the equilibrium states of the MIM, assuming an advanced stage of HIV-1 and HHV-8 co-infection. Importantly, we find an infectivity threshold that will be critical for the primary HHV-8 infection to develop into an advanced KS. To determine the drug efficacy level of HAART alone or combined HAART and chemotherapy, we will take an optimal control approach. This is motivated by the fact that HAART should be the first step therapy in optimal control of HIV infection for AIDS-KS. However, patients with high-risk KS rarely respond to HAART alone and hence, chemotherapy is recommended which requires balancing the immunosuppressive effects of chemotherapy with its potential benefit.
To develop these models, we shall apply the Foreman et al. [Citation13] approach. According to this hypothesis, AIDS-KS arises from the erroneous infection of progenitor cells by HHV-8 which is enhanced by action of HIV-1 infected host cells. These HIV-1 infected cells produce cytokines and growth factors that stimulate the progenitors of the KS cells which makes them susceptible to HHV-8 infection. In summary, we will show that early HHV-8-specific intervention is important as it can control the HHV-8 infection from developing into a progressive KS. We also determine efficacy levels for cART therapy at which HIV-1 and HHV-8 co-infection can be kept under control, thus providing valuable testable predictions for clinical researchers.
2. Model with innate mechanism (MIM)
2.1. Model formulation and description
We formulate a model based on Foreman et al. [Citation13] representing two subsystems as follows: the first subsystem representing the primary infection of B cells leading to the production of HHV-8 and the second subsystem representing the erroneous infection of progenitor cells leading to the development of KS.
The MIM includes infected B-cells, , HHV-8 virions,
infected progenitor cells,
, KS cells,
, and the innate immune response,
. The interaction among the different classes are illustrated in Figure and described by the following system of ordinary differential equations:
(1)
(1) Equation (Equation1
(1)
(1) ) describes the dynamics of the infected B cells,
. This class is assumed to grow logistically but regulated by the efficacy threshold of the innate immune response. The dependence on
itself rather than the HHV-8 load is plausible, since no correlation has been observed between the B-cell subsets and the HHV-8 viremia [Citation6]. The last term accounts for natural death of infected B cells at a constant rate
.
(2)
(2) Equation (Equation2
(2)
(2) ) represents the dynamics of HHV-8,
. The first term represents the production of these virions from the bursting of infected B cells, where
is the carrying capacity or maximum number of virions that can be contained within an infected B cell. The last term represents natural clearance of HHV-8 at a constant rate
.
(3)
(3) Equation (Equation3
(3)
(3) ) describes the dynamics of the infected progenitor cells,
. The first term represents a source term which grows logistically with respect to the viral level,
, and moderated by the innate immune response,
. The effect of the innate immune response,
, is moderated by the saturation parameter,
, which is significant in this study as it mimics how administration of vaccines or drugs can alter the progression of the infection [Citation19]. The logistic growth term is expressed in terms of HHV-8 viremia to emphasize that progenitor cells and in general stem cells proliferate in response to infectious stimuli [Citation3,Citation5,Citation8,Citation15,Citation19,Citation24,Citation27]. This formulation can assist to make decisions on viral load dependent intervention measures depending on the viremia reservoir levels. The second term represents the blanket death of these cells at a constant rate,
.
(4)
(4) Equation (Equation4
(4)
(4) ) represents the concentration of KS,
. The first term designates the growth of KS, as the infected progenitor cells transform into cancerous cells, at a constant rate,
. It is assumed that
as not all infected progenitor cells progress to KS [Citation13]. The second term is natural death of KS at a constant rate
.
(5)
(5) Equation (Equation5
(5)
(5) ) represents the innate immune response,
. The first term represents the stimulation of the innate immunity due to the presence of infected B cells,
. It is assumed that
is stimulated by the infected B cells,
, in a saturable manner with the scaling constant,
and decays at a constant rate
[Citation4]. The model (Equation1
(1)
(1) )–(Equation5
(5)
(5) ) is developed to demonstrate how infection errors committed by HHV-8 by erroneously infecting progenitor cells lead to a more serious problem of KS. This model can then be used to demonstrate that externally administered drugs or immune boosters can alter the infection and stop the development of KS.
2.2. Analysis of the model
2.2.1. Positivity and boundedness of solutions
We denote by the set of points
in
with positive coordinates and consider the system (Equation1
(1)
(1) )–(Equation5
(5)
(5) ) with initial values
In this section, we prove the following theorem.
Theorem 2.1
If then
for all
.
Before we prove Theorem 2.1, we rearrange the system into a subsystem of infected progenitor and infected B cells, written in matrix form as
(6)
(6) where
(7)
(7) Let
denote the jth entry of
where
represents the jth source term in (Equation6
(6)
(6) ) and
measures the efficacy of the innate immune response. Define a subsystem consisting of HHV-8 and KS,
which can be expressed in matrix form as
(8)
(8) where
The proof is done in three steps: First, we prove that the source terms in (Equation6(6)
(6) ) are nonnegative, i.e.
Second, we want to show that
and finally, we conclude that
for
Proof.
From Equation (Equation5(5)
(5) ), we can deduce that
. Notice that
, for
.
The function in (Equation7
(7)
(7) ) has zeros at
and
has a peak at
and is positive in the interval
. Since
we have
.
The matrix in (Equation6
(6)
(6) ) is a Mertzler matrix and
, the solution of (Equation6
(6)
(6) ) is nonnegative for all
The matrix
since
for
The matrix
is a Mertzler matrix and hence, the solution of (Equation8
(8)
(8) ) is nonnegative for
We conclude that if
, then the solution
, of the system (Equation1
(1)
(1) )–(Equation5
(5)
(5) ) remains in
.
2.3. Steady states and the basic reproduction number
The virus free equilibrium of the MIM given by Equations (Equation1(1)
(1) )–(Equation5
(5)
(5) ) is
. In what follows, we will calculate the basic reproduction number of the system (Equation1
(1)
(1) )–(Equation5
(5)
(5) ) using the next generation operator method [Citation9]. The basic reproduction number is determined by the number of newly infected B cells. Using this approach, we first assume that the model system (Equation1
(1)
(1) )–(Equation5
(5)
(5) ) can be written in the form
(9)
(9) where
and
, and
Assuming that the equation
implicitly determines a function
We let
and further assume that
can be written in the form
with
(that is
) and
is a diagonal M-matrix.
In system (Equation9(9)
(9) ),
denotes the innate immune response,
represents the HHV-8 virions and the components of
represent the HHV-8-associated cells, i.e.
. Let
denote the virus free equilibrium, that is,
where
We compute
and get
The reproduction number is given by the next generation spectral radius
to be
2.4. Local stability of the virus free equilibrium, 
Lemma 2.1
The virus free equilibrium point is locally asymptotically stable if
.
Proof.
We consider the Jacobian matrix of the system (Equation1(1)
(1) )–(Equation5
(5)
(5) ), evaluated at the virus free steady state denoted by
.
We note that
is a lower triangular matrix. Hence, the corresponding eigenvalues are the entries in the main diagonal. In other words,
For local stability of
Hence, all the eigenvalues are negative and the result follows.
2.5. Existence of the KS present equilibrium,
Setting the system (Equation1(1)
(1) )–(Equation5
(5)
(5) ) to zero and solving the resulting system simultaneously yields:
Suppose
. Then,
(10)
(10) Using (Equation5
(5)
(5) ) to solve for
and replacing in (Equation10
(10)
(10) ) yields
where
,
and
. To establish the existence of a positive root for
, say
we argue as follows:
Note that and by continuity of g, we have
This implies that there is a positive number,
such that
. In particular, we one can show that
. Hence, we obtain the following coordinates for the KS present equilibrium,
, where
(11)
(11)
(12)
(12)
(13)
(13)
(14)
(14)
(15)
(15)
Theorem 2.2
The endemic equilibrium, exists if
.
We define as the infectivity resistance threshold which must be exceeded for the infection of progenitor cells to occur. The concept of pathogen load in relationship to infectivity is discussed in many studies (see , e.g. [Citation21]).
Remark 2.1
From (Equation11(11)
(11) )–(Equation15
(15)
(15) ), we deduce the following scenarios:
If
Despite the inequality in Theorem 2.2, that is,
For
Note that for
We conclude that KS does not necessarily develop because
We can summarize the results for the innate model as follows:
Lemma 2.2
Consider the system (Equation1(1)
(1) )–(Equation5
(5)
(5) ). The following statements hold:
If
If
For
3. Numerical simulations of the MIM
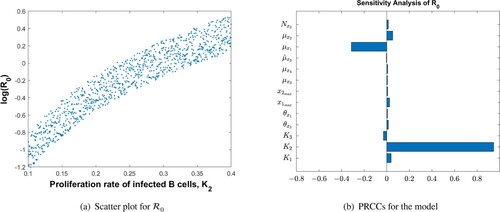
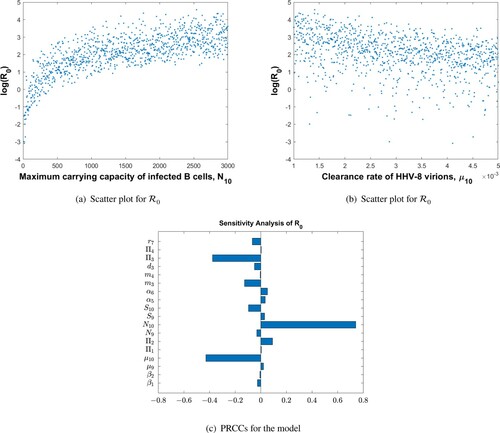
The parameter values used in Figure are given in Table . Figure shows the sensitivity analysis demonstrating how the model parameters are correlated to the reproduction number, . We have found that the rate of infected B-cell proliferation,
, is positively and significantly correlated with the reproduction number, a conclusion supported by experimental observations by [Citation13]. The other model parameters are not significantly correlated to
, and their effect on disease progression is peripheral.
Figure 2. PRCCs for parameters of the MIM and as a function of the most sensitive parameter,
: (a) scatter plot for
and (b) PRCCs for the model.
The parameter values used in Figure are given in Table . Figure demonstrates the effect of the parameter on disease progression. In particular, we have found a threshold value for
given by
, below which the HHV-8 infection clears even if
. This condition suggests that a potential anti-KS therapy can be found, probably involving pro-inflammatory cytokines such as IL-2 that have already demonstrated the potential to stimulate type I immunity [Citation28,Citation29]. We recommend that experimental and clinical studies should be conducted to assess the therapeutic effects associated with the parameter,
, and quantify its effect in reducing the KS load. We believe that clinical studies are necessary to establish the severity of the infections in (a) and (c) and the possible location of the cancer [Citation19].
Figure 3. Dynamics of the individual components of the MIM for different values of the efficacy threshold . The HHV-8 infection clears for
even if
: (a) infected progenitor cells, (b) KS cell dynamics, (c) infected B-cell dynamics, (d) HHV-8 dynamics, (e) Innate immune response.
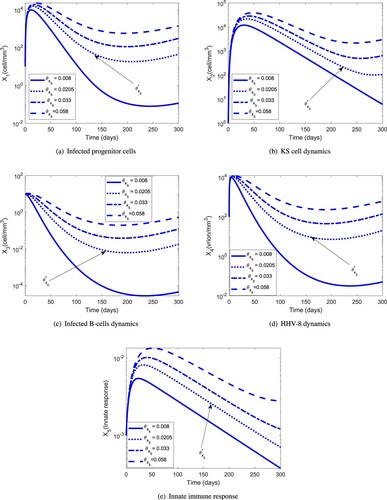
Table 1. Parameters of the MIM and their definitions.
The MIM gave a very important result regarding the development of KS. First, the model has identified three possible equilibria: , which exists for
, the KS-free equilibrium,
, which exists for
and
which exists for
. We recommend clinical studies to establish the severity and location of KS for the two equilibria,
and
. The equilibrium state,
, is possibly the most common in HHV-8 infected individuals as most of them never develop KS as a result of a high infectivity resistance threshold.
For the populations of infected progenitor cells and KS cells vanish. For this value of
, only the primary infection of B cells and replication of HHV-8 take place. Specifically, KS cannot develop, while for
both the production of HHV-8 and KS cells take place.
The MIM will be used to extract the initial conditions for the MAM in the next section for the state variables, and the parameters
and
for which KS can occur. We want to study the efficacy of the externally administered drugs that can clear/reduce the KS load.
4. MODEL WITH ADAPTIVE MECHANISM (MAM)
4.1. Model formulation and description
In case of HIV-1 and HHV-8 co-infection, a more robust adaptive immune response is developed which includes virus-specific effector cells. Their interaction with the infected and uninfected cell and virus populations is modelled below and depicted in Figure . For simplicity of notation, we denote
(16)
(16) where
in that order denote the uninfected CD4 T, B-cell populations, HHV-8 and HIV-1-specific effector cells,
denote the infected CD4 T cells, B-cell, progenitor cell populations and KS cells, respectively and finally,
are the HIV-1 and HHV-8 virions.
We have formulated the adaptive immune response described by the following system of equations:
(17)
(17) Equation (Equation17
(17)
(17) ) describes the dynamics of the susceptible CD4 T cells,
. The first term in (Equation17
(17)
(17) ) represents the constant natural replacement,
, of the CD4 T cells,
, the second term represents proliferation of a proportion of circulating
cells due to the presence of HIV-1 virions, at the constant rate,
, and the third term represents proliferation of a proportion of circulating
cells due to the presence of HHV-8 virions, at the constant rate,
. There are two proliferation terms because proliferation is pathogen dependent [Citation16,Citation18]. The fourth term is the natural death of these cells at a constant rate,
, and the fifth term represents infection of
cells by HIV-1 at a constant infection rate
and
and
are half saturation constants of proliferation for HIV-1 and HHV-8, respectively.
(18)
(18) Equation (Equation18
(18)
(18) ) describes the dynamics of the susceptible B cells,
. The first term represents the constant natural replacement,
, of the B cells,
, the second term represents the proliferation of a proportion of circulating
cells due to the presence of HIV-1 virions, at the constant rate,
, and the third term represents proliferation of a proportion of circulating
cells due to the presence of HHV-8 virions, at the constant rate,
. As in (Equation17
(17)
(17) ), there are two pathogen-dependent proliferation terms [Citation16,Citation18]. The fourth term is the natural death of these cells at a constant rate,
, and the fifth term represents infection of
cells by HHV-8 at a constant infection rate,
.
(19)
(19) Equation (Equation19
(19)
(19) ) describes the dynamics of HHV-8 specific effector cells,
. The first term represents constant replenishment,
, of these cells from precursors. The second term represents the proliferation of a proportion of circulating
cells due to the presence of the HHV-8 virions, at a constant rate,
with the half saturation constant,
. The last term represents natural death of HHV-8 specific effector cells at the constant death rate,
.
(20)
(20) Similar to above, Equation (Equation20
(20)
(20) ) describes the dynamics of HIV-1 specific effector cells,
.
(21)
(21) Equation (Equation21
(21)
(21) ) represents a class of infected CD4 T cells,
. The first term represents the proliferation of a proportion of circulating,
, cells due to the presence of HIV-1 virions and the second term represents the proliferation of a proportion of circulating,
, cells due to the presence of HHV-8 virions. The third term is the gain from infection of T cells by HIV-1. The fourth term is the lysing of infected CD4 T cells by HIV-1 specific effector cells, at a constant term,
, and the last term represents natural death of these cells at a constant rate,
.
(22)
(22) Similar to above, Equation (Equation22
(22)
(22) ) represents a class of infected B cells,
. The first two terms represent proliferation terms, the third is a gain from the infection of B cells and the fourth term represents the killing of these cells by specific effector cells.
(23)
(23) Equation (Equation23
(23)
(23) ) represents the dynamics of infected progenitor cells. The first term accounts for the logistic growth rate of these cells that is assumed to depend on HHV-8. The second term is the progression of these cells to KS at a constant rate
[Citation13]. The third term represents the killing of these cells by HHV-8 specific effector cells at a constant rate
.
(24)
(24) Equation (Equation24
(24)
(24) ) represents the dynamics of KS. The first term represents the source from infection of progenitor cells. The second term represents natural loss of KS cells.
(25)
(25) Equation (Equation25
(25)
(25) ) represents the dynamics of HIV-1. The first term represents the production of virions from the bursting of the infected CD4 T cells. The parameter
represents the maximum carrying capacity of infected CD4 T cells. The second term is the clearance rate of HIV-1.
(26)
(26) Equation (Equation26
(26)
(26) ) represents the rate of change of HHV-8. The first term represents the rate at which HHV-8 is produced from bursting of the infected B cells. The parameter
represents the maximum carrying capacity of infected B cells. The last term accounts for the clearance rate of HHV-8.
4.2. Analysis of the model
4.2.1. Positivity and boundedness of solutions
From Equations (Equation25(25)
(25) )–(Equation26
(26)
(26) ), we have
, for all
and i = 9, 10. To prove the positivity and ensure that the model (Equation17
(17)
(17) )–(Equation26
(26)
(26) ) is well-posed, we use the following two conditions, (C1) and (C2):
Lemma 4.1
Consider the system (Equation17(17)
(17) )–(Equation26
(26)
(26) ) and assume that
and
hold.
If
Moreover,
First we will rearrange the system (Equation17(17)
(17) )–(Equation26
(26)
(26) ) into a subsystem of uninfected (S1) states (Equations Equation17
(17)
(17) –Equation20
(20)
(20) ) and infected (S2) states (Equations Equation21
(21)
(21) –Equation26
(26)
(26) ). It will be shown that if the noninfected states in (S1) are non-negative for all
, then the infected states in (S2) are non-negative for all
.
Proof
Proof of Lemma 4.1(a)
The subsystem of uninfected states (S1) can be written as a system of differential inequalities
(27)
(27) where
for
. The last component is defined as
,
Clearly,
by virtue of (EquationA1
(A1)
(A1) ). Suppose the assertion
for
is not true. Then there exists a smallest number
such that
Then,
is a decreasing function and we would have
However, from the differential inequality (Equation27
(27)
(27) ) for
we get
which is a contradiction. Hence, if
, then
for all
.
The subsystem of infected states (S2) can be written in the matrix form where
, and
with entries
By virtue of (EquationA1
(A1)
(A1) ) and (EquationA2
(A2)
(A2) ), M is a Metzler matrix. Hence, the infected states
for all t>0, i = 5, 6, 7, 8, 9, 10.
The proof of Lemma 4.1(b) is given in the Appendix.
4.3. Virus free equilibrium and the basic reproduction number
The system (Equation17(17)
(17) )–(Equation26
(26)
(26) ) has a virus free equilibrium,
, given by
(28)
(28) Applying the next-generation matrix approach [Citation32], the basic reproduction number for model (Equation17
(17)
(17) )–(Equation26
(26)
(26) ) reads as follows:
(29)
(29) where
and
(30)
(30) are the reproduction numbers attributed to HIV-1 and HHV-8 infections, respectively. Note that the effect of virus-specific effector cells in (Equation30
(30)
(30) ) varies from weak to perfect as
changes. It readily follows that
(31)
(31) where
,
are the reproduction numbers when the virus-specific effector cells are dysfunctional.
Given (Equation29(29)
(29) )–(Equation30
(30)
(30) ) we make the following observations:
Observation 4.1
If or
, then
and the model reproduction number is given by
Observation 4.2
Decreasing/increasing or
decreases/increases the reproduction number. Since
and
are the proliferation terms of the uninfected/infected B- and T-cell populations, an optimal control approach will be necessary that will balance the level of proliferation during a potential chemo- or immunotherapy.
Observation 4.3
When , the reproduction number reduces to
(32)
(32) It is possible in this case for the infection to persist if
, even if both
and
Details on the computation of the reproduction number, and the interpretation of
and
for
the reader is directed to the appendix.
4.3.1. Global stability for the virus free equilibrium,
Theorem 4.1
Decompose the system (Equation17(17)
(17) )–(Equation26
(26)
(26) ) as in Lemma A.1 in the Appendix. Then the steady state
of the system (Equation17
(17)
(17) )–(Equation26
(26)
(26) ) is globally asymptotically stable for
.
Proof.
Denote . Then following [Citation9], we set
,
and define
where
The global stability of the system (Equation17
(17)
(17) )–(Equation26
(26)
(26) ) at
requires that
and
Then
is a globally asymptotically stable solution of the system
since
is the limiting function of
, that is,
. It follows that
and so
is globally asymptotically stable.
4.4. AIDS-KS-present equilibrium,
Theorem 4.2
Consider the system (Equation17(17)
(17) )–(Equation26
(26)
(26) ). The KS present equilibrium,
, exists if
and
where
(33)
(33)
where and
are proved to be positive solutions of the fourth degree polynomials
. The reader is directed to the appendix for details.
Remark 4.1
Observe that when and
, we obtain the virus free equilibrium,
in Equation (Equation28
(28)
(28) ).
4.5. Non-AIDS-KS-present equilibrium,
Theorem 4.3
Consider the system (Equation17(17)
(17) )–(Equation26
(26)
(26) ). The non-AIDS-KS-present equilibrium,
, exists if
and
where
(34)
(34) where
is a positive zero to
(35)
(35)
(36)
(36)
Note that if and only if
. Using the continuity property of cubic polynomials, we have
Hence, there must be a positive value of
namely,
such that
5. Numerical simulations of the MAM
Figure shows the sensitivity analysis of parameters from Table on . The maximum carrying capacity of infected B cells is strongly positively correlated with
, whereas the HHV-8 clearance rate has the opposite effect. The logarithm of the reproduction number as a function of these two parameters is also shown. For small values of
, the increase is fast, implying that one can overestimate the severity of the infection. For large values of
, the increase is slow, implying that disease progression is stable and the conclusions are not adversely affected. The relationship between the
and the clearance rate of HHV-8 virions is almost linear, suggesting a moderate negative correlation with the progression of AIDS-KS.
Figure 4. Schematic diagram for the MAM.
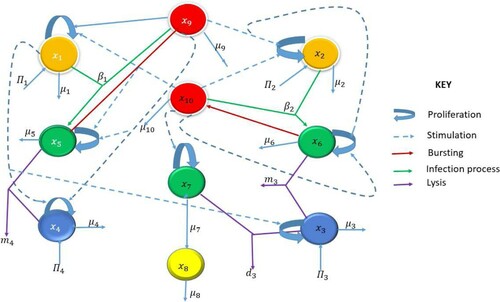
Figure 5. PRCCs for parameters of the MAM and log() as a function of the two most sensitive parameters,
and
: (a) scatter plot for
, (b) scatter plot for
and (c) PRCCs for the model.
The parameter values used in Figures are given in Table . Assuming an advanced HIV-1 and HHV-8 co-infection stage, the initial condition of the system (Equation17(17)
(17) )–(Equation26
(26)
(26) ) was chosen to be the equilibrium point of the system (Equation1
(1)
(1) )–(Equation5
(5)
(5) ). Figure shows the dynamics of the uninfected/infected B cells and CD4 T cells, infected progenitor cells, KS cells and virions for a period of 300 days. The population of infected CD4 T cells reaches a peak at 100 days by then the population of infected B cells have already reached a steady state. These results, in line with experimental evidence, support the fact that KS may accelerate the clinical course of HIV-1 infection.
Figure 6. Dynamics of the individual components of the MAM for : (a) uninfected CD4 T cells and infected CD4 T-cells; (b) uninfected B cells and infected B cells; (c) infected progenitor cells and KS cells, and (d) HIV-1 and HHV-8.
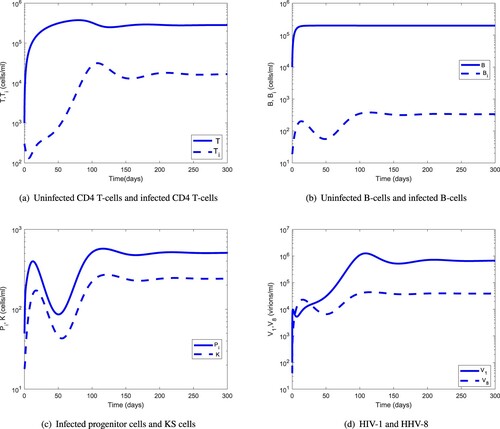
Figure 7. Comparison of the long-term dynamics of the uninfected CD4 T cells and B cells with regard to HIV-1 and HHV-8 load: (a) HIV-1 and uninfected CD4 T cells and (b) HHV-8 and uninfected B cells.
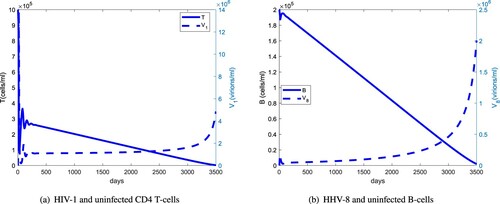
Figure 8. (a) Same as Figure (a) but for the first 300 days. (b) The long-term dynamics of infected B cells and KS cells with regards to HHV-8 load: (a) HIV-1 and uninfected CD4 T cells and (b) KS cells, HHV-8 and infected B-cell dynamics.
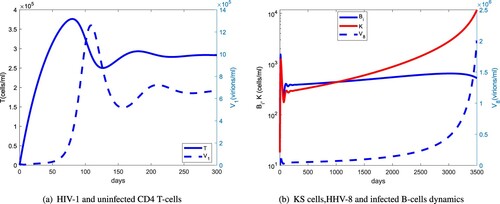
Table 2. Parameters of the MAM and their definitions.
Figure compares the long-term dynamics of HIV-1 and HHV-8 populations with uninfected CD4 T and B cells. The uninfected CD4 T-cell population starts declining rapidly after about 300 days and the HIV-1 population switches from a stable to an exponential growth after about 6 years. For the infected B-cell population, this switch occurs after about 8 years. The delay in the switching time from a stable to exponential growth between the HIV-1 and HHV-8 viral load indicates that HHV-1 supports the clinical course of KS. Figure shows that the uninfected CD4 T-cell population peaks at about 60 days, 40 days before the HIV-1 peak and that the KS cell population will have a steeper rise than the relatively stable infected B-cell population. This suggests that at later stages of AIDS-KS, the reservoirs of HHV-8 will be predominantly the infected progenitor cells.
6. Optimal control applied to the MAM
We now apply an optimal control approach to the system (Equation17(17)
(17) )–(Equation26
(26)
(26) ). In order to determine the optimal strategy for controlling AIDS-KS with cART, we introduce three time-dependent controls:
and
. The control
is the efficacy of HAART for preventing the infection of CD4 T cells by HIV-1 and
is the efficacy of HAART in preventing the infection of B cells by HHV-8. The third control
represents the efficacy of an anti-KS therapy by enhancing the proliferation of CD4 T and B cells.
(37)
(37) Equation (Equation37
(37)
(37) ) describes the dynamics of the uninfected CD4 T cells. The meanings of the various terms are given in Equation (Equation17
(17)
(17) ). However, the proliferation constants,
in (Equation17
(17)
(17) ) are now replaced by
and
, respectively. Note that
is here assumed to be a multiple of
, with ϵ being the constant of proportionality, which is purely done for technical reasons. The infection coefficient,
, is replaced by
where
is the efficacy of HAART in preventing the infection of healthy CD4 T cells and hence,
could represent treatment with either the fusion inhibitor or the reverse transcriptase inhibitor.
(38)
(38) Equation (Equation38
(38)
(38) ) describes the dynamics of the susceptible B cells. The meanings of the various terms are given in Equation (Equation18
(18)
(18) ). The second and third terms are explained in E (Equation37
(37)
(37) ). The first and fourth terms are explained in Equation (Equation18
(18)
(18) ). The infection coefficient,
, is replaced by
where
is the efficacy of HAART in preventing the infection of healthy B cells. It is well documented that AIDS-KS patients undergoing HAART treatment undergo remission and hence, we assume that HAART treatment reduces the infection rate of B cells by HHV-8.
(39)
(39) Equation (Equation39
(39)
(39) ) describes the dynamics of HHV-8 specific effector cells,
. The terms are as explained in Equation (Equation19
(19)
(19) ).
(40)
(40) Equation (Equation40
(40)
(40) ) describes the dynamics of HIV-1 specific effector cells,
.The terms are as explained in Equation (Equation20
(20)
(20) ).
(41)
(41) Equation (Equation41
(41)
(41) ) represents a class of infected CD4 T cells,
. The first two terms are as explained in (Equation37
(37)
(37) ) and (Equation38
(38)
(38) ) above. The third term is the gain from Equation (Equation37
(37)
(37) ) and the other terms are as explained in Equation (Equation21
(21)
(21) ).
(42)
(42) Equation (Equation42
(42)
(42) ) represents a class of infected B cells,
. The first two terms are as explained in (Equation41
(41)
(41) ) above. The third term is the gain from Equation (Equation38
(38)
(38) ) and the other terms are as explained in Equation (Equation22
(22)
(22) ).
(43)
(43) Equation (Equation43
(43)
(43) ) represents the dynamics of infected progenitor cells. In the first term, the logistic growth rate
is reduced by a factor
due to the action of HAART in blocking the infection of progenitor cells by HHV-8. The other terms are as explained before in Equation (Equation23
(23)
(23) ).
(44)
(44) Equation (Equation44
(44)
(44) ) represents the dynamics of KS. The terms are already explained in Equation (Equation24
(24)
(24) ).
(45)
(45) Equation (Equation45
(45)
(45) ) represents the HIV-1 dynamics. The first term is decreased by a factor
to reflect the action of HAART in blocking the production of infectious and mature HIV-1 virions. The other term is explained in Equation (Equation25
(25)
(25) ).
(46)
(46) Similar to Equation (Equation45
(45)
(45) ), Equation (Equation46
(46)
(46) ) represents the HHV-8 dynamics.
To this end, we consider the objective (or cost) functional
(47)
(47) where the control functions
and
are bounded, Lebesgue integrable functions on
and
are positive constants.
6.1. Existence of optimal control
Our control problem is formulated by minimizing the functional J subject to the system (Equation37(37)
(37) )–(Equation46
(46)
(46) ). That is, we seek to find optimal controls
and
such that
(48)
(48) where
(49)
(49) is the control set.
The necessary conditions that an optimal solution must satisfy come from the Pontryagin et al. [Citation26] maximum principle. This principle converts the system (Equation37(37)
(37) )–(Equation46
(46)
(46) ) with Equation (Equation47
(47)
(47) ) into a problem of minimizing pointwise a Hamiltonian H, with respect to
and
The Hamiltonian function of the optimal problem is given by
(50)
(50) where
and
are the adjoint or co-state variable corresponding to the state variable
The system of equations is found by taking appropriate partial derivatives of the Hamiltonian with respect to the associated state variable,
Theorem 6.1
Given optimal controls that minimize
over U, and the solutions
of the corresponding state system (Equation37
(37)
(37) )–(Equation46
(46)
(46) ) with Equation (Equation47
(47)
(47) ), then there exist adjoint variables
satisfying
and
where
are given by
Proof.
Corollary 4.1 of Fleming and Rishel [Citation12] gives the existence of an optimal control due to the convexity of the integrand of J with respect to and
. In addition, it also guarantees a-priori boundedness of the state solutions and the Lipschitz property of the state system with respect to the state variables. The differential equations governing the adjoint variables are obtained by differentiation of the Hamiltonian function, evaluated at the optimal control. Then the adjoint differential equations can be written as
In what follows, we differentiate the Hamiltonian H with respect to
to obtain
By standard control arguments involving the bounds on the controls, we conclude
which can be compactly written as
Analogously, this can be written as
7. Numerical simulations of optimal treatment regiments
Figure shows the profiles of the optimal variables and
in the first 20 days. The initial values
are used in an iterative procedure for periods much longer than 20 days. Figure depicts the dynamics of the infected cell populations and viral loads for fixed values of
and
during 300 days for different values of the HAART efficacy parameter
. For optimal efficacy
, the HIV-1 and HHV-8 populations drop below the level of detection. This parameter combination, however, is not unique as illustrated in Figure , which shows that reduced infected CD4 T-cell-specific HAART efficacy (from
to
) and increased infected B-cell-specific HAART efficacy (from
to
) in combination with reduced KS therapy-specific efficacy (from
to
) is also able to control HIV-1 and HHV-8 co-infection. It is possible to find the triple
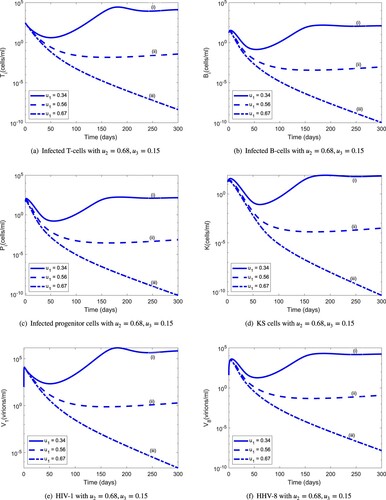
but this is not unique. This conclusion makes it easier to develop cheaper combinations that would suit the budgets of developing countries.
Figure 9. Optimal controls in the first 20 days. (a) Control profiles of optimal controls, .
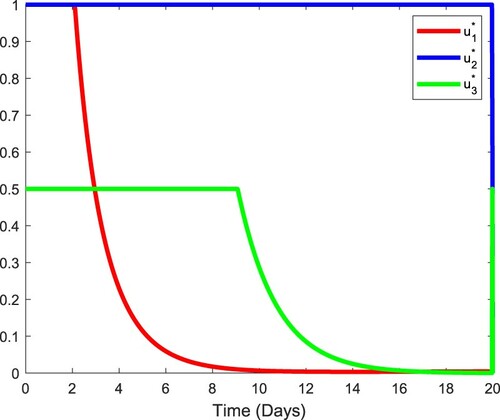
Figure 10. Population dynamics of infected cells and viruses during 300 days for varying values of the infected CD4 T-cell-specific HAART efficacy : (a) infected T cells with
; (b) infected B cells with
; (c) infected progenitor cells with
; (d) KS cells with
; (e) HIV-1 with
; (f) HHV-8 with
.
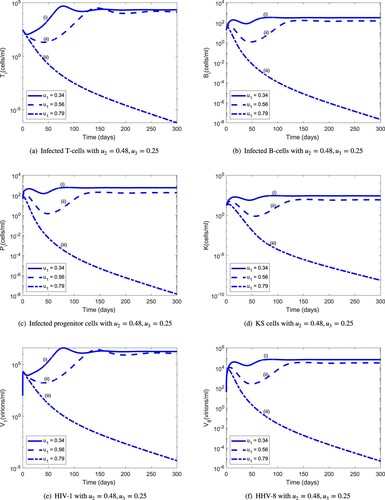
Figure 11. Population dynamics of infected cells and viruses during 300 days for a new combination of optimal controls: (a) Infected T cells with ; (b) infected B cells with
; (c) infected progenitor cells with
; (d) KS cells with
; (e) HIV-1 with
; (f) HHV-8 with
.
8. Discussion
Currently there is no treatment available to eradicate HHV-8 infection and the purpose of anti-KS therapies is directed at slowing disease progression. KS is the most common neoplasm associated with AIDS and hence, therapies centre on the use of HAART in AIDS-KS patients. In this work, we formulate two models with innate and adaptive mechanism, in order to study the dynamics of non-AIDS KS and AIDS-KS and to make predictions about the efficacy of anti-KS therapies.
Some evidence suggests that immune activation is a requisite for the development of Classic KS [Citation11,Citation22]. Hence, we included the effect of the immune response in the MIM and showed that in silico treatment of NAKS can significantly reduce HHV-8 infection. We determined a critical value of the efficacy threshold for the innate immune response below which KS burden is diminished even if . This is completely novel to the best of our knowledge and has important implications, since therapies involving cytokines such as IL-2 [Citation28] may have adverse side effects. Because it is not known how long the innate response for HIV-1 and HHV-8 co-infection lasts, this study is not able to suggest the dosage and frequency of treatment regimen. It is hoped a clinical study can explore the potential revealed by this study.
About 30% of Classic KS patients develop a second malignancy like non-Hodgkin lymphoma [Citation10], hence, an early diagnosis that may prevent second malignancies is essential. The MIM demonstrated the potential for controlling HHV-8 infection and consequently, also HIV-1 and HHV-8 co-infection. Currently, there are early HIV-1 tests capable of revealing that an individual has been in contact with someone infected with HIV-1 (http://hivinsite.ucsf.edu/insite?page=basics-01-01). The strategy described in this study can be used to prevent HIV-1 infections before they develop for example in rape victims who are treated with antiretroviral drugs for 28 days immediately after the crime.
In the absence of any treatment the long-term prognosis of AIDS-KS is poor. This is shown by Figures and of the MAM. However, if cART (e.g. HAART plus KS therapy) is administered at optimal levels, both HIV-1 and HHV-8 infection can decline to undetectable levels (Figures and ). The simulations indicate that HAART at suboptimal levels cannot eradicate the viral load, which can possibly lead to the emergence of drug-resistance mutations [Citation2]. For cART, when the efficacy of a potential fusion inhibitor or reverse transcriptase inhibitor is kept at optimal level, a very low level efficacy for KS therapy is sufficient to control the HHV-8 infection.
The implications of our study are three-fold. First, early intervention in the form of KS-therapy can control HHV-8 infection from developing into KS and possibly also slow HIV-1 infection to develop into AIDS. Second, optimal control of HIV-1 infection using HAART is an integral part of a successful AIDS-KS therapy and should be used in combination with low-level KS therapy. These recommendations have the potential to impact the therapeutic goal in KS, by focusing on short term control and thus, aiding long-term remission. Third, it is hoped that the existence of an infectivity threshold, which is critical for the progression of KS from asymptomatic to symptomatic stage, can help to study for example, the HHV-8 infectivity of transfusions [Citation1].
The MIM revealed that externally administered cytokine drugs can reduce the chances of KS developing. This is supported in part by a study by [Citation29,Citation33] involving IL-2 and IL-12 which showed that administration of cytokines can prevent or delay the development of infection. However, to the best of our knowledge there are no clinical studies that have determined the safe levels of these cytokine drugs that can be taken. Because it is not known how long the innate response for HIV-1/HHV-8 co-infection lasts, this study is not able to suggest the dosage and frequency of treatment regimen. We believe a clinical study can explore the potential revealed by our study.
Abbreviations
KS, Kaposi's Sarcoma; AIDS, Acquired immune deficiency syndrome; HHV-8, Human Herpes virus-8; HAART, Highly Active Antiretroviral Therapy
Disclosure statement
No potential conflict of interest was reported by the author(s).
Additional information
Funding
References
- J.P. Allain and R. Goodrich, Pathogen reduction of whole blood: Utility and feasibility, Transfus. Med. 27 (2017), pp. 320–326.
- M. Arnedo-Valero, F. García, C. Gil, T. Guila, E. Fumero, P. Castro, J.L. Blanco, J.M. Miró, T. Pumarola, and J.M. Gatell, Risk of selecting de novo drug-Resistance mutations during structured treatment interruptions in patients with chronic HIV infection, Clin. Infect. Dis. 41(6) (2005), pp. 883–890.
- M.T. Baldridge, K.Y. King, and M.A. Goodell, Inflammatory signals regulate hematopoietic stem cells, Trends Immunol. 32(2) (2011), pp. 57–65.
- S. Baral, R. Antia, and N.M. Dixit, A Dynamical Motif Comprising the Interactions Between Antigens and CD8 T Cells May Underlie the Outcomes of Viral Infections, Scrpps Research Institute, La Jolla, CA, 2019.
- S.D. Bella, A. Taddeo, M.L. Calabrò, L. Brambilla, M. Bellinvia, E. Bergamo, M. Clerici, and M.L. Villa, Peripheral blood endothelial progenitors as potential reservoirs of Kaposi's Sarcoma-associated herpesvirus, PLoS ONE 3 (2008), p. e1520.
- S.D. Bella, A. Taddeo, E. Colombo, L. Brambilla, M. Bellinvia, F. Pregliasco, M. Cappelletti, M.L. Calabrò, and M.L. Villa, Human herpesvirus-8 infection leads to expansion of the preimmune/natural effector B cell compartment, PLoS ONE 5 (2010), p. e15029.
- C. Boshoff and R. Weiss, AIDS-related malignancies, Nat. Rev. Cancer 2 (2002), pp. 373–382.
- D.M. Campbell, G. Rappocciolo, F.J. Jenkins, and C.R. Rinaldo, Dendritic cells: Key players in human herpesvirus 8 infection and pathogenesis, Front. Microbiol. 5 (2014), p. 452.
- C. Castillo-Chavez, S. Blower, P. van den Driessche, D. Kirschner, and A.-A. Yakubu (eds.), On the computation of R0 and its role on global stability, in Mathematical Approaches for Emerging and Reemerging Infectious Diseases: An Introduction (Minneapolis, MN, 1999), IMA Math. Appl., Vol. 125, Springer, New York, 2002, pp. 229–250
- M.P. Escalon and F.B. Hagemeister, AIDS-related malignancies, in The MD Anderson Manual of Medical Oncology, H.M. Kantarjian, R.A. Wolff, and C.A. Koller, eds., McGraw-Hill, 2006, pp. 903–910
- V. Fiorelli, R. Gendelman, M.C. Sirianni, H.K. Chang, S. Colombini, P.D. Markham, P. Monini, J. Sonnabend, A. Pintus, R.C. Gallo, and B. Ensoli, Gamma-Interferon produced by CD8+ T-cells infiltrating Kaposi's Sarcoma induces spindle cells with angiogenic phenotype and synergy with human immunodeficiency virus-1 tat protein: An immune response to human herpesvirus-8 infection? Blood91(3) (1998), pp. 956–967.
- W.H. Fleming and R.W. Rishel, Deterministic and Stochastic Optimal Control, Springer-Verlag, New York, 1975.
- K.E. Foreman, Kaposi's Sarcoma: The role of HHV8 and HIV1 in pathogenesis, Expert Rev. Mol. Med. 3(9) (2001), pp. 1–17.
- K.E. Foreman, J. Friborg Jr., W.-P. Kong, C. Woffendin, P.J. Polverini, B.J. Nickoloff, and G.J. Nabel, Propagation of a human herpesvirus from AIDS-associated Kaposis Sarcoma, N. Engl. J. Med. 336(3) (1997), pp. 163–171.
- S. Gramolelli and T.F. Schulz, The role of Kaposi Sarcoma–associated herpesvirus in the pathogenesis of Kaposi Sarcoma, J. Pathol. 235(2) (2015), pp. 368–380.
- M.M. Hadjiandreou, R. Conejeros, and D.I. Wilson, Long-term HIV dynamics subject to continuous therapy and structured treatment interruptions, Chem. Eng. Sci. 64(7) (2009), pp. 1600–1617.
- L. Kestens, M. Melbye, R.J. Biggar, W.J. Stevens, P. Piot, A. De Muynck, H. Taelman, M. De Feyter, L.Paluku, and P.L. Gigase, Endemic African Kaposi's Sarcoma is not associated with immunodeficiency, Int. J. Cancer 36(1) (1985), pp. 29–34.
- D. Kirschner, Using mathematics to understand HIV immune dynamics, Not. AMS 43(2) (1996), pp. 191–202.
- A.G. Marcelin, I. Gorin, P. Morand, Z. Ait-Arkoub, J. Deleuze, J.P. Morini, V. Calvez, and N. Dupin, Quantification of Kaposi's Sarcoma-associated herpesvirus in blood, oral mucosa, and saliva in patients with Kaposi's Sarcoma, AIDS Res. Human Retrov. 20(7) (2004), pp. 704–708.
- J.N. Martin, D.E. Ganem, D.H. Osmond, K.A. Page-Shafer, D. Macrae, and D.H. Kedes, Sexual transmission and the natural history of human herpesvirus 8 infection, N. Engl. J. Med. 338(14) (1998), pp. 948–954.
- J. McCullough, H.J. Alter, and P.M. Ness, Interpretation of pathogen load in relationship to infectivity and pathogen reduction efficacy, Transfusion 59(3) (2019), pp. 1132–1146.
- P. Monini, S. Colombini, M. Stürzl, D. Goletti, A. Cafaro, C. Sgadari, S. Buttò, M. Franco, P. Leone, S. Fais, P. Leone, G. Melucci-Vigo, C. Chiozzini, F. Carlini, G. Ascherl, E. Cornali, C.Zietz, E. Ramazzotti, F. Ensoli, M. Andreoni, P. Pezzotti, G. Rezza, R. Yarchoan, R.C. Gallo, and B. Ensoli, Reactivation and persistence of human herpesvirus-8 infection in B cells and monocytes by Th-1 cytokines increased in Kaposi's Sarcoma, Blood 93(12) (1999), pp. 4044–4058.
- D.M. Muema, N.A. Akilimali, O.C. Ndumnego, S.S. Rasehlo, R. Durgiah, D.B.A. Ojwach, N. Ismail, M. Dong, A. Moodley, K.L. Dong, Z.M. Ndhlovu, J.M. Mabuka, B.D. Walker, J.K. Mann, and T.Ndung'u, Association between the cytokine storm, immune cell dynamics, and viral replicative capacity in hyperacute HIV infection, BMC Med. 18 (2020).
- F. Pak, A.R. Mwakigonja, P Kokhaei, N Hosseinzadeh, P. Pyakurel, E. Kaaya, G. Bogdanovic, G.Selivanova, and P. Biberfeld, Kaposi's Sarcoma herpesvirus load in biopsies of cutaneous and oral Kaposi's Sarcoma lesions, Eur. J. Cancer 43 (2007), pp. 1877–1882.
- A.S. Perelson and D.E. Kirschner, Dynamics of HIV infection of CD4 T cells, Math. Biosci. 114 (1993), pp. 81–125.
- L.S. Pontryagin, V.G. Boltyanskii, R.V. Gamkrelidze, and E.F. Mishchenko, The Mathematical Theory of Optimal Processes, Wiley, New York, 1962.
- G. Rappocciolo, M. Jais, P.A. Piazza, D.C. DeLucia, F.J. Jenkins, and C.R. Rinaldo, Human herpesvirus 8 infects and replicates in langerhans cells and interstitial dermal dendritic cells and impairs their function, J. Virol. 91(20) (2017).
- R. Shibagaki, S. Kishimoto, and H. Takenaka, Recombinant interleukin 2 monotherapy for classic Kaposi Sarcoma, Arch Dermatol. 134(10) (1998), pp. 1193–1196.
- A.K. Smith, Stimulation of Immune Response with Low Doses of Cytokines, Cornell Research Foundation Inc, New York, NY, 2003.
- L. Sompayrac, How the Immune System Works, 6th ed., John Wiley & Sons, West Sussex, 2019.
- B. Szomolay and E.M. Lungu, A mathematical model for the treatment of AIDS – related Kaposi's Sarcoma, J. Biol. Syst. 22(3) (2014), pp. 495–522.
- P. van den Driessche and J. Watmough, Reproduction numbers and sub – threshold endemic equilibria for compartmental models of disease transmission, Math. Biosci. 180 (2002), pp. 29–48.
- R. Yarchoan, J.M. Pluda, K.M. Wyvill, K. Aleman, I.R. Rodriguez-Chavez, G. Tosato, A.T. Catanzaro, S.M. Steinberg, and R.F. Little, Treatment of AIDS-related Kaposi's Sarcoma with interleukin-12: Rationale and preliminary evidence of clinical activity, Crit. Rev. Immunol. 27(5) (2007), pp. 401–414. HIV and AIDS Malignancy Branch.
Appendix
(i) Positivity and boundedness of solution
Lemma
b
Let and
denote the total sub-populations of the
T cells and B cells at time t, respectively, where
by Lemma
.
Table A1. Range of parameters for sensitivity analysis for the MIM.
Table A2. Range of parameters for sensitivity analysis for the MAM.
Adding Equations (Equation17(17)
(17) ) and (Equation21
(21)
(21) ), and then (Equation18
(18)
(18) ) and (Equation22
(22)
(22) ) we get
It is easy to show that as
Equations (Equation25
(25)
(25) ) and (Equation26
(26)
(26) ) can be represented by
It is easy to show that
(ii) Virus Free Equilibrium and the Basic Reproduction Number
The following refers to the reproduction numbers given in Section 4.3
(A1)
(A1)
(A2)
(A2) From (EquationA2
(A2)
(A2) ) we can deduce that
1. Let . The system (Equation17
(17)
(17) )– Equation26
(26)
(26) ) can be written as
The matrices for new infections and other class transition, respectively given by F and V, are
(A3)
(A3) (iii) Global stability for the virus free equilibrium,
Lemma A.1
The lemma is based on the work of Castillo-Chavez et al. [Citation9]. Consider the system
(A4)
(A4) where
denotes the components of the uninfected states,
denotes the components of the infected states and
denotes the disease-free equilibrium of (EquationA4
(A4)
(A4) ). Assume the conditions (H1) and (H2) below are satisfied
where
is an M-matrix (the off diagonal elements of A are nonnegative) and Ω is the region where the model makes biological sense. Then
is globally asymptotically stable.
(iv) AIDS-KS present equilibrium,
The coordinates and
in Theorem 4.2 are positive solutions to
where
(A5)
(A5) with
(A6)
(A6) The existence of a positive value,
, for
can be justified as follows:
Note that Due to the continuity of
, we have
since
Hence, there exists a positive value for
say,
such that
Using Equation (Equation25(25)
(25) ) along with
just obtained above, we get
(A7)
(A7) with
(A8)
(A8) Analogously, arguing as before, we can establish the existence of a positive value of
say,
satisfying