
ABSTRACT
The corrosion performance of α-brass in 1 M HNO3 and in the presence of polyethylene glycol (PEG) has been investigated using AC impedance spectra (EIS), potentiodynamic polarization (PP), electrochemical frequency modulation (EFM), and mass reduction (MR) techniques. The outcome data of EIS showed a rise in the resistance charge transfer (Rct) and a decrease in the capacitance double layer (Cdl). Protection efficiency (IE) of PEG has been obtained by varying the dose of the PEG and temperature. PEG adsorbed on α-brass in acidic solution follows isotherm Langmuir. The polarization curves displayed that PEG acts as a mixed-kind inhibitor. The parameters obtained from thermodynamic activation of corrosion α-brass in 1 M HNO3 were obtained and debated. The results obtained from all tests were in excellent agreement.
1. Introduction
α-Brass has good thermal and electrical conductivity, best resistance for corrosion and wide uses. It is broadly utilized in the cooling systems, distillation plants, valves, and condensers systems. α-Brass is typically utilized in structure rails, fronts, door knobs, lock bodies, etc. Destructive acid medium has been generally used as a part of the manufacturing. The most important steps are acid pickling, manufacturing acid cleaning, decaling and oil acidizing well ( Citation1, Citation2). Dissolution prevention is considered so as to lessen the rates of corrosion on α-brass in this acidic medium ( Citation3–8). An inhibitor is a material utilized to lower the rate of corrosion by the absorption on the metal surfaces ( Citation9, Citation10). Many organic compounds are used as excellent inhibitors for α-brass because they contain donation π-electron, while others might give this donation by the organic compounds existing in the extracts ( Citation11–15). The use of natural products and organic compounds otherwise identified as “green corrosion inhibitors” has been supported because of the cost, toxic nature and environmentally unfriendliness of inorganic and organic corrosion inhibitors. More so, they are readily available, cheap, and a renewable source of materials. The use of polymers as corrosion inhibitors has attracted considerable attention recently. The polymers utilized as corrosion inhibitors have been highly considered newly due to the following factors: (1) they are low cost and are stable to metallic materials in aqueous solutions, (2) proprietorship of multiple sites’ adsorption, and (3) some studies concluded that their functional groups can form complexes with metal ions’ surface and protect the surface of metals ( Citation16–20). Some polymers are declared as corrosion inhibitors in dissimilar destructive media ( Citation21–24). Some of these polymers are polyethylene glycols (PEGs, Citation25–32). The protective power of these polymers is connected structurally to the cyclic rings, heteroatom. Several polymers have been described to prevent the corrosion of α-brass in numerous aqueous solutions ( Citation33–36). However, no examinations have described about the protective influence of PEGs on α-brass corrosion. In the current work, authors examine the corrosion hindrance activity of PEG by utilizing electrochemical and non-electrochemical tests that described to be a very active corrosion inhibitor for the mild steel protection ( Citation37) in aqueous solution to encourage an eco-friendly environment.
In the present study, it is intended to examine the influence of PEG dose and temperature on the corrosion behavior of α-brass alloy in 1 M HNO3, and to compare corrosion protection data derived from EFM with that obtained from AC impedance spectra (EIS), potentiodynamic polarization (PP) and mass reduction (MR) tests. The surface morphology of α-brass utilizing: scanning electron microscopy (SEM), Fourier transform infrared spectra (FT-IR), and atomic force micrographs (AFM) and the influence of the temperature on corrosion rate to calculate the thermodynamic parameters of activation and adsorption processes.
2. Experimental details
2.1. Composition of α-brass samples in weight % is: Fe 0.002, Pb 0.029, Zn 32.68, and Cu rest
2.2. Chemicals and solutions
The aggressive solution 1 M HNO3 was prepared by dissolving the analytical reagent HNO3 (70%) with second distilled water, and its dose was tested by standardized NaOH solution. The doses utilized (50–300 ppm) were obtained by dilution with second distilled water. The structure of the PEG is shown below with the molecular formula C2nH4n+2On+1
2.3. Methods utilized for corrosion tests
2.3.1. MR method
The MR investigates were accepted by utilizing square specimens of area 2 × 2 × 0.2 cm. The coins were first abraded to a mirror finish (600, 800, and 1200), degreased in acetone, and lastly cleansed with second distilled water and dried before being weighed and after that inundation into the solution test was done. The MR tests had done in a 100 ml aptitude glass beaker positioned in a water thermostat, which enclosed 100 ml of 1 M nitric acid with and without various doses of PEG. After 3 hours inundation, the coins had been obtained, washed, dried, and massed exactly. The mean MR of the all α-brass coins can be obtained from the relation:(1) where WB and WA are the mass of α-brass before and after coming into contact with the destructive solution, correspondingly. The % IE and the degree of surface coverage (θ) of PEG for the corrosion of α-brass were computed as follows:
(2) where ΔWfree and ΔWinh are the mass losses of α-brass per unit area with and without of PEG correspondingly.
(3) where C.R. is the rate of corrosion in (mg cm−2 min−1) and D is metal density (g cm−3).
2.3.2. Potentiodynamic polarization tests
PP investigations were done in a predictable three-electrode cell. The working electrode (WE) was cutfrom α-brass coins of equal conformation implanted in epoxy resin. Prior to each measurement, the electrode surface was pretreated in the similar way as the MR tests. The potential was taking place from −600 to +400 mV vs open circuit potential (Eocp). All tests were done in freshly ready solutions at 25 ± 1°C.
2.3.3. Impedance tests
EIS tests were carried out by utilizing AC signals of 5 mV peak-to-peak amplitude at the OCP in the frequency of 100 kHz to 0.1 Hz. All EIS data were fitted to suitable equivalent circuit using the Gamry Echem Analyst software. The % IE and the (θ) of the PEG obtained from the EIS can be measured from Equation (4) (
Citation38):(4) where R°ct and Rct are the resistance in the lack and attendance of inhibitor, correspondingly.
2.3.4. Electrochemical frequency modulation tests
EFM was done with relating potential perturbation signal with an amplitude of 10 mV with two sine waves of 2 and 5Hz ( Citation39). The greater peaks have utilized to calculate the EFM parameters ( Citation40).
All electrochemical tests were done at 25±1°C, utilizing Gamry apparatus PCI300/4 Potentiostat/Galvanostat/Zra analyzer.
2.3.5. Surface analysis
The α-brass coins were inundated in numerous test solutions. Then, they have engaged out and dried. The natural surroundings of the film formed on the α-brass surface coins were measured by FT-IR utilizing a Spectrum RXI Spectrophotometer, by SEM utilizing a VEGA3-TESCAN model, and by AFM using A100 model (A.P.E Research, Italy).
3. Results and discussion
3.1. Potentiodynamic polarization tests
Nitric acid is a strong oxidizer for α-brass ( Citation41). From the Tafel polarization diagrams, there is no steep slope in the anodic range, indicating that no passive films are obtained on the surface α-brass. PP test was carried out in order to gain information regarding the kinetics of the cathodic and anodic reactions ( Citation42). displays the PP performance of α-brass in 1 M HNO3 with and without various doses of PEG. The results of PP: icorr (corrosion current densities), Ecorr (corrosion potential), cathodic and anodic Tafel slopes (βc, βa), (θ), and (% IE) were measured from the diagrams of and are recorded in for PEG.
Figure 1. PP diagrams for the corrosion of α-brass in 1 M HNO3 with and without various doses of PEG at 25oC.
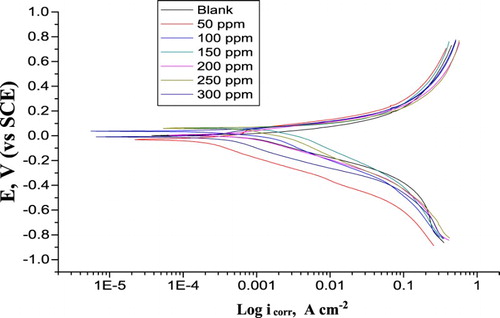
Table 1. Data from PP of α-brass in 1 M HNO3 including various doses of PEG at 25OC.
The results in revealed that there is a small change in the values of cathodic and anodic reactions by adding various doses of PEG, meaning that the addition of PEG lower the anodic dissolution of α-brass and also impedes the cathodic reactions. In the presence of PEG, Ecorr was improved with no certain trend, indicating that PEG acts as a mixed-kind inhibitor in 1 M HNO3. The icorr lowered clearly after the adding of PEG in 1 M HNO3 and % IE rises with increasing the PEG doses. % IE and the (θ) can be obtained from Equation (5):(5) where icorr and icorr(inh) are the corrosion current densities without and with PEG, correspondingly. As indicated from , (i) the exchange in βc values among the inhibitor-containing systems and the blank are higher than that of βa, which designates that PEG but mainly inhibits cathodic reactions, even though anodic dissolution of α-brass is also protected (mixed-type one) and (ii) the icorr data decreased by the addition of PEG. Thus increasing PEG doses lowers the dissolution of α-brass and retards the cathodic. Thus the adsorbed PEG acts by simple hindering of the active center for both cathodic and anodic centers. Other words, PEG decreased the surface area available for anodic dissolution and oxygen reduction reactions.
3.2. Impedance tests
displays the Nyquist diagrams obtained for the α-brass in 1 M HNO3 with and without various doses of PEG at 25°C. As the PEG dose increases, the semicircle diameter improves. The deviation from ideal semicircle was generally attributed to the frequency dispersion as well as to the inhomogeneities of the surface (
Citation43). EIS data of the examined PEG were measured utilizing the equivalent circuit, , which signifies a single charge transfer reaction and fits well with our experimental data. The constant phase element, CPE, is presented in the circuit in its place of a pure double layer capacitor to provide a more accurate fit (
Citation44). The Cdl for a circuit excluding a CPE parameter (Y0 and n) was measured from Equation (6) (
Citation45):(6) where Y0 is the magnitude of the CPE; ω = 2πfmax, fmax is the frequency maximum. The semicircle diameter signifies the Rct, corresponding to the polarization resistance, Rp, and inversely proportional to the icorr data. Rise in Rct was due to rise in the thickness of the double layer that adsorbed by molecules of PEG (
Citation46). In addition, the value of the Cdl was lowered by increasing PEG dose. Furthermore, Cdl can be measured from Equation (7):
(7) where ε is the dielectric double-layer constant, εo the permittivity vacuum electrical, and δ the thickness double layer. Mainly, the lower value of Cdl was due to the replacement of the adsorbed water molecules at the α-brass surface by the PEG molecules having lower dielectric constant. The EIS parameters were recorded in . The IE and θ were measured from the Rct data from Equation (4).
Figure 2. EIS Nyquist diagrams for α-brass in 1 M HNO3 with and without different doses of PEG 25oC.
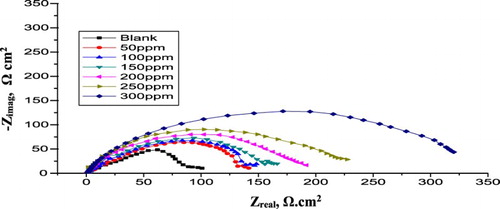
Figure 3. Circuit equivalent utilized to EIS data.
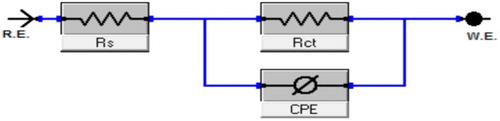
Table 2. Parameters obtained from EIS test for α-brass in 1 M HNO3 and in the presence of various doses of PEG at 25oC.
3.3. EFM tests
The advantages of EFM are: (i) nondestructive test, (ii) presence of causality factors which help as an inner check on the strength of EFM test, and (iii) directly given the icorr data without prior information of βa and βc this makes it an ideal applicant for online corrosion checking ( Citation47).
displays the EFM spectra of α-brass in nitric acid solution enclosing various doses of PEG. Each spectrum is a current reply as a function of frequency ( Citation48). The greater peaks were utilized to measure EFM parameters, which is recorded in . The %IEEFM and θ rise by improving the PEG dose were measured from Equation (5).
Figure 4. EFM spectra for α-brass in 1 M HNO3 with and without unlike doses of PEG at 25oC.
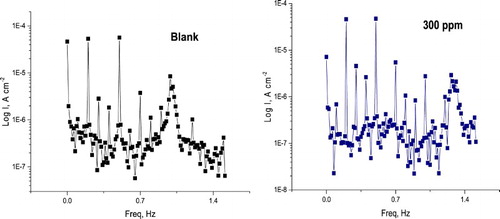
Table 3. Parameters obtained by EFM test for α-brass with and without various doses of PEG in 1 M HNO3 at 25oC.
3.4. MR measurements
The MR of the α-brass specimen in 1 M HNO3 solution with and without various doses from the PEG was measured after 3 hours of dipping at 25 ±1°C. signifies this for PEG. Obtained values of %IE and θ were given in at different doses from the PEG. The detected protection action of PEG could be qualified to the adsorption on the α-brass surface ( Citation49). The data obtained displayed that the appending of PEG decreased the WL (mg cm−2) and the C.R. (mg cm−2 min−1). The (%IE) and (θ) of PEG for the corrosion of α-brass were measured from Equation (2).
Figure 5. MR-time diagrams for the dissolution of α-brass with and without various doses of PEG at 25oC.
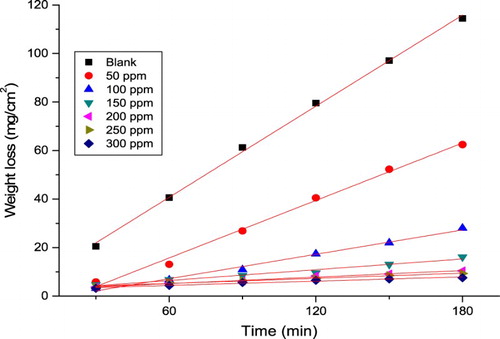
Table 4. % IE of PEG at 180 min for α-brass in 1 M HNO3 solution with and without different doses as determined from MR method at 25°C.
3.5. Effect of temperature
It was found that the IE decreases with raising temperature but at lower rate than in unprotected solutions with increasing the dose of the PEG, as exposed in . The values of this table illustrate that the adsorption decreases with an increasing in temperature, and corrosion rate (kcorr) increases. Indicating that raising of temperature leads to the reduction of the PEG adsorption and then accelerate the dissolution process, so the adsorption behavior of PEG on the α-brass surface in 1 M HNO3 occurs through physical adsorption. The decrease of % IE with increasing the temperature an indication for the physical adsorption.
Table 5. Values of %IE, (θ) and kcorr from MR measurements for α-brass corrosion after180 min immersion in1 M HNO3 with and without various doses of PEG at different temperatures.
3.6. Kinetic–thermodynamic corrosion parameters
The energy of activation () of the corrosion procedure was measured utilizing Arrhenius equation (8) (
Citation50):
(8) where A is Arrhenius constant and
is the data of activation energy. The values of
can be obtained from the slope of the straight lines of drawing log kcorr vs. 1/T with and without various doses of PEG at various temperatures (). shows the linear regression (R2) is close to 1, which indicates that the corrosion of α-brass in 1 M HNO3 solution can be explained by utilizing the kinetic model (). The effective (
) displays greater data in the presence of PEG than in its absence. Therefore, PEG delays the corrosion procedure at minor temperatures but this protection action is lowered at upper temperature. Also, an increase in
with the presence of PEG designates that the energy barrier for the corrosion reaction was improved. Since these values of
> 40 kJ mol–1, the metal dissolution reaction is diffusion controlled. The activation in the blocking of the active sites must be associated with a rise in the (
) of α-brass corrosion in the inhibited state (
Citation51). The
for the corrosion of α-brass in 1 M HNO3 was found to be 32 kJ mol−1, which is in best agreement with the work accepted by Fouda et al. (
Citation52) and others (
Citation53). Enthalpy and entropy of activation (ΔH*, ΔS*) are measured from transition state theory utilizing Equation (9):
(9) where h is Planck’s constant. displays diagrams of log (kcorr/T) vs. (1/T). Straight lines were obtained with linear regression (R2) close to unity from which the data of ΔH* and ΔS* were measured and also recorded in .
Figure 6. Arrhenius diagrams (log kcorr vs. 1/T) for α-brass in 1 M HNO3 with and without different doses of PEG.
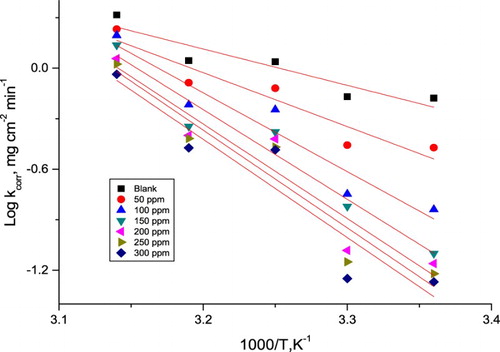
Figure 7. Plots of (log kcorr/T) vs. 1/T for the dissolution of α-brass in 1 M HNO3 with and without different doses of PEG.
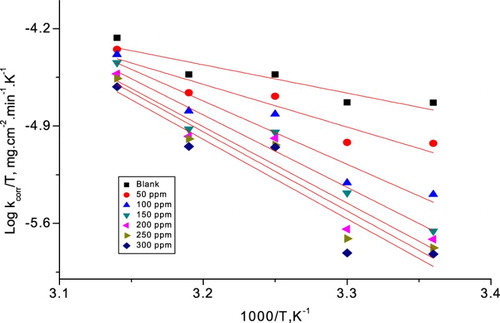
Table 6. Activation parameters for α-brass corrosion in 1 M HNO3 with and without different doses of PEG.
In , the negative values of ΔH* indicates that the dissolution process at the activated state is exothermic (Citation54). The rise in the (ΔH*) in the presence of the PEG means that the rise in the height of the energy barrier of the corrosion reaction to an extent relies on the dose of PEG. The adsorption of PEG on the metal surface leads to a reduction in kcorr because of the blocking of the surface of the metal by adsorbed molecules of the PEG. The data of ΔS* with and without PEG are small and negative sign; this specifies that the activated complex in the rate-determining step prefer association rather than dissociation step, meaning that a lowering in disordering occurred upon going from reactants to the activated complex (Citation55, Citation56).
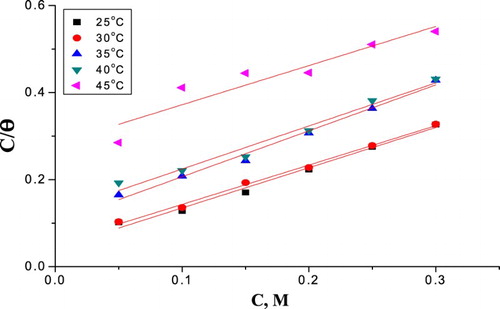
3.7. Adsorption isotherms
Adsorption isotherms were done to fit (θ) values to various adsorption isotherms (
Citation57, Citation58). The Langmuir adsorption isotherm (
Citation59) was found to fit well the investigated data.(11) where Kads is constant adsorption equilibrium. A plot of
against C gives straight lines with slope of approximately equal unity and the intercept is equal
. In order to get a comparative view, the variation of the adsorption equilibrium constant (Kads) of the inhibitor with its molar dose was measured according to Equation (11). The obtained values give best diagrams fitting for the practical adsorption isotherm.
Equation (12) could be used to calculate the free energy of adsorption (ΔGo
ads):(12) where 55.5 is the molar dose of water in the bulk solution in mol L−1. We can measure other thermodynamic parameters such as heat of adsorption (ΔHo
ads) and the standard entropy (ΔSo
ads) by drawing
in () conferring to the thermodynamic basic equations (13, 14).
(13)
(14)
Figure 8. Diagrams fitting of corrosion data for α-brass in 1 M HNO3 with and without different doses of PEG to the Langmuir adsorption isotherm at 25oC.
The data of thermodynamic parameters for the adsorption of PEG from Langmuir isotherm were measured at 25–45°C and were verified in , which can provide appreciated material about the mechanism of corrosion protection. As the absolute data of ΔH°ads obtained in this study were lower than 80 kJ mol−1, this is suggestive of physical adsorption ( Citation55, Citation60) ().
Figure 9. Plots of vs.
for the adsorption of PEG on α-brass in 1 M HNO3.
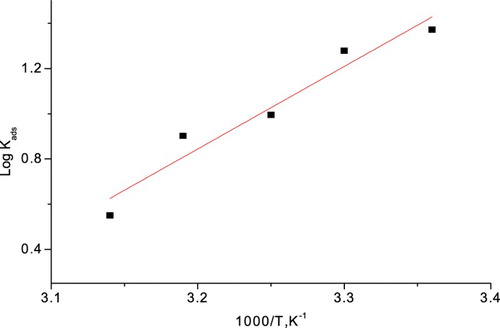
Table 7. Thermodynamic parameters from Langmuir isotherm model for α-brass in 1 M HNO3 for PEG at different temperatures.
The measured data of ΔGo ads are around 14–18 kJ mol−1 and the absolute data of ΔH°ads obtained in this study were less than 80 kJ mol−1, which represents that the adsorption is physisorption. The entropy of adsorption obtained is large and negative because PEG molecules cannot be freely moving in the bulk solution, and were adsorbed in an orderly manner onto the α-brass, resulting in a decrease in entropy ( Citation61). Moreover, from thermodynamic principles, since the adsorption was an exothermic process, it must be accompanied by a lower entropy ( Citation62). Also, this is confirmed from the PEG compared with its absence. The higher values of Kads for PEG indicate stronger adsorption on the α-brass surface in 1 M HNO3 solution.
3.8. Surface tests
3.8.1. SEM test
signifies the micrograph of α-brass samples before and after dipping in1 M HNO3 for 1 day. It is clear that α-brass alloy surfaces suffer from severe decomposition attack ((b)). (c) represents the surface of α-brass alloy after coming in contact with 1 M HNO3 solution, including 300 ppm PEG. It is significant to stress out that when the composite is present in the solution, the morphology of α-brass alloy surfaces is quite unlike from the preceding one, the picture of the surface was smoother, due to the adsorbed formed film on the α-brass alloy.
Figure 10. SEM portraits of α-brass surface: (a) polished α-brass before of inundation in 1 M HNO3, (b) after 24 h of inundation in 1 M HNO3 and (C) after 24 h of inundation in 1 M HNO3+ 300 ppm PEG.
3.8.2. AFM analysis
AFM is a dynamic tool to inspect the surface morphology from nano to microscale. The 2D and 3D AFM pictures of polished α-brass, α-brass immersed in 1 M HNO3 after 24 h and α-brass immersed in 1M HNO3+ 300 ppm PEG after 24h, are presented in (a–c). As can be seen from the AFM images, the surface is very clear for polished α-brass ((a)), whereas in α-brass dipped in 1 M HNO3 ((b)), the surface is severely scratched by the corrosive solution. In ((c)), the surface is inhibited from attack by the adsorbed layer formed by the PEG molecules. AFM data for α-brass are given in .
Figure 11. 2D and 3D AFM of α-brass: (a) polished α-brass before of inundation in 1 M HNO3, (b) after 24 h of inundation in 1 M HNO3 and (C) after 24 h of inundation in 1 M HNO3+ 3 00 ppm PEG.
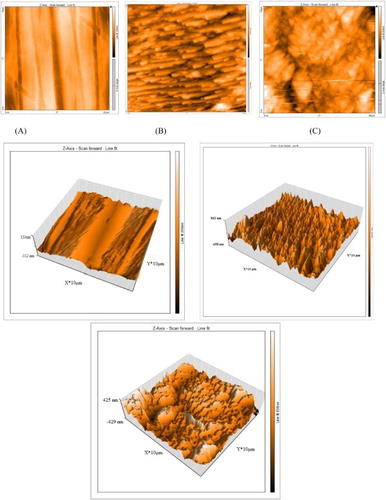
Table 8. Data obtained from AFM test.
3.8.3 FT-IR analysis
The FT-IR spectrum of pure PEG solution is shown in (a). The broad absorption peak at 3332 cm−1 shows OH stretching vibration. The FT-IR spectrum of the film formed on the surface of the α-brass after dipping in solution containing 300 ppm of PEG is shown in (b), the OH stretching frequency appeared at 3356 cm−1. This change is instigating by the electron cloud density from the O atom to α-brass. This recommends that the O atom of the PEG is coordinated to α-brass , resulting in the creation of adsorbed layer on the α-brass surface. The peak at 1652 cm−1 is C–C stretching of alkene non-conjugated on the surface film that increased from 1633 cm−1 of pure PEG.
Figure 12. FT-IR spectra of (a) pure PEG, (b) surface film formation.
4. Conclusion
PEG is good corrosion protection for α-brass in 1 M HNO3 solution. The adsorption of PEG depends on its doses, temperatures, and the nature of the drug and metal. EFM can be utilized as a fast and nondestructive test for corrosion analysis without prior information of Tafel slopes. The EIS results exposed that a rise in the Rct and a lower in Cdl when added PEG and hence an improve in %IE. This is due to rise of the thickness of the electrical double layer. The outcome data obtained from PP designated that the PEG is a mixed-kind inhibitor. The adsorption of PEG on surface of α-brass follows the Langmuir isotherm model. The results of the SEM and AFM studied showed that the surface smoothness increases in the existence of PEG due to the formation of a protective surface film. The results obtained from and non-electrochemical tests were in excellent agreement.
Disclosure statement
No potential conflict of interest was reported by the authors.
Notes on contributors
A.S. Fouda is a professor of physical chemistry since 1988. He got his D.SC. in electrochemistry 2013. He published more than 400 papers in international journals in electrochemistry. He is in the advisory board of many journals.
F.I. El-Dossoki is a professor of physical chemistry since 2007. He published many papers in the field of solution chemistry.
I.A. Shady is a student of M.Sc. Degree in electrochemistry.
ORCID
A.S. Fouda http://orcid.org/0000-0003-1325-8361
Related Research Data
References
- Schweinsberg, D.P.; George, G.A.; Nanayakkara, A.K.; Steinert, D.A. The protective action of epoxy resins and curing agents—inhibitive effects on the aqueous acid corrosion of iron and steel. Corros. Sci. 1988, 28 (1), 33–42. doi: 10.1016/0010-938X(88)90004-2
- Rozenfeld, I.L. Corrosion inhibition of thiourea and thiadiazole derivatives; McGraw-Hill Inc: NY, USA, 1981; pp 97–138.
- Benali, O.; Larabi, L.; Traisnel, M.; Gengembre, L.; Harek, Y. Electrochemical, theoretical and XPS studies of 2-mercapto-1-methylimidazole adsorption on carbon steel in 1 M HClO4. Appl. Surf. Sci. 2007, 253, 6130–6139. doi: 10.1016/j.apsusc.2007.01.075
- Merah, S.; Larabi, L.; Benali, O.; Harek, Y. Green corrosion inhibitor: inhibitive action of aqueous extract of Anacyclus pyrethrum L. for the corrosion of mild steel in 0.5 M H2SO4. Pigm. Resin. Technol. 2008, 37 (5), 291–298. doi: 10.1108/03699420810901963
- Benali, O.; Larabi, L.; Harek, Y. Inhibitive action of Argan Press cake extract on the corrosion of steel in acidic media. J. Appl. Electrochem. 2009, 39, 769–778. doi: 10.1007/s10800-008-9717-x
- Benali, O.; Larabi, L.; Harek, Y. Influence of the 2-Mercapto-1-Methyl Imidazole (MMI) on the corrosion inhibition of mild steel in 5% HCl. J. Saud. Chem. Soc. 2010, 14 (2), 231–235. doi: 10.1016/j.jscs.2010.02.020
- Benali, O.; Larabi, L.; Tabti, B.; Harek, Y. Influence of the Methylene Blue Dye (MBD) on the corrosion inhibition of mild steel in 0.5 M sulphuric acid, Part I: weight loss and electrochemical studies. Anti-Corros. Meth. Mat. 2005, 52, 280–285. doi: 10.1108/00035590510615776
- Benali, O.; Larabi, L.; Mekelleche, S.M.; Harek, Y. Influence of the 2-Mercapto-1-Methyl Imidazole (MMI) on the corrosion inhibition of mild steel in 5% HCl. J. Mater. Sci. 2006, 41, 7064–7073. doi: 10.1007/s10853-006-0942-6
- Eddy, N.O. Inhibitive and adsorption properties of ethanol extract of Colocasia esculenta leaves for the corrosion of mild steel in H2SO4. Int. J. Phys. Sci. 2009, 4 (4), 165–171.
- Bouyanzer, A.; Hammouti, B. Corrosion inhibition of aqueous extract of Cocos nucifera—coconut palm—petiole extract from destructive distillation for the corrosion of mild steel in acidic medium. Pigment and Resin Tech. 2004, 33 (5), 287–292. doi: 10.1108/03699420410560489
- Eddy, N.O.; Ekwumemgbo, P.; Odoemelam, S.A. Inhibition of the corrosion of mild steel in H2SO4 by 5-amino-1-cyclopropyl-7-[(3R, 5S)3, 5-dimethylpiperazin-1-YL]-6, 8-difluoro-4-oxo-uinoline- 3-carboxylic acid (ACPDQC). Int. J. Phys. Sci. 2008, 3 (11), 275–280.
- Eddy, N.O.; Odoemelam, S.A.; Akpanudoh, N.W. Inhibition of the corrosion of zinc in 0.01–0.04 M H2SO4 by erythromycin. Res. J. Pure Appl. Sci. 2008, 4 (12), 1963–1970.
- Eddy, N.O.; Odoemelam, S.A. Adsorption and inhibitive properties of clarithromycin for the corrosion of Zn in 0.01 to 0.05 M H2SO4. J. Pure Appl. Chem. 2008, 2 (12), 132–138.
- Ahamad, I.; Quraishi, M.A. Mebendazole: new and efficient corrosion inhibitor for mild steel in acid medium. Corrosion Sci. 2010, 52 (2), 651–656. doi: 10.1016/j.corsci.2009.10.012
- Quraishi, M.A.; Shukla, J. A new and effective corrosion inhibitor for mild steel in hydrochloric acid. Mater. Chem. Phys. 2009, 113 (2) 685–689. doi: 10.1016/j.matchemphys.2008.08.028
- Kadajji, V.G.; Betageri, G.V. Water soluble polymers for pharmaceutical applications. Polymers. 2011, 3, 1972–2009. doi: 10.3390/polym3041972
- Hassan, R.M.; Zaafarany, I.A. Kinetics of corrosion inhibition of aluminum in acidic media by water-soluble natural polymeric pectates as anionic polyelectrolyte inhibitors. Materials. 2013, 6, 2436–2451. doi: 10.3390/ma6062436
- Assouli, B.; Ait Chikh, Z.A.; Idrissi, H.; Srhiri, A. Electrosynthesis of adherent poly(2-mercaptobenzimidazole) films on brass prepared in nonaqueous solvents. Polymer 2001, 3, 2449–2454. doi: 10.1016/S0032-3861(00)00578-4
- Yabuki, A.; Nishisaka, T. Self-healing capability of porous polymer film with corrosion inhibitor inserted for corrosion protection. Corros. Sci. 2011, 53, 4118–4123. doi: 10.1016/j.corsci.2011.08.022
- Chen, Y-H.; Wu, G-W.; He, J-L. Antimicrobial brass coatings prepared on poly(ethylene terephthalate) textile by high power impulse magnetron sputtering. Corros. Sci. 2015, 1, 41–47.
- Chetouani, A.; Medjahed, K.; Benabadji, K.E.; Hammouti, B.; Kertit, S.; Mansri, A. Poly(4-vinylpyridine isopentyl bromide) as inhibitor for corrosion of pure iron in molar sulphuric acid. Prog. Org. Coat. 2003, 46, 312–316. doi: 10.1016/S0300-9440(03)00019-5
- Muller, B.; orster, I.F.; Kl ager, W. Corrosion inhibition of zinc pigments in aqueous alkaline media by polymers. Prog. Org. Coat. 1997, 31, 229–233. doi: 10.1016/S0300-9440(97)00042-8
- Dhawan, S.K.; Trivedi, D.C. Prevention of corrosion of iron in acidic media using poly (o-methoxy-aniline). Electrochim. Acta. 1994, 39, 831–837. doi: 10.1016/0013-4686(94)80032-4
- El-Sayed, Prev. A. A study of the inhibiting action of some polymers on the corrosion of iron in acidic media. Corros Control. 1996, 43, 27–34.
- Guilminot, E.; Rameau, J.J.; Delard, F.; Degrigny, C.; Hiron, X. Benzotriazole as inhibitor for copper with and without corrosion products in aqueous polyethylene glycol. J. Appl. Electrochem. 2000, 30, 21–28. doi: 10.1023/A:1003400516421
- Guilminot, E.; Delard, F.; Degrigny, C. Mechanism of iron corrosion in water-polyethylene glycol (peg 400) mixtures. Corros. Sci. 2002, 44, 2199–2208. doi: 10.1016/S0010-938X(02)00010-0
- Dobryszycki, J.; Biallozor, S. On some organic inhibitors of zinc corrosion in alkaline media. Corros. Sci. 2001, 43, 1309–1319. doi: 10.1016/S0010-938X(00)00155-4
- Khairou, K.S.; El-Sayed, A. Inhibition effect of some polymers on the corrosion of cadmium in a hydrochloric acid solution. J. Appl. Polym. Sci. 2003, 88, 866–871. doi: 10.1002/app.11663
- Ashassi-Sorkhabi, H.; Ghalebsaz-Jeddi, N. Inhibition effect of polyethylene glycol on the corrosion of carbon steel in sulphuric acid. Mater. Chem. Phys. 2005, 92, 480–486. doi: 10.1016/j.matchemphys.2005.01.059
- Hassan, S.M.; Baghlaf, A.O.; Altorkistani, M.A. A.O. The inhibition action of some polyethylene glycols on aluminum corrosion by hydrochloric acid solution. Trans. Egypt. Soc. Chem. Eng. 1986, 12, 63–77.
- Abd El-Wanees, S.; Abd El-Aal, A.; Abd El-Aal, E.E. Effect of polyethylene glycol on pitting corrosion of cadmium in alkaline solution. Br. Corros. 1993, 28, 222–226. doi: 10.1179/000705993798318597
- Oun, A.M. Corrosion inhibition of zinc-plated steel in 0.5, 1 and 1.5 M sulphuric acid by poly (ethylene glycol). Polym. Adv. Technol. 1995, 6, 100–103. doi: 10.1002/pat.1995.220060207
- Zeng, D.; Yan, H. Experimental study on a new corrosion and scale inhibitor. J. Env. Prot. 2013, 4, 671–675. doi: 10.4236/jep.2013.47077
- ELbakri, M.; Touir, R.; Ebn Touhami, M.; Srhiri, A.; Benmessaoud, M. Electrosynthesis of adherent poly (3-amino-1,2,4-triazole) films on brass prepared in nonaqueous solvents. Corros. Sci. 2008, 50, 1538–1545. doi: 10.1016/j.corsci.2008.02.014
- Abd-Elaal, Ali A.; Shaban, Samy M.; Tawfik, Salah M. Three Gemini cationic surfactants based on polyethylene glycol as effective corrosion inhibitor for mild steel in acidic environment. Corros. Sci. 2017, 4, 2422–2429.
- Ashassi-Sorkhabi, H.; Ghalebsaz-Jeddi, N. Inhibition effect of polyethylene glycol on the corrosion of carbon steel in sulphuric acid. Chem. Phys. 2005, 92, 480–486.
- Gomma, G.K. Effect of azole compounds on corrosion of copper in acid medium. Mater. Chem. Phys. 1998, 56 (1), 27–34. doi: 10.1016/S0254-0584(98)00086-8
- Ma, H.; Chen, S.; Niu, L.; Zhao, S.; Li, S.; Li, D. J. Appl. Electrochem. 2002, 32, (1) 65–72. doi: 10.1023/A:1014242112512
- Bosch, R.W.; Hubrecht, J.; Bogaerts, W.F.; Syrett, B.C. Electrochemical frequency modulation: a new electrochemical technique for online corrosion monitoring. Corrosion. 2001, 57 (1), 60–70. doi: 10.5006/1.3290331
- Abdel-Rehim, S.S.; Khaled, K.F.; Abd-Elshafi, N.S. Electrochemical frequency modulation as a new technique for monitoring corrosion inhibition of iron in acid media by new thiourea derivative. Electrochim. Acta. 2006, 51, 3269–3277. doi: 10.1016/j.electacta.2005.09.018
- Schumacher, R., Muller, A., Stockel, W. An in situ study on the mechanism of the electrochemical dissolution of copper in oxygenated sulphuric acid: An application on the quartz microbalance. J. Electroanal. Chem. 1987, 219 (1), 311–317. doi: 10.1016/0022-0728(87)85048-9
- Smyrl , W.H.; Bockris, J.O.M.; Conway, B.E., Yeager, E.; White, R.E., Eds. Comprehensive Treatise of Electrochemistry;Plenum Press: New York, 1981; p 116
- El Achouri, M.; Kertit, S.; Gouttaya, H.M.; Nciri, B.; Bensouda, Y.; Pere, L.; Infante, M.R.; Elkacemi, K. Corrosion inhibition of iron in 1 M HCl by some gemini surfactants in the series of alkanediyl-α,ω-bis-(dimethyl tetradecyl ammonium bromide). Prog. Org. Coat. 2001, 43 (4), 267–273. doi: 10.1016/S0300-9440(01)00208-9
- Fouda, A.S.; El-Dessoki, F.I.; Shady, I.A. In Impedance Spectroscopy - Emphasizing solid materials and systems. In Fundamentals of Impedance Spectroscopy: Macdonald, J.R., Johanson, W.B., Macdonald, J.R., Eds.;John Wiley & Sons: New York, 1987; pp 1–26.
- Mertens, S.F.; Xhoffer, C.; Decooman, B.C.; Temmerman, E. Short-term deterioration of polymer-coated 55% Al–Zn—Part 1: behavior of thin polymer films. Corrosion. 1997, 53, 381–388. doi: 10.5006/1.3280481
- Lagrenée, M.; Mernari, B.; Bouanis, M.; Traisnel, M.; Bentiss, F. Study of the mechanism and inhibiting efficiency of 3,5-bis(4-methylthiophenyl)-4H-1,2,4-triazole on mild steel corrosion in acidic media. Corros. Sci. 2002, 44 (3), 573–588. doi: 10.1016/S0010-938X(01)00075-0
- Bentiss, F.; Lagrenée, M.; Traisnel, M. 2,5-Bis(n-Pyridyl)-1,3,4-oxadiazoles as corrosion inhibitors for mild steel in acidic media. Corros. Sci. 2000, 56 (7), 733–742. doi: 10.5006/1.3280577
- Kus, E.; Mansfeld, F. An evaluation of the electrochemical frequency modulation (EFM) technique. Corros. Sci. 2006, 48 (4), 965–979. doi: 10.1016/j.corsci.2005.02.023
- Zhang, D.Q.; Cai, Q.R.; He, X.M.; Gao, L.X.; Kim, G.S. Corrosion inhibition and adsorption behavior of methionine on copper in HCl and synergistic effect of zinc ions. Mater. Chem. Phys. 2009, 114 (2), 612–617. doi: 10.1016/j.matchemphys.2008.10.007
- Mansfeld, F., Ed. Corrosion Mechanisms;Marcel Dekker: New York, 1987; p 119
- Fouda, A.S.; Abd El-Aal, A.; Kandil, A.B. The effect of some phthalimide derivatives on corrosion behavior of copper in nitric acid. Corros. Sci. 2006, 201 (1), 216–223.
- Loto, Cleophas A.; Loto, Roland T. Inhibition effect of garlic extracts on the corrosion of alpha brass in nitric acid. Der pharma chemica. 2016, 8 (2), 162–171.
- Fiala, A.; Chibani, A.; Darchen, A.; Boulkamh, A.; Djebbar, K. Investigations of the inhibition of copper corrosion in nitric acid solutions by ketene dithioacetal derivatives. Corros. Sci. 2007, 253 (24), 9347–9356.
- Arab, S.T.; Noor, E.A. Inhibition of acid corrosion of steel by some S-alkylisothiouronium Iodides. Corrosion. 1993, 49 (2), 122–129. doi: 10.5006/1.3299206
- Durnie, W.; Marco, R.D.; Jefferson, A.; Kinsella, B. Development of a structure–activity relationship for oil field corrosion inhibitors . J. Electrochem. Soc. 1999, 146, 1751–1756. doi: 10.1149/1.1391837
- Gomma, M.K.; Wahdan, M.H. Schiff bases as corrosion inhibitors for aluminium in hydrochloric acid solution. Mater. Chem. Phys. 1995, 39, 209–213 doi: 10.1016/0254-0584(94)01436-K
- Khamis, E. The effect of temperature on the acidic dissolution of steel in the presence of inhibitors. Corrosion. 1990, 46 (6), 476–484. doi: 10.5006/1.3585135
- Fouda, A.S; El-desoky, A.M.; Nabih, A. Inhibitive adsorption sysnergistic studies on copper corrosion in nitric acid solutions by some organic derivatives. Adv. Mater. Corros. 2013, 2, 1–15
- Frumkin, A.N. Electrocapillary curve of higher aliphatic acids and the state equation of the surface layer. Zeitschr. Phys. Chem. 1925, 116, 466–470.
- Fouda, A.S.; Mekkiaand, D.; Badr, A.H. Extract of camellia sinensis as green inhibitor for the corrosion of mild steel in aqueous solution. J. Korean Chem. Soc. 2013, 57 (2), 264–271. doi: 10.5012/jkcs.2013.57.2.264
- Li, X.; Mu, G., Tween-40 as corrosion inhibitor for cold rolled steel in sulphuric acid: Weight loss study, electrochemical characterization, and AFM. Appl. Surface Sci. 2005, 252 (5), 1254–1265. doi: 10.1016/j.apsusc.2005.02.118
- Mu, G.; Li, X.; Liu, G. Synergistic inhibition between Tween 60 and NaCl on the corrosion of cold rolled steel in 0.5 M sulfuric acid. Corros. Sci. 2005, 47 (8), 1932–1952. doi: 10.1016/j.corsci.2004.09.020