
ABSTRACT
Manganese oxide nanocomposite (Mn2O3/Mn3O4) was prepared by sol-gel technique and used as an adsorbent. Fourier Transform Infrared (FTIR) spectroscopy, X-ray diffraction (XRD), and Field Emission Scanning Electron Microscopy (FE-SEM) were used to characterize the adsorbent. The response surface methodology (RSM) was employed to evaluate the effects of solution pH, initial Fe (III) ions concentration, adsorbent weight, and contact time on the removal ratio of the Fe (III) ions. A total of 27 adsorption experimental runs were carried out employing the detailed conditions designed based on the Box-Behnken design (BBD). Results showed that the pH of the solution and initial Fe (III) ions concentration were the most significant parameters for Fe (III) ions removal. In process optimization, the maximal value of the removal ratio of Fe (III) was achieved as 95.80%. Moreover, the corresponding optimal parameters of adsorption process were as: contact time = 62.5 min, initial Fe (III) concentration = 50 mg/L, adsorbent weight = 0.5 g, and pH = 5. The experimental confirmation tests showed a strong correlation between the predicted and experimental responses (R2 = 0.9803). The fitness of equilibrium data to common isotherm equations such as Langmuir, Freundlich, and Temkin were also tested. The sorption isotherm of adsorbent was best described by the Langmuir model. The kinetic data were analyzed using pseudo-first-order, pseudo-second-order, intraparticle diffusion, and Elovich kinetic models. The adsorption kinetics of Fe (III) ions were well fitted with the pseudo-second-order kinetic model.
GRAPHICAL ABSTRACT
1. Introduction
Today, adsorption is used as one of the most promising methods in removal process of heavy metal ions because of its high efficiency, easy handling, and the effectiveness of various adsorbents ( Citation1, Citation2). Liquid-solid adsorption systems are based on the ability of certain solids to preferentially concentrate specific substances from solutions onto their surfaces. Metal oxide nanoparticles, often characterized by a significant amount of surfaces and high capacity, are among the promising adsorbents for heavy metals removal because of their unique properties and potential applications ( Citation3–5). It is well known that heavy metals have toxic or harmful effects on many forms of life. Iron in the environment enters to water through from steel tempering, coal coking, and mining industries ( Citation6, Citation7). Iron toxicity can cause anorexia, shock, and oliguria. Iron overdose known as hemochromatosis is caused by a gene that enhances iron absorption in the body ( Citation8). Iron accumulates over time in the liver, bone marrow, pancreas, skin, and testicles. Accumulation of iron in these organs causes them to functions poorly ( Citation9, Citation10).
The aim of this work is the synthesis of manganese oxide nanocomposite (Mn2O3/Mn3O4) and its application for adsorption of Fe (III) ions. Nanoparticles were synthesized by sol-gel method and characterized by IR, SEM, and XRD. The important parameters that affect the adsorption were explored using the response surface methodology approach (RSM). RSM is a statistical and graphical technique that is useful in studying the interactions of two or more factors affecting the adsorption process and determining the optimum operating conditions for the system ( Citation11–14). The Box-Behnken design (BBD) of the RSM was employed to investigate the effects of significant factors that influenced the removal of Fe (III) ions from aqueous solution by Mn2O3/Mn3O4 nanocomposite and understand their impact on the process. Langmuir isotherm model was applied to fit equilibrium sorption data. The experimental data were analyzed using the pseudo-first-order, pseudo-second-order, intraparticle diffusion, and Elovich kinetic models.
2. Experimental section
2.1. Materials and methods
The chemicals used during this study such as Fe (NO3)3·9H2O, Mn (NO3)2·4H2O, NaOH, and HCl were purchased from the Merck and used as received without further purifications. The Fourier transform infrared (FTIR) analysis of the metal oxides used in this study was characterized by an FTIR apparatus (Perkin-Elmer Model System 2000 using KBr pellet method). In order to directly observe the surface morphology of the adsorbent, Field emission scanning electron microscopy (FE-SEM) (SIGMA VP-500, Germany) was employed in this study. The elemental information and structure of synthesized material were determined by an X-ray diffractometer (XRD) (X’Pert Pro, Analytical, Netherlands) at ambient temperature. N2 adsorption-desorption isotherm and the specific surface area of the particle were carried out on a Brunauer-Emmett-Teller (BET) surface area analyzer (Nova Station A, Quantachrome, America) for nitrogen adsorption. Fe (III) remaining unadsorbed in the supernatant liquid was determined with an Atomic Absorption Spectrometer (model Shimadzu, AA-7000).
2.2. Preparation of nanocomposite
In the laboratory, the manganese oxide nanocomposite was prepared by sol-gel method. First, 5 g desired metal salt (Mn (NO3)2·4H2O) was dissolved in 75 mL deionized water. Then, 1 M NaOH solution was added dropwise to the above mixture through the mechanical stirring at room temperature. When pH reached 13, the stirrer was turned off and the obtained solution was kept at room temperature for 24 h. After this time, the content was filtered off and washed several times to remove any NaOH with deionized water and the wet powders were dried at 70° for 18 h. The obtained dry powder was heated in a quartz tube furnace at 250° for 3 h and, finally, was calcinated at 600° for 3 h. Manganese ions were first reduced in alkaline aqueous to Mn(OH)2 and then decomposed into MnO. Eventually, MnO was oxidized to Mn3O4 at 250° (
Citation15, Citation16):As confirmed by earlier studies (
Citation17, Citation18), in the temperature range of 300–450°, Mn3O4
can be transformed into Mn5O8
. Next, Mn5O8 was reduced to Mn2O3 at 600°. The reactions scheme can be written as follows:
N2 adsorption-desorption isotherm of manganese oxide nanocomposite is presented in and the corresponding physicochemical properties including BET surface and average pore volume are shown in .
Figure 1. N2 adsorption-desorption isotherm of manganese oxide nanocomposite.
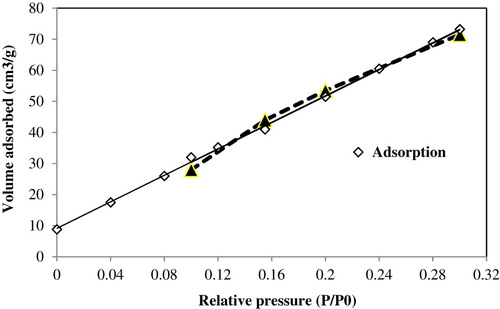
Table 1. Textural properties of manganese oxide nanocomposite.
2.3. Adsorption experiments
Adsorption experiments were performed by mixing a certain amount of adsorbent with 200 mL of the heavy metal solution of known pH and initial concentration. The suspensions were equilibrated by shaking for a desired period of time. The clear supernatants after filtration were analyzed for Fe (III) ions concentration using an atomic absorption spectrometer. The removal ratio of metal ions was calculated using the following equation:(1) where C0 (mg/L) and Ce (mg/L) are the initial and equilibrium concentrations of the adsorbate, respectively, and η is the removal ratio (in percent) of Fe (III) ions.
The amount of Fe (III) adsorbed per unit of adsorbent, qt (mg/g), was calculated according to mass balance on the iron concentration; Equation (2):(2) where V (L) is the volume of the solution, W (g) is the weight of adsorbent, and Ct (mg/L) is the concentration of the adsorbate at time t.
2.4. Design of experiments
Box-Behnken Design is one of the most efficient experimental designs among of other response surface designs, because of its ability to estimate the parameters of the quadratic polynomial model and detection of lack of fit of the model ( Citation19). A 3-level, 4-factor Box-Behnken Design was used to evaluate the effect of the selected parameters on the removal efficiency of Fe (III) ions from water by the adsorbent. Four parameters affecting heavy metal removal, namely solution pH (X1), initial Fe (III) concentration (X2), adsorbent weight (X3), and contact time (X4) were selected as independent variables, and the removal ratio (Y) of Fe (III) ions were considered as the dependent variable (the predicted response) ().
Table 2. Experimental range and coded levels of independent variables.
A regression quadratic polynomial model is described in Equation (3):(3) Where
is the constant coefficient,
,
, and
are the regression coefficients and
and
indicate the independent variables. Moreover,
represents the random error (
Citation20).
3. Results and discussion
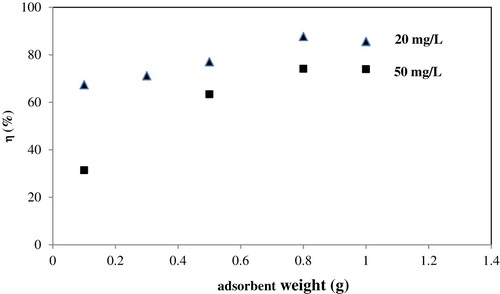
3.1. Effects of adsorbent weight and initial concentration at fixed contact time and pH
Adsorbent weight studies were carried out at room temperature, a pH of 3, and a fixed time (180 min) for two different adsorbate concentrations (minimum and maximum adsorbate concentrations 20 and 50 mg/L, respectively). It could be seen from the that the removal ratio increased gradually with increasing adsorbent weight to a maximum 0.9 g. After this maximum equilibrium value, the removal ratio did not increase with increasing adsorbent weight. These results suggest that the relationship between adsorbent weight and removal ratio was related to the increase in the number of adsorption sites and that increasing this number had no effect after equilibrium was reached. From the results, the minimum and maximum weights of adsorbent were determined as 0.1 g and 0.9 g, respectively. represents that sufficient adsorption sites are available at lower initial concentration, but at higher concentration, metal ions are greater than adsorption sites.
Figure 2. Effects of adsorbent weight and initial concentration for minimum and maximum concentrations of 20 and 50 mg/L, respectively, on removal ratio of Fe (III) ions at room temperature, pH = 3, and t = 180 min.
3.2. Effects of contact time and initial concentration at the fixed adsorbent weight and pH
represents the effects of contact time on the removal ratio of Fe (III) ions under different initial concentrations. As can be noticed, the removal ratio of Fe (III) ions increases with contact time and finally reaches an equilibrium state in approximately 120 min. From the results, the minimum and maximum contact times were determined as 5 and 120 min, respectively.
Figure 3. Effects of contact time and initial concentration on the removal ratio of Fe (III) ions at room temperature, pH = 3, and adsorbent weight = 0.9 g.
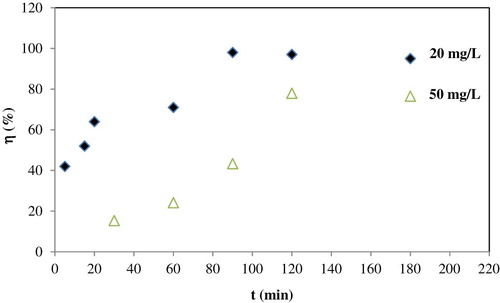
Contact time studies show that an increase in the concentration initial Fe (III) ions results in a decrease in the removal ratio. This result can be attributed to the fact that for a fixed adsorbent weight, the total available adsorption sites are limited. Thus, due to saturation of the adsorbate into the adsorbent and less of binding sites, with increasing initial Fe (III) ions concentration the removal ratio decreases.
3.3. Effect of pH at fixed contact time and adsorbent weight
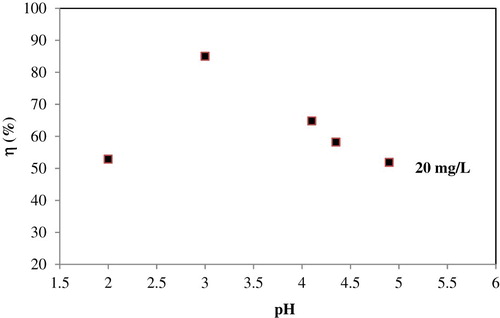
Effect of pH on the adsorption of Fe (III) ions was investigated at different pH values ranging from 2.0 to 5.0 (). The pH of the solution affects the surface charge of adsorbent. At low pH, H3O+ ions were adsorbed on the surface of adsorbent so that the net charge of adsorbent was positive and the removal ratio of Fe (III) was low. At higher pH, the adsorption of Fe (III) ions occurred through a co-operation of ion exchange and electrostatic interaction. Maximum adsorption was observed at about pH 3. With increasing pH values (up to 5) the adsorbent surface becomes more negative. Therefore, negatively charged Fe (III) species may be repelled by the negatively charged adsorbent surface functional groups, which result in a decrease in the removal ratio of Fe (III). At pH values higher than 5, Fe (III) precipitation occurred. Therefore, pH values higher than 5 were not investigated. In general, the results indicated that adsorption is highly pH dependent. Similar results were reported in the literature ( Citation3).
Figure 4. Effect of pH on the removal ratio of Fe (III) ions at room temperature, adsorbent weight = 0.9 g, and t = 120 min.
3.4. FT-IR spectroscopy
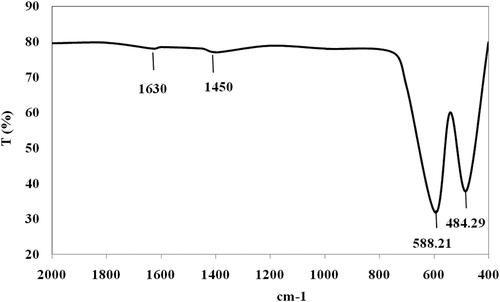
The FT-IR spectra of manganese oxide (Mn2O3/Mn3O4) nanocomposite is shown in . In the IR spectra of Mn2O3/Mn3O4, the stretching vibration bands located at 588 cm−1 correspond to the vibration of Mn-O in an octahedral environment, while the stretching vibration band located at 484 cm−1 can be attributed to the vibration of manganese species (Mn3+−O) in the octahedral site of Mn3O4. The stretching vibration band at 484 cm−1 confirmed the Mn2O3 ( Citation16, Citation21). Two weak absorption bands at 1450 and 1630 cm−1 are attributed to the water molecules adsorbed on the surface of nanoparticles.
Figure 5. FT-IR spectra of Mn2O3/Mn3O4 nanocomposite.
3.5. X-ray diffraction (XRD)
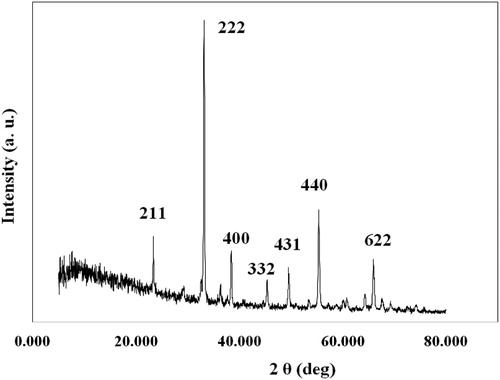
The crystalline structure of this nanoparticle was characterized by XRD. XRD patterns of manganese oxide nanocomposite (Mn2O3/Mn3O4) are shown in . The average crystallite sizes was calculated from the XRD line broadening using the Scherrer’s formula (d = 0.9 λ / β cosθ), where d is the crystallite size (nm), θ is the angle of incidence, λ is the wavelength of x-ray diffraction (λ = 1.5406 nm), and β is the full width at half maximum ( Citation22). The average crystallite sizes of the nanoparticle are about 48 nm measured from the peak appears at 2θ = 38.41° using the Debye Scherrer approximation. From , the peak positions at 2θ = 23.33, 33.14, 38.41, 45.34, 49.53, 55.35, and 65.93° confirmed the preparation of Mn2O3/Mn3O4 nanocomposite with a cubic structure, which is in accordance with those of the standard spectrum (No. 41-1442 and 24-0734). XRD results showed that the prepared nanoparticle is a well-crystalline material.
Figure 6. XRD patterns of Mn2O3/Mn3O4 nanocomposite.
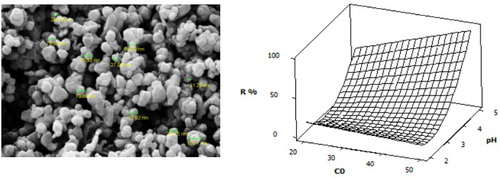
3.6. FE-SEM imaging of the adsorbent
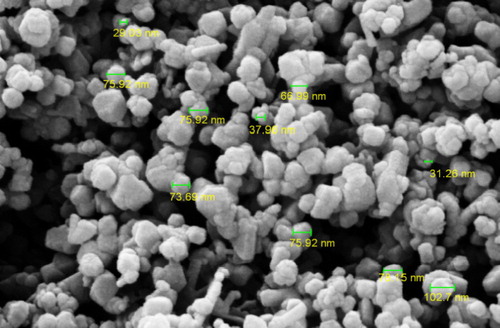
The morphology and the nature of the surface of adsorbent are presented by the FE-SEM image (). The FE-SEM image of Mn2O3/Mn3O4 nanocomposite shows several hundreds of nanoparticles. Aggregated nanoparticles with a diameter varying between 30 and 80 nm are observed in this figure. The FE-SEM image of Mn2O3/Mn3O4 nanocomposite confirmed the spherical or approximately spherical morphology of nanoparticles with a porous surface, which may be beneficial to metal ions diffusion and adsorption.
Figure 7. FE-SEM of adsorbent.
A microstructure measurement software was employed to determine mean diameter and statistical distribution of particle size by FE-SEM image ().
Figure 8. Particle size distribution of adsorbent by FE-SEM.
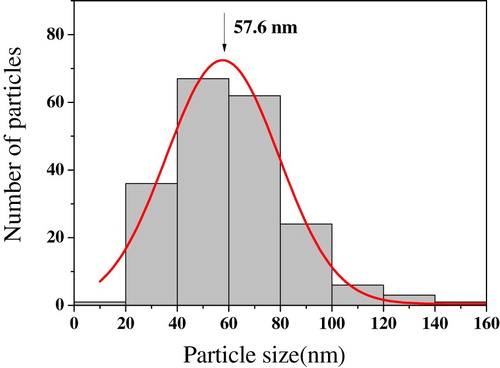
The mean diameters determined by FE-SEM and XRD are in good agreement.
3.7. Fitting model
The experimental values for each independent variable were chosen according to the results obtained from the preliminary analysis. The coded levels of independent variables (−1, 0, 1 for low, middle, and high values) and response values (removal ratio) based on the Box-Behnken Design using MINITAB software are shown in .
Table 3. Box-Behnken design matrix for four variables and response values.
A model that demonstrates the relationship between Fe (III) ions removal ratio and independent variables is given in Equation (4). The model is proposed based on the regression coefficients.(4) where Y is the predicted responses for the removal ratio of Fe (III) and A and B are the initial Fe (III) concentration and pH. The predicted value of removal ratio of Fe (III) obtained using Equation (4), i.e. 95.80, is close to the experimental value, i.e. 92.60, providing that the model is fully applicable. The results of analysis of variance (ANOVA) for the removal ratio of Fe (III) are shown in . The larger the value of F (41.31) and the smaller the value of P (<0.05) the more significant is the corresponding coefficient term (
Citation23). As can be seen from , all the p-values of A, B, B2, and AB are less than 0.05, suggesting that these variables are significant on the removal of Fe (III) ions. As shown in , the R2 value of 88.25 for Fe (III) ions removal model showed the almost well fitness of regression model for predicting the removal results. The close correspondence between R2
adj and R2 indicates that unnecessary variables have not been included. The ANOVA results showed that the pH of the solution and initial Fe (III) concentration were the most significant parameters for Fe (III) ions removal.
Table 4. ANOVA results for optimization of Fe (III) ions adsorption.
3.8. Determination of model adequacy
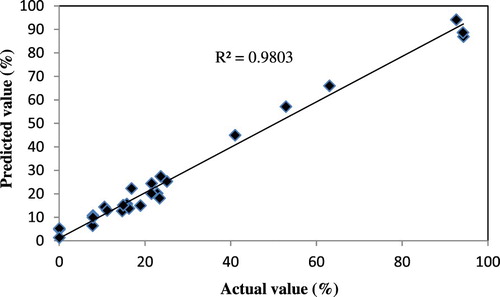
One of the key assumptions for the statistical analysis of data from experiments is that the data come from a normal distribution. represents predicted vs. actual values of removal ratio of Fe (III). The clustering of the points around the straight line indicates a good relationship between the experimental (actual) and the prediction values, confirming the robustness of the model.
Figure 9. Predicted vs. actual values of removal ratio of Fe (III).
3.9. Contour plot and response surfaces
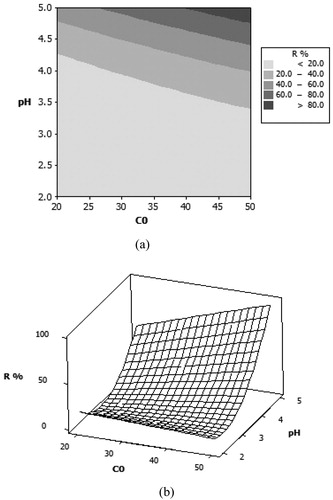
(a) shows a contour plot of the relationship between initial Fe (III) concentration and pH. It can be seen that at upper values of C0, maximum removal ratio occurs at higher values of pH. Therefore, there is an optimum at upper values of C0 and higher values of pH. The optimized conditions of the process determined by the software are pH = 5, initial adsorbate concentration = 50 mg/L, adsorbent weight = 0.5 g, and contact time = 62.5 min for a maximum removal ratio of 95.80%. The interaction between initial Fe (III) concentration and pH is presented by response surface plot (b). Response surfaces plots, obtained as a function of two factors maintaining all other factors constant, are helpful in understanding both the main effects and the interaction effects of these two factors ( Citation19, Citation24). It could be seen that an increase in pH value from 2 to 5 resulted in enhancing the removal ratio of Fe (III) ions from 10.5% to 95%. Therefore, pH of solution played an important role in the removal ratio of Fe (III) ions on adsorbent as was evident from the equation (coefficients in Equation 4) and plot.
Figure 10. (a) Contour plots and (b) response surface for Fe (III) ions adsorption at adsorbent weigh = 0.5 g and contact time = 62.5 min.
3.10. Adsorption equilibrium isotherm
Adsorption isotherm describes how the metal ions are distributed between the liquid and solid phases when the adsorption process reaches an equilibrium state, as their distribution manner is an important factor in determining the maximum sorption capacity.
3.10.1. Langmuir isotherm model
The linear equation of Langmuir isotherm model is expressed as follows:(5) where qm is the monolayer adsorption capacity of adsorbent (mg/g) and KL is the Langmuir adsorption constant related to the energy of adsorption (L/mg) (
Citation25); and .
Figure 11. Isotherm plot for the adsorption of Fe (III).
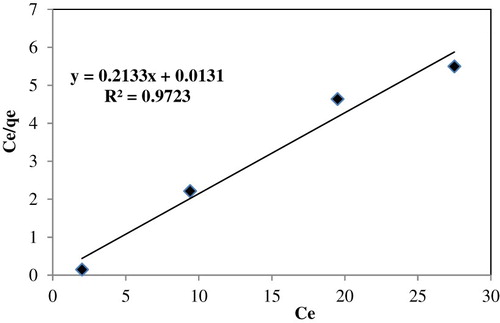
Table 5. Langmuir, Freundlich, and Temkin constants.
3.10.2. Freundlich isotherm model
The Freundlich equation is an empirical equation that is very useful as it accurately describes much adsorption data. The Freundlich isotherm (Van Bemmelen equation) is in the linearized form(6) where KF and n are Freundlich constants concerning the multilayer adsorption capacity and adsorption intensity, respectively ().
3.10.3. Temkin isotherm model
Temkin and Pyzhev (1940) considered the effect of the adsorbate interaction on adsorption and proposed the model known as the Temkin isotherm, which can be expressed as:
(7) Where KT (L/mg) is Tempkin isotherm energy constant, BT is Temkin isotherm constant related to the heat of sorption, R is the gas constant, and T is the temperature ().
It can be vividly seen from these results that the coefficients of determination (R2) were very high for three models above. The applicability of the three models to describe the adsorption process was further validated by the normalized standard deviation, Δqt (%), which is defined as:(8) where N is the number of data points and qt,exp and qt,cal (mg/g) are the experimental and calculated adsorption capacity, respectively. Based on the highest R2 values and the lowest Δqt values, the Langmuir model was, therefore, the most suitable equation to describe the adsorption isotherms of Fe (III) on Mn2O3/Mn3O4 nanocomposite prepared ().
3.11. Adsorption kinetics
Except for adsorption capacity, the kinetic performance of a given adsorbent is the base to determine the performance of fixed-bed or any other flow-through systems ( Citation26). Kinetic studies show the uptake rate of adsorbate, which controls the resident time of the whole adsorption process. The applicability of the pseudo-first-order ( Citation27), pseudo-second-order ( Citation28), intraparticle diffusion ( Citation29), and Elovich ( Citation30) models were tested for the adsorption of Fe (III) ions onto the adsorbent. Adsorption kinetics was studied by varying the time of reaction in an optimal amount of parameters.
3.11.1. The Pseudo-first-order kinetic model
The Lagergren rate equation is one of the most widely used adsorption rate equations for the adsorption of solute from a liquid solution. The pseudo-first-order kinetic model may be represented by Lagergren:(9) where qt is the amount of Fe (III) ions adsorbed (mg.g−1) at time t (min) and k1 is the rate constant of pseudo-first-order adsorption (min−1). The validity of the model can be checked by the linearized plot of ln (qe−qt) versus t. (
Citation31, Citation32); .
Table 6. Kinetic parameters.
3.11.2. The Pseudo second-order kinetic model
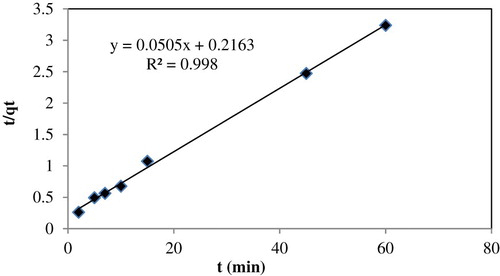
The Pseudo-second-order kinetic model is expressed as:(10) where the equilibrium adsorption capacity (qe), and the second order constant k2 (g. mg−1. min−1) can be determined experimentally from the slope and intercept of plot t/qt versus t (
Citation33); and .
Figure 12. Pseudo-second-order kinetic model.
3.11.3. Intraparticle diffusion kinetic model
The intraparticle diffusion model is applied to study the adsorption process, which is written as:(11) where kd is intraparticle diffusion rate constant (mg.g−1.min−1/2) (
Citation34, Citation35) and C is the intercept (mg/g) and it gives an idea of the thickness of the boundary layer.
3.11.4. Elovich kinetic model
The Elovich model equation is generally expressed as:(12) The plot of qt versus ln t should yield a linear relationship with a slop 1/β and an intercept of 1/β ln (αβ) (
Citation36). The initial adsorption rate α (mg. g−1. min−1), desorption constant β (g. mg−1), and coefficients of determination (R2) are given in .
According to the high correlation (R2 = 0.998 almost equal to unity) and low normalized standard deviation (Δqt (%) equal to 0.025), the adsorption of Fe (III) ions is best described by the pseudo-second-order kinetic model compared to other kinetic models. Besides, the calculated value (
) agree with experimental
value (
). These results suggested that the adsorption system studied obeys the pseudo-second-order kinetic model. This result is in accordance with the findings quoted by other researchers (
Citation3, Citation8, Citation9, Citation10).
A comparison of the removal ratio of Fe (III) ions for different adsorbents is given in . As can be seen, the removal ratio of Fe (III) ions is higher than that of reported adsorbents ( Citation3, Citation10, Citation37, Citation38). This result may be due to the effect of surface area, morphology, surface structure, and functional groups. Nonetheless, this comparison is not precise, since the experimental conditions are different.
Table 7. The removal ratio of Fe (III) ions by a different type of adsorbents.
Conclusion
In this research, manganese oxide nanocomposite (Mn2O3/Mn3O4) was synthesized by sol-gel method which is a simple and inexpensive technique in the preparation of nanoparticles. Mn2O3/Mn3O4 nanocomposite was characterized by IR, SEM, and XRD techniques and was used to remove Fe (III) from aqueous solutions. Experiments were conducted as a function of different adsorption parameters (pH of the solution, initial Fe (III) concentration, adsorbent weight, and contact time. RSM by BBD was used to evaluate the effects of four process factors on Fe (III) ions removal. The ANOVA results showed that the pH of the solution and initial Fe (III) concentration were the most significant parameters on the removal ratio Fe (III) ions. In the optimization process, the predicted maximum removal ratio of Fe (III) ions was achieved as 95.80% with a pH of 5, the adsorbent weight of 0.5 g, initial Fe (III) concentration of 50 mg/L, and a contact time of 62.5 min. Equilibrium studies showed that Fe (III) adsorption data follow the Langmuir model. The adsorption kinetic correlated very well with the pseudo-second-order equation. Therefore, it is expected that the Mn2O3/Mn3O4 nanocomposite with fine grain size (about 48 nm) can be used as one of the effective, convenient, and inexpensive adsorbents for the removal of heavy metals from aqueous solutions.
Acknowledgments
The authors thank the Golestan University for providing financial support for the work described in this paper.
Disclosure statement
No potential conflict of interest was reported by the authors.
Notes on contributors
Narges Samadani Langeroodi received the Ph.D. degree from Lomonosov Moscow State University, Russian, in 2007. From 2007 to 2018, she worked as assistant professor in department of chemistry at Golestan University. She is currently faculty member in department of chemistry at Golestan University, Iran. Her research interests include surface chemistry, adsorption and methods of reducing or eliminating of pollutants and hazardous materials from the water, kinetics, heterogeneous catalysts and nanoparticles.
Zhaleh Farhadravesh is MSc student at Golestan University, from 2016 to 2018. Her field of study is physical chemistry.
Aliakbar Dehno Khalaji received the Ph.D. degree from Isfahan University of Technology, Iran, in 2007. From 2007 to 2014, he worked as assistant professor in Department of Chemistry at Golestan University. He is currently an associated professor in Department of Chemistry at Golestan University. His research interests include Schiff base complexes, thiosemicarbazones compounds and transition metal oxids nanoparticles.
References
- Han, C.; Pu, H.; Li, H.; Deng, L.; Huang, S.; He, S.; Luo, Y. J. Hazard. Mater. 2013, 254–255, 301–309.
- Hua, M.; Zhang, S.; Pan, B.; Zhang, W.; Lv, L.; Zhang, Q. J. Hazard. Mater. 2012, 211–212, 317–331.
- Moreno-Pirajan, J.C.; Garcia-Cuello, V.S.; Giraldo, L. Adsorption. 2011, 17, 505–514.
- El-Sayed, M.A. Acc. Chem. Res. 2001, 34 (4), 257–264.
- Deliyanni, E.A.; Peleka, E.N.; Matis, K.A. J. Hazard. Mater. 2009, 172, 550–558.
- Mulaudzi, L.Y.; Staden, J.F.V.; van Staden, R.I. Anal. Chim. Acta. 2002, 467, 35–49.
- Aksu, Z.; Calik, A.; Dursum, A.Y.; Demircan, Z. Process. Biochem. 1999, 34, 483–491.
- Bhattacharyya, K.G.; Gupta, S.S. Adsorption. 2006, 12, 185–204.
- Wan Ngah, W.S.; Ab Ghani, S.; Kamari, A. Biores. Technol. 2005, 96, 443–450.
- Hashemian, S.; Hosseini, S.H.; Salehifar, H.; Salari, K. American J. Analytic. Chem. 2013, 4, 123–126.
- Rajasimman, M.; Murugaiyan, K. J. Adv. Chem. Eng. 2012, 2, 1–8.
- Demim, S.; Drouiche, N.; Aouabed, A.; Benayad, T.; Couderchet, M.; Semsari, S.J. Ind. Eng. Chem. 2014, 20, 512–520.
- Kalavathy, H.; Regupathib, M.I.; Pillai, M.G.; Miranda, L.R. Colloids. Surf. B: Biointerfaces. 2009, 70, 35–45.
- Myers, R.H.; Montgomery, D.C.; Anderson-Cook, C.M. Response Surface Methodology: Process and Product Optimization Using Designed Experiments, John Wiley & Sons: New York, 2009.
- Pang, S.C.; Chin, S.F.J. Nanomater. 2012, 2012, 1–7.
- Dhaouadi, H.; Ghodbane, O.; Hosni, F.; Touati, F. Int Schol Res Netw (ISRN) Spectrosc. 2012, 2012, 1–8.
- Berbenni, V.; Marini, A. Mater. Res. Bulletin. 2003, 38, 1859–1866.
- Oswald, H.R.; Wanpetich, M.J. Helv. Chim. Acta. 1967, 50, 2023–2034.
- Mourabet, M.; Rhilassi, A.E.l.; Boujaady, H.E.l.; Bennani-Ziatni, M.; Hamri, R.E.l.; Taitai, A. J. Saudi. Chem. Soc. 2015, 19, 603–615.
- Montgomery, D.C. Design and Analysis of Experiments, 4th ed.; New York: John Wiley & Sons, 2001.
- Salavati-Niasari, M.; Esmaeili-Zare, M.; Gholami-Daghian, M. Advance. Powder Technol. 2014, 25, 879–884.
- Abareshi, M.; Goharshadi, E.K.; Zebarjad, S.M.; Khandan Fadafan, H.; Yussefi, A. J. Magn. Mater. 2010, 322, 3895–3901.
- Srinivasan, A.; Viraraghavan, T. J. Hazard. Mater. 2010, 175, 695–702.
- Prakash, O.; Talat, M.; Hasan, S.; Pandey, R.K. Bioresour. Technol. 2008, 99, 7565–7572.
- Ma, L.; Peng, Y.; Wu, B.; Lei, D.; Xu, H. Chem. Eng. J. 2013, 225, 59–67.
- Qiu, H.; Lv, L.; Pan, B.-c.; Zhang, Q.-j.; Zhang, W.-m.; Zhang, Q.-x. J. Zhejiang Univ. Sci. A. 2009, 10, 716–724.
- Lagergren, S. Handlingar. 1898, 24, 1–39.
- Ho, Y.S.; McKay, G. Chem. Eng. J. 1998a, 70, 115–124.
- Weber, W.J.; Morris, J.C. J. Sanit. Eng. Div. Am. Soc. Civ. Eng. 1963, 89, 31–60.
- Chien, S.H.; Clayton, W.R. Soil. Sci. Soc. Am. J. 1980, 44, 265–285.
- Ho, Y.S. Scientometrics. 2004, 59, 171–177.
- Ho, Y.S.; McKay, G. Proc. Safe. Environ. Prot. 1998b, 76, 332–340.
- Ho, Y.S.; McKay, G. Water Res. 2000, 34, 735–742.
- Fil, B.A.; Yilmaz, M.T.; Bayer, S.; Elkoca, M.T. Brazilian. J. Chem. Eng. 2014, 31 (01), 171–182.
- Aladag, E.; Fil, B.A.; Boncukcuoglu, R.; Sozudogru, O. J. Disper. Sci. Technol. 2014, 35, 1737–1744.
- Fil, B.A.; Ozmetin, C. J. Chem. Soc. Pak. 2012, 34 (4), 896–906.
- Edwin Vasu, A. E-J. Chem. 2008, 5 (1), 1–9.
- Wu, Y.; Zhou, J.; Wen, Y.; Jiang, L.; Wu, Y.J. Appl. Biochem. Biotech. 2012, 168 (8), 2079–2093.