
ABSTRACT
A dummy molecularly imprinted polymer (d-MIP) was developed for extraction and cleanup of farrerol from Rhododendron aganniphum. The d-MIP was prepared by precipitation polymerization using quercetin as the dummy template, 4-vinylpyridine as the functional monomer, ethylene glycol dimethacrylate as the cross-linker, and acetonitrile as the porogen. The d-MIP was characterized by scanning electron microscopy and Fourier-transform infrared spectroscopy. Dynamic curves, adsorption isotherms, and Scatchard plots showed the d-MIP had good affinity, capacity, and selectivity for the target compound. The prepared d-MIP was used as a sorbent in solid-phase extraction cartridges and successfully applied to specific extraction and purification of farrerol from real samples. High recoveries were obtained for four spiked levels of farrerol in Rhododendron aganniphum using d-MIP solid-phase extraction coupled with high-performance liquid chromatography. The linear range was 1–100 µg mL−1, the limit of detection was 2.23 mg kg−1, the farrerol recovery range was 85.7%–104.1%, and the relative standard deviations (n = 3) were all less than 2.2% for real samples. The proposed method provides a simple, rapid, and environmentally friendly approach to the analysis of farrerol in complex herbal products.
GRAPHICAL ABSTRACT
1. Introduction
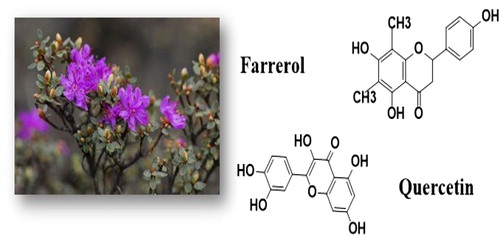
Rhododendron aganniphum is a species in the Ericaceae family that mainly grows at an altitude of 2700–4700 m on the Tibetan plateau (Citation 1), where it is beneficial for the environment and is used as a herb. Both its stems and leaves are commonly used in traditional medicines, and its main bioactive substances are flavonoids ( Citation2–4), phenolic compounds ( Citation5), and grayanane diterpenoids ( Citation6,Citation7). Previous studies have shown that species in the Ericaceae family have high farrerol contents. Farrerol is a secondary metabolite in plants and present in many Rhododendron species. Some studies have reported on the extraction and determination of farrerol from Rhododendron dauricum ( Citation2), Rhododendron aureum ( Citation8), and Rhododendron alutaceum ( Citation5).
Farrerol has a range of activities that are beneficial against cardiovascular diseases, respiratory system diseases, and Alzheimer's disease, and it has anti-inflammatory, antibacterial, hypoglycemic, antioxidant, anticancer, antitumor, immunity enhancing, and other pharmacological effects ( Citation9–14). Many methods for extracting and detecting farrerol have been reported, including high-performance liquid chromatography and capillary electrophoresis ( Citation2,Citation15,Citation16), but these methods cannot provide the selectivity that is required for effective extraction and determination of bioactive components from complex matrices.
Molecularly imprinted polymers (MIPs) have benefits such as specific recognition, selectivity, and practicability of template molecules and structural analogues ( Citation17). precipitation polymerization for preparation for MIPs is simple, inexpensive, and produces MIPs with mechanical and chemical stability and long service lives ( Citation18–20). Compared with conventional extraction techniques, molecularly imprinted solid-phase extraction (MISPE) is an effective method for enrichment and separation of bioactive molecules ( Citation21–23). This method uses a MIP as the column packing to effectively avoid matrix interference from complex mixtures ( Citation24,Citation25). Although many methods based on molecular imprinting have been reported for the extraction of active components, and some of these have achieved good results for flavonoids and alkaloids ( Citation19), there are issues with false positive results and template leakage. Template leakage may be responsible for false positives and limit quantification of extracted compounds. Recently, MIPs have been prepared using a structural analog as the template molecule to avoid template leakage and associated false positive results ( Citation23,Citation24,Citation26). The structure of the dummy molecule and its functional groups must be similar to the target analyte, and must not interfere in the test ( Citation21,Citation27). To date, a dummy molecularly imprinted polymer (d-MIP) has not been used as a sorbent for solid-phase extraction (SPE) of farrerol. This method is promising as a rapid, simple, inexpensive, environmentally friendly, and highly selective method for extraction of farrerol, and should be investigated.
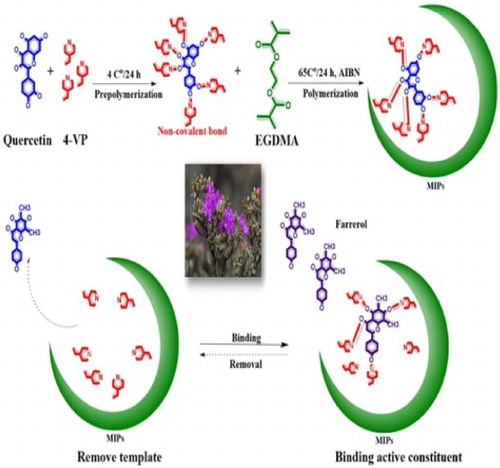
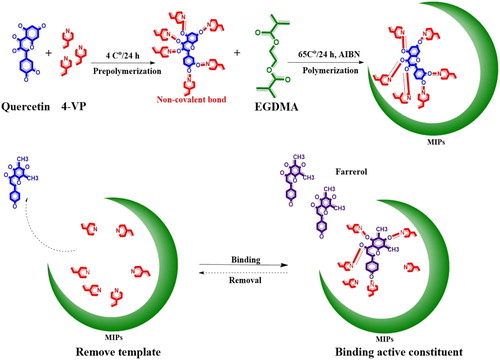
In the present study, based on software analysis of energy conformations, we selected quercetin as a dummy template. By optimizing the proportions of constituents in the polymerization reaction system, d-MIPs with good adsorption properties were prepared, characterized, and analyzed. The selectivities and recognition properties of the d-MIPs were evaluated in adsorption tests to select the optimum d-MIP for application as a sorbent in dummy MISPE (d-MISPE). Finally, this method was applied to real samples to determine the content of farrerol. This method is expected to solve the crucial problem of efficient enrichment and extraction of farrerol from R. aganniphum and other Ericaceae herbs.
2. Experimental
2.1. Chemicals
Farrerol, quercetin, kaempferol, and matrine (purity >99%; ), were purchased from Chinese Chemicals and Biological Drug Institute. (Beijing, China). 4-Vinylpyridine (4-VP), ethylene glycol dimethacrylate (EGDMA), and 2-2′-azobisisobutyronitrile were all obtained from Merck (Darmstadt, Germany). 4-VP was distilled to remove inhibitors before use. Ammonium acetate and formic acid were also purchased from Merck. Roots, stalks, and leaves of R. aganniphum were purchased from the Tibetan Medicine Co. Ltd. (Tibet, China) (). Carbon tetrachloride (CCl4), methylene chloride (CH2Cl2), n-hexane, and other reagents were all analytical grade reagents and used without further purification. Ultrapure water was prepared using a Millipore Milli-Q water purification system (Millipore, Bedford, MA).
Figure 1. The chemical structures of farrerol, quercetin and the image of R. aganniphum.
Stock standard solutions of the analytes (1000 mg L−1) were prepared in high-performance liquid chromatography (HPLC) grade methanol (MeOH; Thermo Fisher Scientific, Waltham, MA) and stored at 4°C. Standard solutions of the flavonoids were prepared by diluting the stock solutions with HPLC grade acetonitrile (ACN; Thermo Fisher Scientific) and also stored at 4°C. Working solutions were prepared daily by appropriate dilutions of the stock standard solutions with a mixture of NaH2PO4 (10 mmol L−1, pH 7) and ACN (60:40, v/v).
2.2. Instruments and methods
Ultraviolet-visible spectroscopy (Nanodrop 2000C, Thermo Fisher Scientific) was used to investigate the appropriate ratio between the dummy template and functional monomer. The polymers were also characterized by Fourier transform infrared spectroscopy (FT-IR; PU9800, PANalytical, Almelo, The Netherlands). The morphological characteristics of the d-MIP were investigated by scanning electron microscopy (S-4800, Hitachi Limited, Tokyo, Japan). SPE was performed using a twelve-port SPE System (Jin Sui Biological Technology Co, Peking, China) with a vacuum pump. Cartridges (5 mL) with polyethylene sieve plates (20 µm) were packed with the solid phase. The energy conformation was analyzed using Hyperchem from HyperCube Inc. (Peking, China).
2.3. Chromatographic separation
The adsorption abilities of the d-MIP and dummy non-imprinted polymers (d-NIP) were analyzed by HPLC (2695 Alliance HPLC system, Waters Corporation, Milford, MA) with a diode array detector. Detection was performed at 25°C with a detection wavelength of 296 nm for farrerol, 370 nm for quercetin, and 220 nm for matrine. A Cosmosil 3C18-EB column (100 × 2.0 mm inside diameter, particle size 5 µm) was used for separation of the compounds at 25°C. An isocratic elution was performed with a mixture of ACN and 5 mmol L−1 ammonium acetate buffer. Date acquisition was carried out with ChemStation Software (Waters Corporation).
2.4. Preparation of d-MIPs
To synthesize the d-MIP, the dummy template (quercetin, 0.04 mmol) and the functional monomer (4-VP, 0.16 mmol) were dispersed in ACN (30 mL) in a 50-mL glass tube for 20 min. Then, the cross-linker EGDMA (0.8 mmol) and 2-2′-azobisisobutyronitrile (25.0 mg) were added. Air was purged from the reaction system using nitrogen gas for 10 min, and polymerization was performed at 60°C in a water bath for 24 h. NIPs were also synthesized by the same method as the control polymers. The ivory polymers were centrifuged and precipitated, and the sediments were filtered and dried. Finally, the polymers were packed with qualitative filter paper, and Soxhlet extraction was used to remove the template until the amount of quercetin detected by HPLC at 370 nm was negligible. A mixture of MeOH/acetic acid (90:10, v/v) was used for elution. The prepared d-MIP and d-NIP were washed three times with MeOH until the acetic acid was completely removed, and then dried and stored at room temperature.
2.5. Evaluation of the binding performance
Batch experiments were performed to select the optimum d-MIP and d-NIP. Each d-MIPs or d-NIPs (5 mg) was dispersed in a 7 mg mL−1 farrerol standard solution for 0.5, 1, 2, 3, 5, 8, 16, or 24 h. In other experiments, each d-MIPs or d-NIPs was dispersed in 1 mL of farrerol solution (0.5, 1, 2, 3, 4, 5, 6, 7, or 8 mg mL−1) for 10 h. The mixtures were shaken (300 rpm) at room temperature until they reached binding equilibrium about 10 h, which was determined by the adsorption. Each supernatant was analyzed in triplicate by HPLC with detection at 296 nm to determine the amount of farrerol. The binding capacity was estimated using the following equations (
Citation18,Citation19):(1) where Q is the binding capacity for the d-MIP, C0 is the initial concentration, Ce is the equilibrium concentration of the standard solution, V is the volume of the initial standard solution, and W is the mass of the MIP; and
(2) where Q is the binding capacity for the d-MIP, Qmax is the maximum binding capacity, Ce is the equilibrium concentration of the standard solution, and Kd is the dissociation constant related to the affinity of the adsorption site.
Finally, the imprinting factor (IF) was calculated (Equation 3) as the ratio of Qmax-MIP to Qmax-NIP and used to assess specific and non-specific interactions.(3)
2.6. Selectivity of the d-MIP
Farrerol, quercetin, kaempferol, and matrine were used as controls to investigate the selectivity of the d-MIP. A mixed standard solution of these compounds, each at 10 µg mL−1, was prepared in ACN. The mixed standard solution was added to the d-MIP in centrifuge tubes under predetermined conditions, and the supernatants were obtained after centrifugation (10 min, 5000 rpm). The adsorption capacity of the d-MIP was determined by HPLC. First, the distribution coefficient (KD), which indicates the ratio between the amounts adsorbed and not adsorbed, for each compound was calculated using following equations (
Citation28,Citation29):(4) Where C0 is the initial concentration of the compound; and Ce is the final concentration after completion of adsorption. Then, the results from Equation (4) were input into Equations (5) and (6):
(5)
(6) where k is the selectivity coefficient of the MISPE cartridge, which is an indicator of the selectivity of the MIP between quercetin and other compounds (i = 2, 3, 4); and k’ is the relative coefficient, which is an indicator of the selectivity of the MIP for a specific compound.
2.7. Preparation and optimization of the d-MISPE cartridges
A 10-mg sample of the d-MIP or NIP was dispersed in acetone (5 mL) and put into a 10-mL SPE cartridge (length 80 mm, inside diameter 10 mm) between two sieve plates. The cartridges were equilibrated with 5 mL of MeOH and 5 mL of ACN to increase the number of active sites in the d-MIP and remove any impurities. The loading solvents were ACN, 100% MeOH, and purified water. The washing solvents were n-hexane, CCl4, and CH2Cl2. The elution solvents were 90%, 80%, and 70% MeOH–acetic acid.
2.8. Detection of farrerol by MISPE-HPLC in real samples
A 1.01 g sample of crude powder prepared from R. aganniphum leaves was extracted into ACN (10 mL) for 24 h, centrifuged for 10 min, and the supernatant was retained. The supernatant was reduced to dryness under a stream of nitrogen gas. Then, the residues were dissolved in ACN and loaded into an MISPE cartridges. The loading, washing solvent, and elution solvents were collected for analysis.
3. Results and discussion
3.1. Preparation of the d-MIP and d-NIP
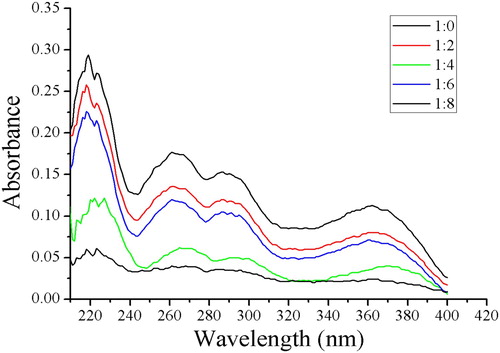
We used ultraviolet-visible spectra to investigate different molar ratios of the template (quercetin) and functional monomer (4-VP) in ACN. The absorbance wavelength of quercetin changed as the amount of 4-VP increased. The red shift of the absorbance wavelength indicated formation of interactions, such as hydrogen bonds, ionic bonds (electrostatic), hydrophobic interactions, and dipole-dipole interactions. The maximum red shift was obtained when the molar ratio of template to functional monomer was 1:4 (), which agreed with the results of an earlier study ( Citation20). Hydrogen bonds possibly formed between the carbonyl and hydroxyl groups in quercetin and lone pair electrons of nitrogen atoms in the 4-VP. Therefore, a 1:4 ratio of template to functional monomer was used in subsequent experiments.
Figure 2. Ultraviolet spectra obtained with different molar ratios between quercetin and 4-vinylpyridine.
Precipitation polymerization is a simple method for directly preparing d-MIP microspheres, and can effectively avoid the issues of other methods that use crushing and sieving steps, which are time-consuming and have relatively low final yields ( Citation30). Furthermore, because this method did not use a stabilizer and the prepared polymer microsphere surfaces were very clean, the ratio of template to cross-linker was 1:20 in accordance with an established experimental protocol ( Citation20). Non-covalent precipitation was used to prepare d-MIPs and d-NIPs (). ACN was used as the porogen in our experiments.
Figure 3. Schematic diagram of the preparation and adsorption procedure with the dummy molecularly imprinted polymers.
3.2. Characterization
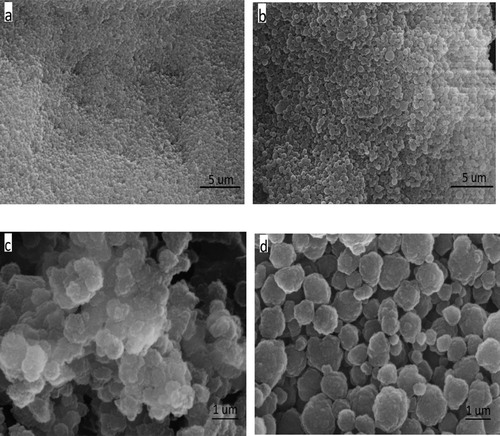
The d-MIP and d-NIP were investigated by scanning electron microscopy. The d-MIP structure was more open and porous than that of the d-NIP (). The d-MIP had a rough surface with many holes, which would provide a large surface for adsorption of the templates. The roughness of the d-MIP surface suggested it contained cavities that could contribute to high adsorption ( Citation31). These open structures could capture template analogs and increase the removal and rebinding of farrerol. By contrast, the surface of the d-NIP was relatively smooth and dense. The sizes of the d-MIP particles ranged from 540 to 460 nm, and the d-NIP particles were obviously smaller than the d-MIP particles, which suggested that the particles increased in size on inclusion of the template.
Figure 4. SEM images of the d-NIP (a, c) and d-MIP (b, d).
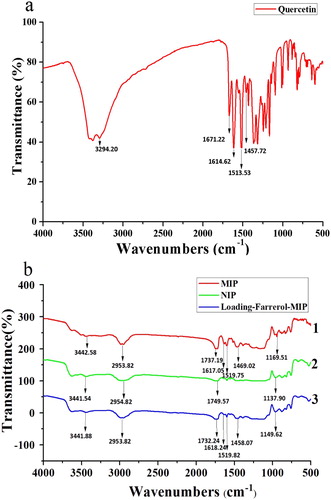
FT-IR was used to confirm that the quercetin-imprinted polymers were successfully synthesized (). Hydroxyl and carbonyl group stretching vibration peaks were observed at 3294.20 and 1671.24 cm−1, which confirmed the presence of these groups in quercetin. From this, we predicted that hydrogen could combine with the functional monomers. We observed the following peaks for the d-MIP, d-NIP, and d-MIP loaded with farrerol, respectively (): cyclobenzene stretching vibration peaks were observed at 1614.62, 1513.53, and 1457.72 cm−1 ((a))( Citation31). N-H stretching vibration peaks at 3442.58, 3441.54, and 3441.88 cm−1; and C=O peaks at 1737.19, 1749.57, and 1732.24 cm−1. Because quercetin and farrerol are structural analogs, they were both adsorbed by the d-MIP and stretching vibration peaks for cyclobenzene were observed ((b)). This could be compared with the d-NIP ((b)). Stretching vibration peaks for -C-O- were observed at 1169.51, 1137.90, 1149.62 cm−1 ((b)), and these could be from the cross-linker (EGDMA). These FT-IR results confirmed the template, functional monomer, and cross-linker interacted.
Figure 5. FTIR spectra of the template (quercetin, a), d-MIP with adsorbed quercetin, d-NIP with adsorbed quercetin, and d-MIP with adsorbed farrerol (b).
3.3. Binding capacities of the d-MIP and d-NIP
The amount of farrerol adsorbed on the d-MIP and d-NIP increased over time at 25°C ((a)). Maximum adsorption of the targets on the d-MIP occurred at 8 h, whereas adsorption on the d-NIP took 5 h to reach the maximum. These results suggested that recognition sites were present on the surface and within deep holes in the d-MIP. Consequently, the adsorption process was initially rapid on the surface of the d-MIP, but once the surface sites were occupied, the rate of adsorption decreased until it reached equilibrium. Therefore, the prepared d-MIP is more appropriate for specific adsorption of farrerol than the d-NIP.
Figure 6. Dynamic curves (a) and adsorption isotherms (b) for the adsorption of farrerol by the d-MIP and d-NIP.
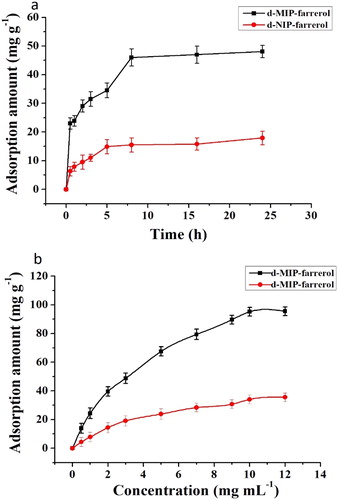
Adsorption isotherms of farrerol were obtained using the d-MIP and d-NIP as sorbents with ACN solutions containing different concentrations of farrerol ((b)). The amounts of farrerol adsorption increased with the increasing concentration of the farrerol solution. When the concentration of farrerol was 7 mg L−1, the binding capacity of farrerol nearly reached saturation. After reaching equilibrium, the adsorption was constant and the binding sites were fully occupied by farrerol. By comparison, the adsorption capacity of the d-NIP was low, and the amounts adsorbed did not increase with the farrerol concentration. Similar isotherms have been used to investigate the binding capacities of d-MIPs with other analytes.( Citation32)
Further analysis of the binding ability was conducted using Scatchard plots, which are effective for evaluating adsorption sites.( Citation18) The Scatchard plot for d-MIP showed two straight lines: one for the high affinity sites, and one for the low affinity sites (). This confirmed that the d-MIP contained two types of adsorption sites (surface sites and holes). The Kd of the low affinity sites where similar to those for the d-NIP, but larger than those for the high affinity sites. The Qmax and IF of the low affinity sites were larger than those of the high affinity sites. The d-NIP had the lowest Qmax (). The results suggested that low affinity sites were present on the surface, and the high affinity sites were located within holes in the d-MIP. By contrast, the d-NIP only had non-selective sites. Furthermore, the results implied that the specific affinity sites in the d-MIP were formed during the process of polymerization.
Figure 7. Scatchard plots of the d-MIP (a) and d-NIP (b).
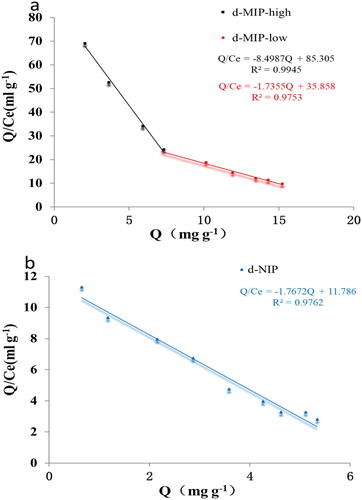
Table 1. The maximum adsorption capacity (Qmax) and imprinting factor (IF) obtained from the Scatchard plots.
3.4. Selectivity of the d-MIP
We investigated the selectivity of the d-MIP using quercetin structural analogs (farrerol and kaempferol) and matrine, which has a dissimilar structure (). The Kd values of farrerol, kaempferol, and matrine were smaller than that of quercetin, but the k and k′ of matrine were larger than those of the others (). These results suggested that the d-MIP adsorbed large amounts of farrerol and quercetin, but it lacked recognition and selectivity for matrine. Furthermore, farrerol and quercetin were more easily distributed in the d-MIP than matrine and kaempferol, and the selectivity coefficients (k) indicated that the d-MIP was specific for farrerol and quercetin. Additionally, the relative coefficient (k’) for farrerol was 1.04, which suggested the d-MIP had specific recognition sites, unlike the d-NIP, and it could recognize that matrine was a different compound. Therefore, the results demonstrated that the d-MIP prepared with quercetin as a dummy template provided selective rebinding for extraction and detection of farrerol. This would effectively overcome the issue of false positive results from complex matrices, such as those found in R. dauricum and other Chinese herbs.
Table 2. Selectivity of the d-MIP and d-NIP for farrerol, kaempferol, and matrine compared with those for quercetin (n = 3).
3.5. Optimization of the performance of the d-MISPE and validation using real samples
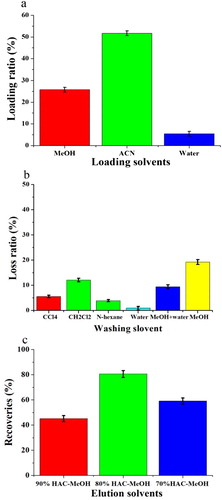
A standard solution of farrerol was analyzed by HPLC, and peaks for farrerol and quercetin were observed at 14.9 and 5.8 min, respectively ((a)). After investigating different loading solvents, ACN was selected as the loading solvent ((a)). The chromatogram of the extract showed that many compounds were present in the leaves of R. aganniphum ((b)). To evaluate different solvents for use as the washing solvent, the samples were loaded onto the cartridges and washed with 5 mL of CCl4, CH2Cl2, n-hexane, water, a 50% (volume fraction) water–MeOH mixture, or 100% MeOH. Among these solvents, water provided the best cleanup of other compounds in the washing process (c, e, b and c). However, a small amount of farrerol was also washed out from the cartridge with pure water. The maximum farrerol recovery in the elution process was obtained with 5 mL of an 80% (volume fraction) MeOH–acetic acid mixture ( and c). In summary, the optimum d-MISPE procedure used ACN as the loading solvent, water as the washing solvent, and 80% (volume fraction) MeOH–acetic acid mixture as the eluent.
Figure 8. HPLC-UV chromatogram of farrerol (a). Ethanol extraction of R. aganniphum leaves before MISPE (b). Washing with carbon tetrachloride (CCl4) (c), methylene chloride (CH2Cl2) (d), and n-hexane (e). Elution with MeOH–acetic acid (80%, MeOH volume fraction) (f).
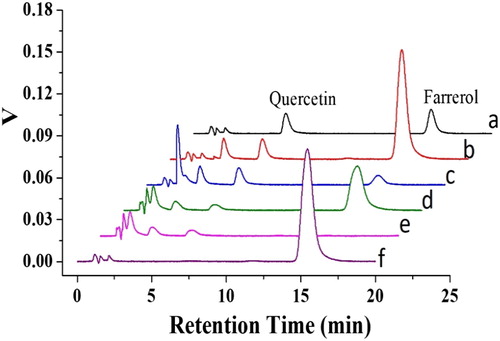
Figure 9. The loading ratio (a), loss ratio (b), and recoveries (c) obtained with the d-MISPE cartridges in the optimized procedure.
3.6. Validation of the performance of the d-MISPE and HPLC in real samples
The linear range, relative standard deviation, correlation coefficients, limits of detection, and recovery were evaluated based on SANTE/11945/2015 and other reports( Citation32,Citation33,Citation34). The quantification of analytes was carried out by spiking R. aganniphum samples with matrix-matched calibration curve analytes. The linear correlation coefficients of farrerol was 0.9924 in the range of 1–100 µg mL−1. Under the optimized chromatographic conditions, the detection limit for farrerol in R. aganniphum samples was 2.23 mg kg−1 (signal-to-noise ratio = 3).
To evaluate the performance of d-MISPE cartridges extraction coupled with HPLC, the accuracy and precision of the method were tested by spiking R. aganniphum (1 g) with farrerol at four levels (1, 10, 50, and 100 µg g−1). The average recoveries obtained with this method were between 85.7% and 104.1% (). The precisions given by the relative standard deviations (n = 3), were all less than 2.2%.
Table 3. Recoveries of farrerol from Rhododendron aganniphum after extraction and cleanup by d-MISPE coupled with HPLC (n = 3).
Furthermore, we chose several different parts of R. aganniphum to analyze using the developed method. The farrerol contents of leaves, stalks, and roots were 158.1 ± 1.54, 152.4 ± 2.34, and 85.4 ± 1.02 µg g−1, respectively. Therefore, the developed method demonstrated satisfactory performance for the extraction and quantitation of farrerol from complex herbal extracts.
4. Conclusions
The prepared d-MIP exhibited good absorption and recognition for farrerol. The use of this d-MIP as a SPE sorbent can successfully overcome interference from complex matrices and false positive issues for the extraction and determination of farrerol in real samples. The accuracy and precision of the d-MISPE–HPLC method is very good. Furthermore, the d-MISPE cartridges could be applied to the study of other herbs that contain farrerol in the future. MISPE cartridges could also be prepared for extraction of other compounds from Rhododendron species and evaluation of other herbs.
Acknowledgements
This study was supported by the Key Projects in the National Science and Technological Pillar Program during the Twelfth Five-year Plan Period (Grant No. 2015BAD1101); the earmarked fund for the China Agriculture Research System under Grant No. CAR-38; the Special Fund for Agro-scientific Research in Tibet Autonomous Region of China (Contract No. 201603040-01); the National Natural Science Foundation of China under Contact Nos. 31471654 and 31772071; and the China Agriculture Research System (NO. CARS-05-05A-03).
Disclosure statement
No potential conflict of interest was reported by the authors.
Notes on contributors
Xingbin Ma is a D.V.M at Lanzhou Institute of Animal Science and Veterinary Pharmaceutics, Chinese Academy of Agricultural Sciences. His research focused on the study of Chinese veterinary medicine and mainly extracting and separating the bio-active compounds from the herbs.
Hongling Lin is a research assistantship of Zhanjiang Experimental Station of Chinese Academy of Tropical Sciences, Zhanjiang. Her current research is mainly focused on veterinary medicine and used the compounds to cure the infectious disease of livestock and poultry.
Jiyu Zhang is a professor of Lanzhou Institute of Animal Science and Veterinary Pharmaceutics, Chinese Academy of Agricultural Sciences. His research focused on the study of veterinary medicine and natural products.
Xuzheng Zhou is a professor of Lanzhou Institute of Animal Science and Veterinary Pharmaceutics, Chinese Academy of Agricultural Sciences. His research also focused on the study of veterinary medicine and natural products.
Jiancheng Han is an associate professor of Zhanjiang Experimental Station of Chinese Academy of Tropical Sciences, Zhanjiang. His research interest focuses on HPLC.
Yongxin She received his M.S.degree in Northwest A&F University Agricultural University in 2007, and He received his Ph.D. in Graduate School of the Chinese Academy of Agricultural Sciences in 2010. He is currently the professor of Institute of Quality Standards & Testing Technology for Agro-Products, Chinese Academy of Agricultural Sciences. He mainly focuses on application of molecularly imprinted polymer and nanomaterial in the separation and analysis of pesticide and veterinary residues and construction, synthesis and application of EC and SPR sensors for Small substance analysis based on molecularly imprinted technology.
Cheng Qiu is an associate professor of Product Quality Standard and Testing Research, Tibet Academy of Agricultural and Animal Husbandry Sciences. His research also focused on the study of the extraction and separation chemical substances by HPLC.
Qiang He is an assistant professor of Gansu agricultural vocational and technical college. His research also focused on the study of veterinary medicine.
Jing Wang received B.S. degree from Heilongjiang University in 1985. she was working in the Northeast Agriculture University between 1985 and 1996. After obtained her PhD, she was appointed to be an associate professor, professor of the Northeast Agriculture University and of Harbin Institute of Technology from 1996 to 2005. She is currently a professor and director of residues research department of the Institute of Quality Standards & Testing Technology for Agro-products, CAAS. She has engaged in studies of food safety and testing technology/screening novel products with bioactivities.
Tsdan Rabah is an associate professor of Institute of Veterinary and Animal Husbandry, Tibet Academy of Agricultural and Animal Husbandry Sciences. His research interest focuses on Tibetan veterinary medicine.
Additional information
Funding
References
- Guo, X.; Shang, X.; Zhou, X.; Zhao, B.; Zhang, J. Ultrason. Sonochem. 2017, 38, 246–255. doi: 10.1016/j.ultsonch.2017.03.021
- Lou, X.W.; Lin, Q.H.; Zhang, G.Y.; Liu, W.Y.; Feng, F.; Qu, W. Chin. J. Nat. Med. 2015, 13, 628–633.
- Lai, Y.; Zeng, H.; He, M.; Qian, H.; Wu, Z.; Luo, Z.; Xue, Y.; Yao, G.; Zhang, Y. Fitoterapia. 2016, 112, 237–243. doi: 10.1016/j.fitote.2016.06.008
- Chen, G.; Jin, H. Z.; Li, X.F.; Zhang, Q.; Shen, Y.H.; Yan, S.K.; Zhang, W.D. Arch. Pharm. Res. 2008, 31 (8), 970–972. doi: 10.1007/s12272-001-1253-y
- Li, H.Z.; Song, H.J.; Li, H.M.; Pan, Y.Y.; Li, R.T. Arch. Pharm. Res. 2012, 35 (11), 1887–1893. doi: 10.1007/s12272-012-1104-9
- Liu, C.C.; Lei, C.; Zhong, Y.; Gao, L.X.; Li, J.Y.; Yu, M.H.; Li, J.; Hou, A.J. Tetrahedron. 2014, 70 (29), 4317–4322. doi: 10.1016/j.tet.2014.05.019
- Zhang, M.; Xie, Y.; Zhan, G.; Lei, L.; Shu, P.; Chen, Y.; Xue, Y.; Luo, Z.; Wan, Q.; Yao, G.; Zhang, Y. Phytochemistry. 2015, 117, 107–115. doi: 10.1016/j.phytochem.2015.06.007
- Kim, M.H.; Nugroho, A.; Choi, J.; Park, J.H.; Park, H.J. Arch. Pharm. Res. 2011, 34 (6), 971–978. doi: 10.1007/s12272-011-0614-1
- Li, Q.Y.; Chen, L.; Zhu, Y.H.; Zhang, M.; Wang, Y.P.; Wang, M.W. Acta Pharmacol. Sin. 2011, 32 (4), 433–440. doi: 10.1038/aps.2011.1
- Li, J.K.; Ge, R.; Tang, L.; Li, Q.S. Can. J. Physiol. Pharmacol. 2013, 91 (9), 733–740. doi: 10.1139/cjpp-2013-0008
- Xie, J.; Zhu, L.; Luo, H.; Zhou, L.; Li, C.; Xu, X. J. Chromatogr. A. 2001, 934 (12), 1–11. doi: 10.1016/S0021-9673(01)01294-8
- Baby, B.; Antony, P.; Vijayan, R. Crit. Rev. Food Sci. Nutr. 2017, 28, 1–17. doi: 10.1080/10408398.2017.1329198
- Amawi, H.; Ashby, C. R., Jr.; Tiwari, A.K. Chin. J. Cancer. 2017, 36 (1), 50–62. doi: 10.1186/s40880-017-0217-4
- Ni, T.; He, Z.; Dai, Y.; Yao, J.; Guo, Q.; Wei, L. Cell Death Dis. 2017, 8 (6), e2865. doi: 10.1038/cddis.2017.261
- Cao, Y.; Lou, C.; Fang, Y.; Ye, J. J. Chromatogr. A. 2002, 943 (1), 153–157. doi: 10.1016/S0021-9673(01)01434-0
- Wang, L.; Zhu, X.; Lou, X.; Zheng, F.; Feng, Y.; Liu, W.; Feng, F.; Xie, N. J. Sep. Sci. 2015, 38, 156–164.
- Andersson, L.I. J. Chromatogr. B. Biomed. Sci. Appl. 2000, 739 (1), 163–173. doi: 10.1016/S0378-4347(99)00432-6
- Funaya, N.; Haginaka, J. J. Chromatogr. A. 2012, 1248, 18–23. doi: 10.1016/j.chroma.2012.05.081
- Zeng, S.M.; She, Y.X.; Jiao, B.N.; Liu, G.Y.; Wang, J.; Su, X.S.; Ma, X.B.; Jin, M.J.; Jin, F.; Wang, S.S. RSC Adv. 2015, 5 (115), 94997–95006. doi: 10.1039/C5RA18608K
- O’Mahony, J.; Molinelli, A.; Nolan, K.; Smyth, M.R.; Mizaikoff, B. Biosens. Bioelectron. 2006, 21 (7), 1383–1392. doi: 10.1016/j.bios.2005.05.015
- Nolvachai, Y.; Kulsing, C.; Boysen, R. I.; Hearn, M.T.; Marriott, P.J. J. Sep. Sci. 2014, 37 (8), 1018–1025. doi: 10.1002/jssc.201301009
- Kolaei, M.; Dashtian, K.; Rafiee, Z.; Ghaedi, M. Ultrason. Sonochem. 2016, 33, 240–248. doi: 10.1016/j.ultsonch.2016.05.003
- Luo, J.; Huang, J.; Cong, J.; Wei, W.; Liu, X. ACS Appl. Mater. Interfaces. 2017, 9 (8), 7735–7744. doi: 10.1021/acsami.6b14733
- Bertolla, M.; Cenci, L.; Anesi, A.; Ambrosi, E.; Tagliaro, F.; Vanzetti, L.; Guella, G.; Bossi, A.M. ACS Appl. Mater. Interfaces. 2017, 9 (8), 6908–6915. doi: 10.1021/acsami.6b16291
- Fu, Q.; Fang, Q.; Feng, B.; Sun, S.; Du, W.; Amut, E.; Xiao, A.; Chang, C. J. Chromatogr. B. Biomed. Sci. Appl. 2011, 879 (13–14), 894–900.
- Du, W.; Fu, Q.; Zhao, G.; Huang, P.; Jiao, Y.; Wu, H.; Luo, Z.; Chang, C. Food Chem. 2013, 139 (1–4), 24–30. doi: 10.1016/j.foodchem.2013.01.109
- Zhao, F.; She, Y.; Zhang, C.; Cao, X.; Wang, S.; Zheng, L.; Jin, M.; Shao, H.; Jin, F.; Wang, J. J. Chromatogr. B Analyt. Technol. Biomed. Life Sci. 2017, 1064, 143–150. doi: 10.1016/j.jchromb.2017.08.022
- Gao, B.; Niu, Q.; Du, R. J. Sep. Sci. 2010, 33 (9), 1338–1348.
- Zeng, H.; Wang, Y.; Liu, X.; Kong, J.; Nie, C. Talanta. 2012, 93, 172–181. doi: 10.1016/j.talanta.2012.02.008
- Pardo, A.; Mespouille, L.; Dubois, P.; Blankert, B.; Duez, P. Chemistry. 2014, 20 (12), 3500–3509. doi: 10.1002/chem.201303216
- Song, X.; Li, J.; Wang, J.; Chen, L. Talanta. 2009, 80 (2), 694–702. doi: 10.1016/j.talanta.2009.07.051
- Xia, Y.; Guo, T.; Song, M.; Zhang, B.; Zhang, B. React. Funct. Polym. 2006, 66 (12), 1734–1740. doi: 10.1016/j.reactfunctpolym.2006.08.001
- Zhao, F.; She, Y.; Zhang, C.; Wang, S.; Du, X.; Jin, F.; Jin, M.; Shao, H.; Zheng, L.; Wang, J. Food Anal Method. 2017, 10 (7), 2566–2575. doi: 10.1007/s12161-017-0810-9
- SANTE/11945/2015. https://ec.europa.eu/food/sites/food/files/plant/docs/pesticides_mrl_guidelines_wrkdoc_11945.pdf. (accessed Jun 6, 2018).