
 ?Mathematical formulae have been encoded as MathML and are displayed in this HTML version using MathJax in order to improve their display. Uncheck the box to turn MathJax off. This feature requires Javascript. Click on a formula to zoom.
ABSTRACT
The corrosion phenomenon in oil and gas industry is a serious issue affecting metallic structures and pipelines. The main aggressive species flowing through oil pipelines is NaCl. The presence of gases in the corrosive medium (CO2 and H2S), increases, even more, its aggressiveness. Usually, to mitigate corrosion, liquid inhibitors are added to the corrosive medium. In the present study, N-hydroxyethyl-imidazoline derivatives of avocado oil was synthesized as a green corrosion inhibitor. The test was performed on 1018 carbon steel at 5, 10, 25, 50 and 100 ppm. Electrochemical techniques as polarization curves (PC), the open circuit potential (OCP), the lineal polarization resistance (LPR) and the electrochemical impedance spectroscopy (EIS) were applied. The results obtained from the OCP indicates that the inhibitor can be classified as a cathodic type one. On the one hand, PC, RPL and EIS determined that the highest corrosion rate was obtained without the inhibitor. On the other hand, by adding inhibitor, the corrosion resistance increased, obtaining the optimal concentration at 10 ppm. The EIS technique in the angle phase format showed the formation of two time constants, which indicates the inhibitor presence. Finally, the SEM analyses showed a minor attack at 5 and 10 ppm.
GRAPHICAL ABSTRACT
1. Introduction
Carbon steel parts in oil industry are often susceptible to suffer corrosion damage because of the presence of different aggressive species such as carbon dioxide (CO2). In recent years, due to the trend of increasing CO2 injection into oil wells, preventing damage in the hydrocarbon transporation lines has been a serious challenge. As a result, the addition of corrosion inhibitors in the hydrocarbon production lines is currently a common practice to prevent corrosion failures associated with CO2 (g) and impurities (chlorides, cyanides, etc.) (Citation1, Citation2).
There are two types of corrosion inhibitors developed to prevent CO2 induced corrosion; these inhibitors are based on inorganic and organic compounds. Inorganic inhibitors are mainly chromates and nitrates, which form a film on the metal surface acting as a barrier against corrosive species. The disadvantage of inorganic inhibitors is that these must be added in large doses and sometimes they present low effectiveness. On the other hand, organic inhibitors are added in small doses, and as a result, the cost of investment to inhibit corrosion is reduced. Among the different types of organic inhibitors, imidazoline and their precursors (amide) have been used successfully to prevent corrosion (Citation2). Oleic imidazoline inhibitors have especially proved to be effective for protecting metallic surfaces against corrosion. These are compounds that can be adsorbed on the surface of the metal by the displacement of water molecules, forming a protective barrier/layer which is of an oil-like nature, avoiding free access of corrosive agents (H2O, Cl−, H+ and ) and/or blocking the active sites (Citation3, Citation4). The adsorption of organic inhibitors depends on the inhibitor’s molecular structure, the metal’s surface charge and type of electrolyte (Citation5).
The molecular structure of imidazoline consists on a five-membered ring, which contains two atoms of nitrogen (head group), a hydrocarbon chain (hydrophobic tail) and a pendant side chain attached to one of the nitrogen atoms. (Citation6–8). It is well known that the adsorption of this type of inhibitors on a metal surface can occur by either physical or chemical adsorption processes. The chemical adsorption can be conducted by formation of an iron–nitrogen coordinate-type bond and by a pi-electron interaction between the pi-electron in the head group and iron. Alternatively, the physical adsorption is given by coulombic attraction, which involves electrostatic attraction between the charged metal surface and the charged molecules of the inhibitor (Citation9, Citation10). Some authors have mentioned that the length of the hydrocarbon chain in the imidazoline structure is also known for their ability to form protective films (Citation8, Citation11, Citation12), due to the unsaturation of oil-like tails (hydrophobic tail). This feature favors the adsorption on the metal surface by means of a flat-adsorption process, blocking active sites and reducing the corrosion process (Citation5).
According to the above-mentioned, the aim of this study was the synthesis of an inhibitor corrosion (N-hydroxyethyl-imidazoline derivatives of avocado oil) and the evaluation of its electrochemical performance. The avocado oil is unsaturated and the predominant fatty acid is oleic, whose amount can be up to 80% of the total fatty acids (Citation13). In recent years, green inhibitors based on oleic sources have turned out to be a viable alternative, not only for their performance, but also for their environmental friendly nature. In the present study, the oleic source was obtained from avocado waste, which led to reduce the cost of inhibitor synthesis. The fact that this inhibitor can be prepared from waste is important because it does not affect the avocado farming as a source of food for humans, being a good way of developing sustainable inhibitors. In addition, the high oil content (15–30%) that is present in the avocado fruit (Citation13), and the high production of this fruit in Mexico are advantages that favor the usage of avocado oil as an alternative to oleic sources.
2. Experimental procedure
2.1. Preparation of the inhibitor
An N-hydroxyethyl-imidazoline as inhibitor, based on avocado oil, was synthesized in the present study. For the synthesis of the inhibitors, avocado oil was extracted by mechanical method (pressing) from avocado waste. The synthesis of the amide was made by mixing N-2 (hydroxyethyl) aminoethylamine (11.99 g) and avocado oil (30 g) in a 250 ml flask in a molar ratio 3:1. Then, this solution was stirred during 2 h at 140°C. The complete formation of amide was observed by chromatography (Citation14). Finally, fatty amide was heated at 160°C during 12 h in vacuum, obtaining hydroxyethyl-imidazoline. The complete transformation was observed by chromatography method. The inhibitors were dissolved in 2-propanol (99.9% purity). The concentrations of inhibitor used in this study were 5, 10, 25, 50 and 100 ppm.
2.2. Preparation of the electrochemical cell
The electrochemical cell employed in this study consisted of a conventional three electrodes glass cell (standard ASTM G5). An electrode made of platinum was used as reference electrode and a graphite rod was used as counter electrode. The material used as working electrode (WE) was 1018 carbon steel. Before the tests, cylindrical specimens (4.55 cm length, 0.63 cm diameter) were ground to 600 grade emery paper, then these were first rinsed with distilled water and later by ethanol in an ultrasonic bath for 10 min. The glass cell was filled with a 3 wt% NaCl + 10% diesel solution, and saturated with CO2 gas bubbling prior (during 2 h) and during the test (24 h). The temperature of the test was 50°C. For each electrochemical test, a volume of 400 ml of fresh solution was used.
2.3. Electrochemical measurements
The electrochemical characterization was carried out by means of polarization curves (PC), open circuit potential (OCP), linear polarization resistance (LPR) and electrochemical impedance spectroscopy (EIS). For PC measurements, it was applied a sweep rate of 1 mV/s in a potential range of −400 to +700 mV versus the open circuit potential. LPR measurements were obtained by polarizing the specimens from −20 to +20 mV versus open-circuit potential at a sweep rate of 1.0 mV/s, meanwhile the polarization resistance (Rp) was measured from the slope of the potential–current curve in the vicinity of corrosion potential (Ecorr). The resistance (Rp) value obtained from the measurements was used to determine the inhibition efficiency. The open-circuit potential (OCP) of the working electrode was also studied. EIS was measured in an interval of frequency from 100,000 Hz to 0.01 Hz, applying an amplitude of −10 to +10 mV. LPR and OCP measurements were conducted every 60 min during 24 h. EIS measurements were made at different times (1, 3, 6, 9, 12, 18 and 24 h) until 24 h. A model PC4 300 Gamry potentiostat was used to perform the tests. After testing, corroded specimens were analyzed in an optical microscope.
In addition, to determine the interaction between the inhibitor and the 1018 carbon steel, a study of adsorption isotherms was carried out using the Langmiur model. To calculate the value of the surface coverage(θ), the LPR results were used, assuming a uniform corrosion process in the working electrode surface.
3. Results and discussion
3.1. Synthesis of the inhibitor
Fourier transform infrared spectroscopy (FTIR) is a characterization technique that is ideal for studying triglycerides and their reaction products as a whole (Citation14). shows the FTIR spectra of avocado oil, fatty amide and hydroxyethyl-imidazoline. The band centered at 3005.84 cm−1 is assigned to symmetrical vibrations with extension = C–H of alkenes located in the large chains of the oil. The bands centered at 2924.27 cm−1 and 2854.34 cm−1 are assigned to asymmetric and symmetrical vibrations, respectively, mainly with CH2 extensions. The band centered at 1744.83 cm−1 reflects the absorbance of the C = O carbonyl ester group of the triglycerides or phospholipids. The rest of the bands in the FTIR spectrum of avocado oil are located at 1461.93 cm−1 and 1377 cm−1, and are attributed to C–H and CH3 flexions of the methylene group, while bands located at 1278 cm−1, 1237.97 cm−1, 1168.34 cm−1 and 1095 cm−1 are attributed to the C–O extension of the ester group in the triglyceride molecule (Citation15). The FTIR spectra of the Fatty N-[2-[(2-hydroxyethyl)amino]ethyl]-amide derived from avocado oil () has a band at 3296.81 cm−1, which is assigned to the N-H of amine. A band located at 1644.36 cm−1 corresponds to the C = O extension of secondary amide. The band at 1554.35 cm−1 corresponds to the N-H group, and the band at 1461 cm−1 corresponds to the C–N extension of the amide (Citation14).
Figure 1. Infrared spectra of avocado oil, fatty N-[2-[(2-hydroxyethyl) amino] ethyl]-amide (fatty amide) and hydroxyethyl-imidazoline.
![Figure 1. Infrared spectra of avocado oil, fatty N-[2-[(2-hydroxyethyl) amino] ethyl]-amide (fatty amide) and hydroxyethyl-imidazoline.](/cms/asset/08ad0ff4-d3ad-46f1-9b45-a0f6eb9c4fe9/tgcl_a_1629698_f0001_oc.jpg)
Unlike the amide case, that shows two bands at 1644.36 y 1554.35 cm−1 (Citation16), the FTIR spectrum of imidazoline shows a band at 1603.07 cm−1, which corresponds to the C = N bond in the ring of imidazoline; interestingly, this band indicates the successful transformation of the amide to imidazoline (Citation6, Citation17). The bands at 2922.62 cm−1 and at 2853.01 cm−1 in the amide spectra and the band at 2923.34 cm−1 and at 2853.67 cm−1 in the imidazoline spectra correspond to the asymmetric and symmetric vibrations of CH extension in the lipids (mainly CH2). The band at 723.36 cm−1 also matches the three FTIR spectra (oil, amide, and imidazoline) that corresponds to the CH2 of methylene chains.
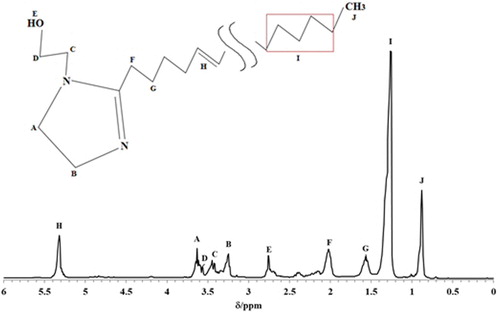
In addition, shows the 1H NMR spectrum (300 mHz, CD3OD) used for characterize the N-hydroxyethyl-imidazoline derivatives of avocado oil. This spectrum show one peaks at δ 0.88 ppm, which is associated with the (CH3) group. Also, it is possible to observe two peaks at δ 2.01 ppm and δ 1.58 ppm, which is related to the protons of group (m, −CH2, 4H), while the peaks at δ 5.31 ppm and δ 1.26 ppm show the protons of the alkyl chain group of fatty acids (m, −C = CH-, 2H). On the other hand, the peaks at δ 3.65 and δ 3.25 are associated with the protons of the imidazoline ring (m, −CH2, 4H). Finally, the two peaks at δ 3.43 ppm and δ 3.55 ppm are related to the protons in the pendant group (m, −CH2, 4H) (Citation18, Citation19).
Figure 2. H1 NMR (300 mHz, CD3OD) spectrum for N- hydroxyethyl-imidazoline derivates of avocado oil.
3.2. Polarization curves
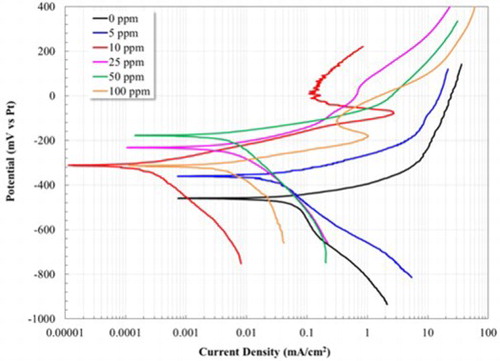
The polarization curves for the 1018 carbon steel electrode are presented in . In the absence of inhibitor, the anodic branch presents an active behavior, however, when reaching a potential of −291 mV, the icorr decreased. The deceleration of the anodic current density is due to the formation of Fe carbonates films (FeCO3) on the steel surface, which is likely partially protective since there is no passive zone. Regarding this result, previous studies have reported that, for prolonged exposure times, this film is not protective (Citation20–22).
Figure 3. Evaluation of the inhibitory effect at different concentrations (0–100 ppm) by applying polarization curves for the 1018 steel electrode in a 3% NaCl-10% diesel solution bubbled with CO2 at 50°C.
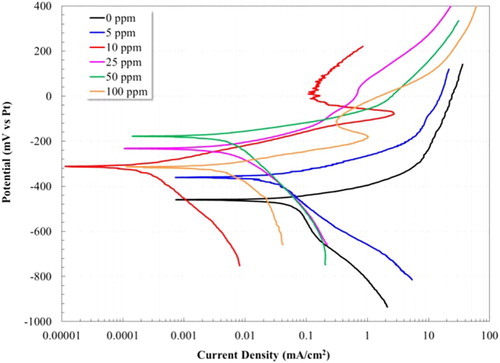
Once the inhibitor was added, the corrosion potential of the 1018 steel electrode turned to more positive values with respect to the same system without inhibitor. On the other hand, the current density value obtained for the 1018 steel without inhibitor (0.06300 mA/cm2) was higher than that obtained with inhibitor for all concentrations (see ). The lowest current density value was found after adding 10 ppm of inhibitor (0.000246 mA/cm2). The short displacement of the corrosion potential (Ecorr) towards more noble potentials and the reduction in the current density are evidence of the inhibitory effect attributed to the adsorption of the hydroxyethyl-imidazoline on the metal surface, forming a protective film and blocking active sites (Citation12, Citation20, Citation23). The addition of 10 and 100 ppm presented the formation of passive zones at the potentials of −79 mV and −185 mV, respectively. The improvement in the corrosion behavior of the steel in the present study can be associated with the enhanced properties of the passive film due to the interaction between the molecules of inhibitor and corrosion products, decreasing the anodic dissolution rate of the steel surface (Citation9, Citation24).
Table 1. Electrochemical parameters and efficiency obtained for the 1018 steel electrode using different concentrations of inhibitor at 50°C.
It is worth noting that, based on the calculation of the inhibition efficiency (IE(%)), it is observed that the optimal concentration of inhibitor is 10 ppm, turning out an efficiency value of 99.6% (see ). The inhibition efficiency (IE(%)) was determined from the current density, calculated by the Tafel extrapolation method, according to the following equation:(1)
(1) where ib is the current density of corrosion for the system without inhibitor, and ii is the current density of corrosion with the presence of inhibitor in the solution (Citation25).
3.3. Open circuit potential (Eocp)
presents the open circuit potential (Eocp) plot versus time for the 1018 steel electrode. In the absence of inhibitor, the corrosion potential presents an increase towards more positive values. Previous studies have reported that an increase in the corrosion potential values, towards positive ones, indicates the formation of a passive layer (Citation26). This fact is attributed to the formation of a Fe carbonate layer (FeCO3) that helps to mitigate the corrosion process (Citation21). It is worth mentioning that the minimum temperature required to obtain FeCO3 layer is 50°C (Citation27). However, after 17 h, there is a decrease in Eocp, meaning that probably the FeCO3 layer increases its thickness until 17 h, and subsequently, cracks down from the steel surface (Citation22).
Figure 4. Open circuit potential of a 1018 steel electrode in the absence and in the presence of inhibitor in a 3% NaCl-10% diesel solution bubbled with CO2 at 50°C.
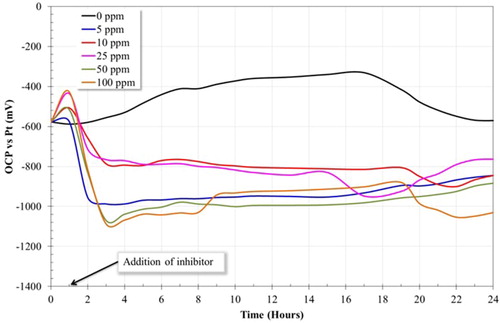
The present results reveal that the addition of the inhibitor into the aqueous medium produces a change in the Eocp curve. Particularly, once the inhibitor was added, the potential values decreased sharply towards more negative potentials. This behavior indicates that the inhibitor can be classified as a cathodic type one. It is well known that the change in the potential values of more than 85 mV with respect to potential that of the system without inhibitor is associated with those inhibitors that can be classified as anodic or cathodic type. If the difference between the potential values is below 85 mV, the inhibitor is classified as a mixed-type inhibitor (Citation27, Citation28).
It is known that the dissolution of CO2 in water produces carbonic acid (Equation (2)).(2)
(2) The H2CO3 allows to conduct the cathodic reactions that control the corrosion process (Citation10).
(3)
(3)
(4)
(4)
(5)
(5)
Inhibitors of cathodic type are able to suppress the cathodic corrosion reactions (Equations (3)–(5)), such as the hydrogen evolution reaction. That is, the inhibitor can be adsorbed on cathodic sites and competes with the hydrogen ions, therefore, it reduces the evolution of the H2 gas (Citation28).
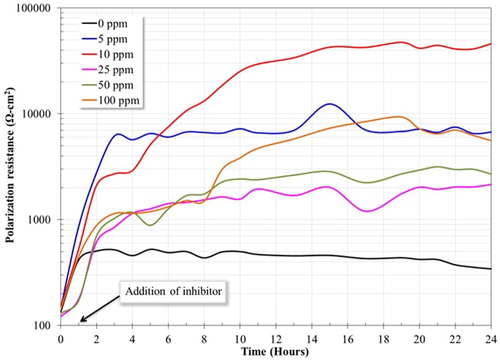
3.4. Linear polarization resistance (LPR)
shows the linear polarization curve for the 1018 steel electrode in the presence and in the absence of inhibitor. One can observe that the lowest polarization resistance was obtained without inhibitor. The corrosion process of the carbon steel in the presence of CO2 involves the anodic dissolution of iron and the cathodic evolution of hydrogen. The main anodic reaction, in the absence of inhibitor, is the dissolution of iron. This reaction is presented as follows:(6)
(6) During the corrosion process, an iron-carbonate layer can be formed on the steel surface according to the following reaction:
(7)
(7) When the inhibitor is added, using different concentrations, the corrosion resistance increased. This fact can be linked to the formation of corrosion products (FeCO3) and the adsorption of the inhibitor film on the surface of the material, both layers increased the corrosion resistance of the material. In addition, the saturation of CO2 in the electrolyte favored the adsorption of imidazoline type inhibitors on the surface of the material (Citation8). After 3 h of tests, it was observed a quasi-stable behavoir of the LPR curves of the 1018 steel electrode using different concentrations of inhibitor, exepecting for 10 ppm, which reached its stability after 16 h. The steady state of the corrosion process revealed the protective nature of the inhibitor, forming a film that can modify the properties of the metallic surface. Firstly, the inhibitor can block active sites in short periods of time, and subsequently, at longer periods of time, this can produce a geometric obstruction, that is, the effect of inhibition is originated from the reduction of the reaction area of the metallic surface (Citation20, Citation24). On the other hand, the test performed without inhibitor presented an unstable behavoir. Its worth mentioning that the highest polarization resistance was observed at a concentration of 10 ppm. This result is in agreement with the results obtained above in the polarization curves, therefore, it can be deduced that 10 ppm is the optimal concentration of inhibitor in the medium at 50°C. The inhibitory ability of the system is a function of the adsorption of the inhibitor on the metal surface, and this is a function of the chemical structure of the inhibitor, the type of metal and type of medium (Citation29). Previous studies reported that when the absorbed molecules of inhibitor exceed a certain number of atoms on the metallic surface, being these molecules remakably close, the electrostatic repulsion between the negative charge of the penadant group promotes the desorption of the inhibitor, leading to expose active sites on metal surface and, as a result, presenting low corrosion resistance (Citation20).
Figure 5. Polarization resistance of a 1018 steel electrode in the absence and in the presence of inhibitor in a 3% NaCl-10% diesel solution bubbled with CO2 at 50°C.
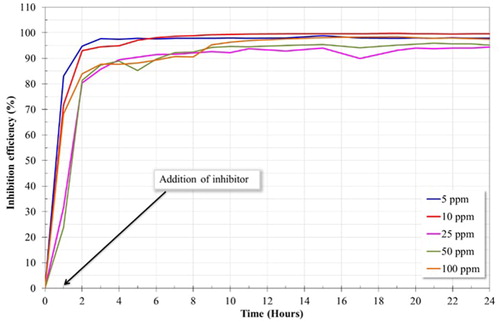
shows the inhibition efficiency (IE(%)) calculated from the experimental polarization resistance (Rp) data according to the following equation (Citation5, Citation12):(8)
(8) Where LPRi is the polarization resistance with the presence of inhibitor and LPRb is the polarization resistance without inhibitor. The highest inhibition efficiency (99.6%) () was obtained at 10 ppm. It is a good scenario to obtain high efficiencies at low concentrations of inhibitor since the medium is not substantially modified and the expenses associated with the addition of inhibitor are kept low (Citation30). These results reveal that the inhibitor has a high affinity for the metal surface since its adsorption on the electrode surface was relatively fast. It is also inferred that there is a formation of a protective film with excellent barrier properties.
Table 2. Electrochemical parameters of OCP, LPR and %IE for the 1018 steel electrode at different concentrations of inhibitor and at 50°C for 24 h.
Figure 6. Inhibition efficiency (IE) as a function of time obtained from LPR measurements.
3.5. Adsorption isotherm
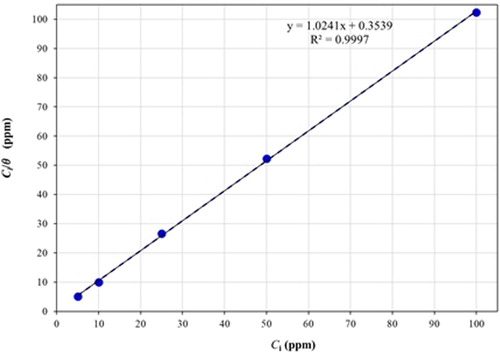
The adsorption isotherms provide information about the interaction between the inhibitor and the carbon steel surface. The type of interaction is influenced by the adsorption of the organic compounds, such as physical adsorption and chemisorption. The type interaction depends on the chemical structure of the inhibitor, the type of electrolyte, the state of charge and nature of the metal. There are different adsorption isotherm models, such as the isotherm of Temkin, Langmuir, Frumkin and Flory-Huggins (Citation31). In the present study, the Langmuir adsorption isotherm model was employed. This model is based on assumption that each site of metal surface have an adsorbed specie (molecule) (Citation10). To obtain the Langmuir isotherm, the LPR experimental data were fitted. The degree of surface coverage (θ) on the metal by the adsorbed inhibitor can be estimated from Equation (9).(9)
(9) The degree of surface coverage (θ) is related to the inhibitor concentration (Ci) by Equation (10) (Citation32). The value of Kads can be calculated from the interpretation of the line on the Ci/θ-axis ().
(10)
(10) Where Kads is the equilibrium constant of adsorption and is related to the standard free energy of adsorption
according to the following equation (Citation33, Citation34):
(11)
(11) Where “R” is the universal constant of ideal gases, “T” is absolute temperature and 1 × 10⁻⁶ is the concentration of water molecules expressed in mg/L (Citation30). When plotting Ci/θ versus Ci, a straight line with a slope value close to 1 was obtained (); on the other hand, the correlation coefficient (R2), calculated from linear regression analysis, had a value greater than 0.9997. Both the slope and the correlation coefficient values suggest that the inhibitor’s behavior obeys to the Langmuir model (Citation10, Citation23, Citation30, Citation32). Interestingly, the
value was of −40 kJ/mol; this negative value suggests that the inhibitor is spontaneously adsorbed on metal surface. The magnitude of this value also indicates an adsorption process carried out by chemisorption. Previous studies associated free energy values equal or above −20 kJ/mol with a physical adsorption process, that is, electrostatic interactions occur between the inhibitor and the metallic surface. On the other hand, free energy values around −40 kJ/mol or even more negative are associated with chemisorption process, that is, the charge is shared or transferred from organic species (corrosion inhibitor) to the metal surface to form a coordinated type of metal bond (Citation30, Citation32). However,
valules less negative than −40 kJ/mol are also associated to physical adsorption, commonly interpreted as the formation of a film adsorbed with an electrostatic character (Citation35).
Figure 7. Adsorption isotherm of the inhibitor on the 1018 carbon steel surface in 3% NaCl-10% diesel solution, bubbled with CO2 at 50°C for different concentrations.
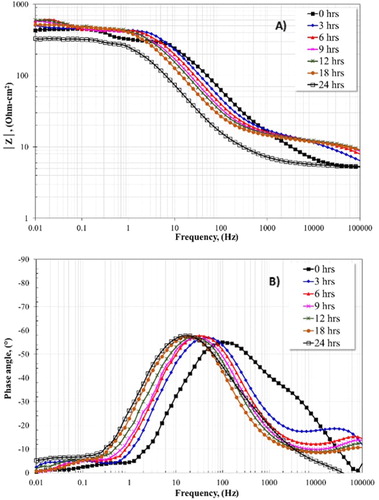
3.6. Electrochemical impedance spectroscopy (EIS)
shows Bode plots in both the impedance module (Figure 8(A)) and phase angle (Figure 8(B)) formats without the addition of inhibitor and for different times. (A) shows that the highest resistance was obtained at 9 h and 12 h. Afterwards, a decrease is observed, presenting the lowest resistance at 24 h. The angle phase shows the formation of a time constant at intermediates frequencies. Moreover, a change in the angle phase is observed towards low frequencies from 0 to 24 h. This change is associated with the thinning and/or detachment of the protective layer (FeCO3) formed on the steel surface (Citation14), It is possible that the iron carbonate layer remains on the steel surface by short periods of time, but it can detach as the time increases, presenting a higher corrosion rate at longer times. This behavior is in agreement with the result obtained in Eocp plot (Figure 4) where, at 17 h, the potential changed to active values. However, another fact that can explain the present results is the development of cracks in the oxide layer since, at 50°C, this layer is porous and non-homogenuos, allowing free access of corrosive species (H2O, H+, Cl− and ) (Citation29).
Figure 8. Bode plots for the 1018 carbon steel electrode in 3% NaCl + 10% diesel with CO2 at 50°C without inhibitor and for different times.
shows the impedance plots with and without inhibitor after 24 h of test. Interestingly, the Nyquist plot for the system in the absence of inhibitor (Figure 9(A)) presents the formation of a semicircle, indicating that the corrosion process occurred by charge transfer resistance. In addition, at low frequencies, the formation of one inductive loop was observed. This fact is associated with intermediates adsorption species, such as FeOH (Citation21). The Bode plot, in the phase angle format, shows the formation of one time constant, reaching an angle around 60°; this fact indicates that FeCO3 layer presented poor protective characteristics. In fact, it is well known that a phase angle of 90°, or closer, will have better protective characteristics. As a result, Bode plots, particularly, the impedance module (|Z|) shows that the lowest resistance was obtained for the system without inhibitor.
Figure 9. EIS plots for 1018 carbon steel in 3% NaCl + 10% diesel solution with CO2 at 50°C without and with different concentrations of inhibitor after 24 h.
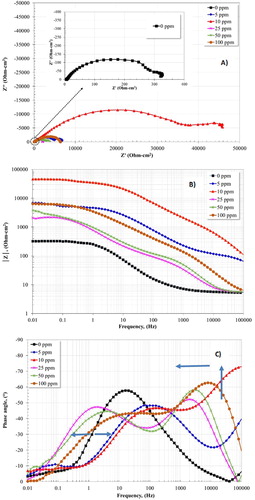
When the inhibitor is added, an increase in the corrosion resistance of the carbon steel is presented; this behavior is clearly observed in the impedance module |Z| (Figure 9(B)), where the highest resistance was obtained with the addition of 10 ppm of inhibitor. This value is higher with respect to the value obtained using the system without inhibitor. The highest resistance can also be inferred by the increase in the semicircle diameter of the Nyquist plot. The Nyquist plot presented a charge transfer process, perceiving the formation of one capacitive semicircle for all the concentrations evaluated. Moreover, the formation of inductive loops at low frequencies was observed. This fact is associated with an adsorption process of intermediates and inhibitor molecules that cover the metal surface (Citation21).
The angle phase plot shows the formation of two time constants for all the concentrations evaluated. The presence of one time constant at high frequency (100000 Hz) is attributed to formation of an inhibitor layer self-assembled on the carbon steel surface (Citation3). However, these time constants were displaced towards the region of intermediate frequencies with the increase of concentration. For example, the lowest concentration (5 and 10 ppm) of inhibitor presented the formation of one time constant (not well defined) in the high frequency region, displaying the highest phase angle value (73°) at 10 ppm. This fact is attributed with an increase in the thickness of the inhibitor layer formed on carbon steel surface, resulting in an increase in their protective ability (Citation14). Concentrations ranging from 25 to 100 ppm presented phase angle values that decreased and experienced a displacement towards intermediate frequencies. Likely, this displacement is associated with the desorption of the inhibitor layer due to an increase in concentration. This fact was promoted by electrostatic interactions among the molecules of inhibitor. Consequently, the best performance of inhibitor was obtained using 10 ppm. Previous studies have reported that the optimal concentration is a function of the packing efficiency of the molecules on the metal surface. When the inhibitor is not concentrated enough, there are unprotected sites, but when this is presented in excess is possible that electrostatic repulsion force (due to interaction between the surfactant tails) will occur, which prevent an efficient packing leaving unprotected sites on the metal surface (Citation3, Citation5). Other authors have reported that electrostatic repulsion can occur among the negative charges of the pendant group, which is part of the molecular structure of the imidazoline, resulting in the desorption of the molecules of inhibitor. This fact results in the promotion of unprotected sites, manifesting high corrosion rates (Citation22). Previous studies have also reported that the molecules tend to adsorb at right angle (perpendicularly adsorb) on the metal surface when adding high concentrations of inhibitor because of a repellent function between molecules. As a result, unprotected sites are present on the metal surface since the adsorption in the parallel direction can cover a larger area on the metal surface (Citation21).
On the other hand, the phase angle plot (Figure 9(C)) shows a second time constant in the intermediate frequency region. This time constant experiences a displacement towards the low frequency direction when the concentration ranges from 25 to 100 ppm. The presence of this time constant indicates the formation and evolution of the corrosion products layer, while the displacement is associated with its thinning (Citation3). On the contrary, the time constant observed for 5 and 10 ppm moves towards a high frequency direction, which is attributed to the adsorbed inhibitor, protecting completely the carbon steel surface.
The evolution over time of the EIS plots to the optimal concentration (10 ppm) is presented in . Figure 10(A) indicates a corrosion process dominated by charge transfer resistance. This result shows an increase in the semicircle diameter as elapsed time. The Bode plot in impedance module |Z| (Figure 10(B)) shows that the highest resistance was presented at 18 h. The phase angle plot (Figure 10(C)) displays the formation of two time constants for the different concentrations of inhibitor. These time constants are located in the high and intermediate frequency region. Interestingly, the presence of the second time constant is notable at 3 h due to the adsorption of inhibitor on the metal surface. The imidazoline-based inhibitors have higher adsorption energy than water molecules, that is, molecules of inhibitor are absorbed preferently on the metal surface, resulting in a high corrosion resistance (Citation23).
Figure 10. EIS plot for 1018 carbon steel in CO2 saturated-3% NaCl + 10 diesel at 50°C using the optimal concentration (10 ppm) of inhibitor and for different times.
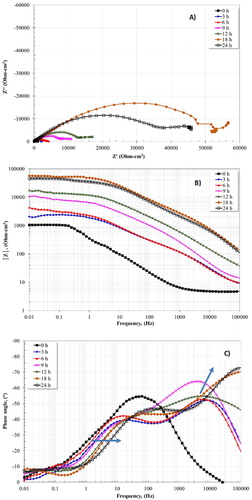
It is worth mentioning that previous studies using imidazoline-based inhibitors have observed that the addition of diesel (oil-like part) into the corrosive solution promotes the rapid adsorption of the inhibitors. This fact promotes the reduction in the corrosion rate and helps to increase the inhibition efficiency (Citation29). The time constant established at high frequencies is associated with a film formed of inhibitor on the metallic surface, meanwhile that time constant located at low frequencies is related to the corrosion products layer. The maximum value of the phase angle (73°) was presented at 24 h in the high frequency region. One can note that when the phase angle is increased as a function of time, in the high frequency region, it evolves towards a higher frequency direction. The time constant formed at intermediates frequencies also moves towards higher frequencies. This fact indicates the effect of inhibition in the dissolution process of iron, which is influenced by the adsorption of the molecules and indicates the union and self-assembly of the inhibitor film on the surface of the metal (Citation12, Citation14). The reactive sites of imidazoline molecules located in the imidazoline ring (head group) favor the preferential adsorption of the imidazoline ring on the metal surface by the formation of coordinated bonds with atoms on the metal surface (Citation21).
The inhibition efficiency percentages were calculated by using the resistance values of bode plot in the impedance module format |Z| at 24 h (see ). The results were obtained by using the Equation (12), where Ri is the resistance with the inhibitor and Rb is the resistance without the inhibitor. As shown in the results of EI% obtained by LPR. The results of EI% by EIS indicated that 10 ppm is the optimal concentration.(12)
(12)
Table 3. Electrochemical parameters of EIS resistance and %IE for the 1018 steel electrode at different concentrations of inhibitor and at 50°C for 24 h.
3.7. Analysis by SEM
Analysis by SEM () show the degradation experienced by the 1018 steel surface in the presence and in the absence of inhibitor. The enhanced corrosion protection provided to the 1018 steel electrode is attributed to the FeCO3 layer formed on its surface. The formation of this layer is a function of the limit of solubility of Fe2+ and ions, that is, when the concentration of ions is exceeded, they combine to form solid iron carbonate films (Equation 3). These films are formed due to a precipitation process; firstly, nucleation occurs on the metal surface, followed by the growth of the crystalline film (Citation36). However, there is also evidence that these layers do not cover completely the metallic surface, resulting in some unprotected areas and/or porous areas between the metal and the FeCO3 crystals (Citation37). In this study, in the absence of the inhibitor, the formation of a layer of FeCO3 was observed (see ). This layer presented cracks, which likely provided free access to the corrosive species (H2O, Cl−, H+,
), resulting in its detachment, and therefore a high corrosion rate.
Figure 11. Surface analysis of 1018 steel after being subjected to corrosion in the absence and presence of an inhibitor in a solution of 3% NaCl-10% diesel saturated with CO2 at a temperature of 50°C.
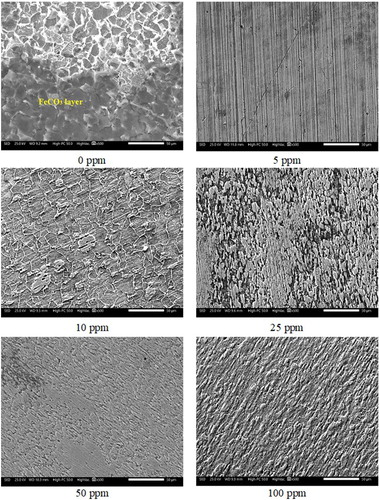
On the other hand, the addition of the inhibitor improved the corrosion resistance of the material. A more homogeneous surface on the metal is observed at 5 and 10 ppm. This is because a dense and homogeneous corrosion product layer was formed at these concentrations. This fact suggests that defects on the metallic surface were blocked (Citation9). It is worth mentioning that there is a good inhibitor protection on the metal surface, because the stripes produced by the roughing during the metallographic preparation were observed. However, a heterogeneous metal surface at 25, 50 and 100 ppm was observed. This fact is related to the adsorption of inhibitor, which depends on number of molecules adsorbed; that is, when molecules are too close, electrostatic repulsion can occur among them, leading to their desorption (Citation3). This phenomenon was explained more in detail in Section 3.6 (EIS). Due to the presence of unprotected sites, there will be interaction between the aggressive species on the metal surface, leading to the formation of carbonates and/or Fe chlorides. It is clear that a uniform corrosion process was carried out at all inhibitor concentrations, observing a major attack to 25, 50 and 100 ppm.
4. Conclusions
In the present study, imidazoline inhibitors based on avocado oil had a better performance compared to the performance presented in the absence of inhibitor. Interestingly, the optimal concentration was obtained at 10 ppm, resulting an efficiency of 99.6%. At higher concentrations, an electrostatic repulsion can affect the adsorption of the molecules, leaving the material unprotected. On the other hand, the optical analysis revealed that saturation of CO2 in the solution helped to the formation of corrosion products layers, such as iron carbonates (FeCO3). These layers contribute to mitigate the corrosion process. The formation of the FeCO3 and the adsorption of the inhibitor on the metallic surface helped to improve the protection against corrosion of the carbon steel. Therefore, one can deduce that the tested inhibitor is suitable to protect the carbon steel in presence of CO2, NaCl and H2O.
Supplemental Material
Download JPEG Image (63.3 KB)
Acknowledgements
O. Sotelo-Mazon is thankful to the postdoctoral fellowship DGAPA-UNAM. In addition, coauthors are gratefully with J. J. Ramos-Hernandez by SEM analyses realized.
Disclosure statement
No potential conflict of interest was reported by the authors.
Notes on contributors
O. Sotelo-Mazon is currently posdoctoral associate at the CIATEQ in Queretaro, Mexico. He obtained his M.Sc. and Ph.D. in Materials Science from the Universidad Autonoma del Estado de Morelos in 2011 and 2015, respectively. He carried out his first postdoctoral studies at the Universidad Nacional Autonoma de Mexico unit Instituto de Ciencias Fisicas in 2018. He has been working on the field of corrosion at high temperature, corrosion inhibitors, thermal spray and biomaterials.
S. Valdez-Rodriguez obtained a Ph.D. in Materials Science in 2005 from the National Autonomous University of Mexico. Following this Valdez worked as a post-doctoral, research associate and junior research fellow. Valdez is driven by an interest in developing an understanding of how processing and chemistries can deliver unique microstructures and properties for scientific studies and specific applications. The goal of Valdez's research is to combine knowledge about the fabrication, characterization with the functionality of solid-state materials to generate structural materials.
J. Porcayo-Calderon is a researcher at the Universidad Nacional Autonoma de Mexico. He obtained his Ph.D. in Chemical Sciences from the same University in 1998. He works in Corrosion Science and Engineering.
M. Casales-Díaz obtained a Doctorate in Material Sciences in 2001 at the graduate of the Advance Materials Research Center, Chihuahua, Mexico. Casales carried out postdoctoral studies at the UNAM Physical Sciences Center, and is currently working at the Institute of Physical Science of the UNAM, Casales performs electrochemical and corrosion inhibitors and preparation of synthesis of rare earth materials and incorporate polymeric materials to dope them and fabricate electro-wound membranes.
J. Henao is currently professor at the National Council of Science and Technology (CONACYT) unit-CIATEQ A.C. in Querétaro, Mexico, and is member of the mexican system of researchers (SNI) level 1. He is materials engineer from the University of Antioquia, Colombia, and obtained his master degree in high performance materials engineering from the University of Limoges, France. He also obtained his Ph.D. Degree in Advanced Technologies from the University of Barcelona, Spain. During the last years, he has been working on the field of thermal spray, biomaterials, and materials for energy and corrosion applications.
G. Salinas-Solano obtained his M.Sc. and Ph.D. in Materials Science from the Universidad Autonoma del Estado de Morelos in 2011 and 2015, respectively. He carried out posdoctoral studies at the Universidad Nacional Autonoma de Mexico in 2018. He has been working on the field of corrosion at high temperature, corrosion inhibitors and biomaterials.
J. L. Valenzuela-Lagarda is a research professor at the Universidad Autónoma de Guerrero, México. He obtained his M.Sc. in the area of Food Engineering at the Universidad Autonóma de Sinaloa, and his Ph.D. in Biotechnology at the Centro de Investigación en Alimentación y Desarrollo A.C, México. His research is in the area of biotechnology and engineering.
L. Martinez-Gomez is researcher at the Universidad Nacional Autonoma de Mexico. He obtained his Ph.D. in Metallurgy from the Stanford University, USA, in 1983. He works in Materials Science and Engineering.
ORCID
J. Porcayo-Calderon http://orcid.org/0000-0002-6943-3926
L. Martinez-Gomez http://orcid.org/0000-0003-3227-0067
Additional information
Funding
Related Research Data
References
- El-Lateef, H.M.A.; Abbasov, V.M.; Aliyeva, L.I.; Qasimov, E.E.; Ismayilov, I.T. Mater. Chem. Phys. 2013, 142 (2–3), 502–512.
- Chen, H.J.; Hong, T.; Jepson, W.P. Corros 2000, 35, 1–15.
- Porcayo, J.; Martínez de la Escalera, L.; Canto, J.; Casales, M. Int. J. Electrochem. Sci. 2015, 10, 3160–3176.
- Rani, B.E.A.; Basu, B.B.J. Int. J. Corros. 2012, 1–15. doi:10.1155/2012/380217.
- Porcayo, J.; Regla, I.; Vazquez, E.; Martinez de la Escalera, L.; Canto, J.; Casales, M. J. Spectro. 2015, 1–13. doi:10.1155/2015/184140.
- Liu, X.; Chen, S.; Ma, H.; Liu, G.; Shen, L. Appl. Surf. Sci. 2006, 253 (2), 814–820.
- Rivera, L.M.; Casales, M.; Martinez, L.; Gonzalez, G.; Ortega, D.M.; Regla, I.; Cardosos, J. Electrochem. Soc. 2011, 36 (1), 151–158.
- Porcayo, J.; Casales, M.; Rivera, L.M.; Ortega, D.M.; Ascencio, J.A.; Martinez, L. J. Chem. 2014, 1–10. doi:10.1155/2014/940579.
- Liu, X.; Okafor, P.C.; Zheng, Y.G. Corros. Sci. 2009, 51 (4), 744–751.
- Heydari, M.; Javidi, M. Corros. Sci. 2012, 61, 148–155.
- Heakal, F.E.T.; Elkholy, A.E. J. Mol. Liq. 2017, 230, 395–407.
- Okafor, P.C.; Liu, C.B.; Zhu, Y.J.; Zheng, Y.G. Ind. Eng. Chem. Res. 2011, 50 (12), 7273–7281.
- Pérez, R.; Villanueva, S.; Cosío, R. e-Gnosis 2005, 3 (10), 1–11.
- Porcayo, J.; Rivera, E.M.; Peza, C.; Casales, M.; Martínez de la Escalera, L.; Canto, J.; Martinez, L. J. Electrochem. Sci. Technol. 2017, 8 (1), 1–13.
- Castorena, J.H.; Rojas, M.; Delgado, R.; Robles de la Torre, R.R. Conciencia Tecnologica 2011, 42, 5–10.
- Martin, J.A.; Valone, F.W. Corros. 1985, 41 (5), 281–287.
- Wanga, D.; Li, S.; Ying, Y.; Wang, M.; Xiao, H.; Chen, Z. Corros. Sci. 1999, 41 (10), 1911–1919.
- Yoo, S.H.; Kim, Y.W.; Chung, K.; Baik, S.Y.; Kim, J.S. Corros. Sci. 2012, 59, 42–54.
- Salinas, G.; Porcayo, J.; Martinez de la Escalera, L.; Canto, J.; Casales, M.; Sotelo, O.; Henao, J.; Martínez, L. Ind. Crops Prod. 2018, 119, 111–124.
- Ortega, D.M.; Gonzalez, J.G.; Casales, M.; Neri, M.A.; Martinez, A. Mater. Chem. Phys. 2010, 122 (2–3), 485–490.
- Farelas, F.; Ramirez, A. Int. J. Electrochem. Sci. 2010, 5, 797–814.
- River, L.M.; Casales, M.; Regla, I.; Ortega, D.M.; Gonzalez, J.G.; Martinez, L. Int. J. Electrochem. Sci. 2012, 7, 13044–13057.
- Aribo, S.; Olusegun, S.J.; Ibhadiyi, L.J.; Oyetunji, A.; Folorunso, D.O.; Assoc, J. Arab Univ. Basic Appl. Sci. 2017, 24, 34–38.
- Valle, J.C.; Dominguez, G.F.; Gonzalez, J.G. ISRN Corros. 2014, 1–8. doi:10.1155/2014/945645.
- Rivera, L.M.; Casales, M.; Regla, I.; Ortega, D.M.; Ascencio, J.A.; Porcayo, J.; Martinez, L. Int. J. Electrochem. Sci. 2013, 8, 2419–2503.
- Gurrappa, I. J. Alloys Compd. 2005, 390 (1–2), 270–274.
- Al-Otaibi, M.S.; Al-Mayouf, A.M.; Khan, M.; Mousa, A.A.; Al-Mazroa, S.A.; Alkhathlan, H.Z. Arabian J. Chem. 2014, 7 (3), 340–346.
- Zhang, H.; Gao, K.; Yan, L.; Pang, X. J. Electroanal. Chem. 2017, 791, 83–94.
- Villamizar, W.; Casales, M.; Gonzalez, J.G.; Martinez, L. J. Solid State Electrochem. 2007, 11 (5), 619–629.
- Olvera, M.E.; Mendoza, J.; Genesca, J. J. Loss Prev. Process Ind. 2015, 35, 19–28.
- Badr, G.E. Corros. Sci. 2009, 51 (11), 2529–2536.
- Aljourani, J.; Raeissi, K.; Golozar, M.A. Corros. Sci. 2009, 51 (8), 1836–1843.
- Roy, P.; Karfa, P.; Adhikari, U.; Sukul, D. Corros. Sci. 2014, 88, 246–253.
- Umeron, S.A.; Obot, B.I.; Madhankumar, A.; Gasem, Z.M. Carbohydr. Polym. 2015, 124, 280–291.
- Quraishi, M.A.; Rafiquee, M.Z.A.; Saxena, N.; Khan, S. Prot. Met. 2008, 44 (1), 91–98.
- Nordsveen, M.; Nesic, S.; Nyborg, R.; Stangeland, A. Corros. 2003, 59 (5), 443–456.
- Palacios, C.A.; Shadley, J.R. Corros. 1991, 47 (2), 122–127.