
ABSTRACT
A simulator driving test (SDT) and two neuropsychological tests, the Useful Field of View (UFOV) test and the Test of Variables of Attention (TOVA) were evaluated with regard to validity for fitness to drive on 51 young clients diagnosed with attention deficit hyperactivity disorder (ADHD), 33 of whom also had autism spectrum disorder (ASD), and 38 adolescents without a neurodevelopmental diagnosis. The results show generally much greater variability and significantly poorer performance in the SDT and the TOVA for clients with ADHD/ASD compared with the control group. The SDT results were strongly intratest correlated, but had no interest correlation with either the UFOV test or the TOVA. The greater variability among clients with ADHD/ASD suggests greater effort and susceptibility to motivational issues and decline in sustained attention over several tests. In conclusion, the SDT is sensitive and has good face validity, and the TOVA is sensitive to neuropsychological aspects of safe driving. The SDT and the TOVA thus complement each other, and discrepancy between test scores calls for special consideration.
Introduction
In our modern society, driving a car promotes physical, social, and economic well-being for many people.Citation1 Even when other forms of transportation are available, driving often remains the most satisfying and preferred mode of travel mode.Citation2 Driving places heavy demands on the individual, with requirements defined by legislation and medical regulations.Citation3 In Sweden, people with neurodevelopmental disorders, the two most prevalent are attention deficit hyperactivity disorder (ADHD) and autism spectrum disorder (ASD), need a medical certificate that declares that they fulfill the medical requirements for a learner’s permit.Citation4 The prevalence of ADHD among Swedish adolescents and adults is about 3% and about 1% for ASD; co-occurrence of the two diagnoses is common.Citation5,Citation6
ADHD is characterized by functional impairments related to attention, hyperactivity, inattention, and impulse control, all of which may interfere with driving.Citation7 Driving entails great physical risks, and most traffic accidents are caused by human error, mainly mismatches between risk awareness, attention, and the traffic environment. Drivers with ADHD are associated with an increased risk of crashes and traffic incidents, but the driving behavior can be improved with medication.Citation7–9 Learning to drive safely may not be more difficult for youths with ADHD than their peers, but passing the written knowledge test for the driving license can be more challenging.Citation10 In contrast, for individuals with ASD, passing the written knowledge test is easier than passing the practical driving test. In a previous study, individuals with ASD required twice as many driving lessons and more on-road driving tests as individuals with ADHD.Citation10 Furthermore, it has been reported that drivers with ASD obtain their driver’s license later than those without ASD.Citation11 The reason may be that it is more challenging for them to interpret information from other road users and the traffic environment, which may affect their ability to detect hazards while driving.Citation12,Citation13 They may also have difficulties with informal rules such as understanding social cues and nonverbal communication with other road users.Citation14
In Sweden, medical practitioners are legally required to consider the medical aspects before a learner’s permit is issued.Citation4 The national regulations (from the Swedish Transport Agency) require specific skills to be considered in fitness-to-drive assessments for individuals with neurodevelopmental disorders, namely concentration, attention, inhibition, judgment, and the ability to follow rules.Citation4 A multi-disciplinary team may be involved in fitness-to-drive assessments, e.g., physicians, neuropsychologists, and occupational therapists, but there are no clear guidelines on how to assess adolescents with ADHD/ASD.Citation4 Cognitive tests are used, but those tests are often standardized for other diagnostic groups or provide no evidence in relation to driving.Citation10 Neurodevelopmental disorder is a broad term. The condition and impairments can range from mild to severe, and some individuals who are in between can be difficult to assess, because no gold standard procedure exists. Moreover, previous research has not always considered comorbidity and risk exposure.Citation15 Furthermore, it is unknown how much the impairment affects driving behavior, and what is considered sufficient or insufficient for safe driving. Thus, fitness-to-drive assessments for novice drivers with neurodevelopmental disorders are conducted in various ways in Sweden, involving decisions on which off-road tests are appropriate, and this entails a risk of inequality as well as a risk of misjudgments.Citation16 Thus, depending on where in Sweden the assessment is made, the chances of getting approved may differ, and the approval or rejection may in part be based on invalid conclusions from invalid test results on invalid tests with invalid norms.
Some cognitive tests are considered more valuable and useful for screening patients and for guiding clinical practice when determining fitness to drive, such as the Useful Field of View (UFOV) test.Citation17 The UFOV test is a PC-based visual and cognitive test of the visual field over which a person can process visual information, and the test performance relies on higher-order cognitive abilities as well as visual (sensory and perceptual) function.Citation18 The UFOV test has been associated with driving competence in older drivers in numerous studies.Citation19 Among older drivers, visual field loss from stroke is not uncommon, both diagnosed and undiagnosed. However, considerably less research has been done on this with regard to younger or novice drivers.Citation20,Citation21 Hypothetically and because of their reliance on higher-order cognitive processing, the functional impairments of ADHD related to attention, hyperactivity, inattention, and impulse control should be reflected in the performance in the UFOV test. The Test of Variables of Attention (TOVA) is a neuropsychological test of concentration, impulsivity, response time, speed of processing, and inattention.Citation22,Citation23 The TOVA has proven sensitive for identifying ADHD-like symptoms,Citation23 but was not developed as a tool for fitness-to-drive assessment. However, on-road assessments cannot be included because the assessment needs to be completed before a learner’s permit is issued. For clinical practice, fitness-to-drive decisions may be challenging for this group of patients due to lack of guidelines, evidence, and test norms.
In Sweden, a learner’s permit to drive a passenger car can be issued upon successful application at 16 years of age. When the candidate is 18 years old, a valid driver’s license can be issued after passing both the written knowledge test and the practical driving test. The requirements for medical certificates for driver’s permits among young people with neurodevelopmental disorders have become stricter over the years, but as there is a lack of evidence-based assessment tools, many current assessments are likely to be based on approximations.Citation10
Driving simulators are used in several countries during driving education, allowing the candidate to practice different traffic situations with varying degrees of difficulty.Citation3 Simulator programs contain specific traffic scenarios, such as a child playing by the road, or a moose that suddenly runs across the road, both of which pose risks. There are several advantages to using driving simulations. They enable reproducible driving conditions, and can be used for educational purposes as well as for tests of various aspects of driving proficiency – such as risk awareness – in a safe off-road environment.Citation24
The purpose of the present study was to improve fitness-to-drive assessments with a new method for combining, comparing, and evaluating test results from tests that are both sensitive to ADHD/ASD symptoms and complementary. Between-group differences in cognitive tests and driving behaviors among adolescents with ADHD/ASD and controls were investigated, and a Simulator Driving Test (SDT) was validated and compared against two validated neuropsychological tests (the UFOV test and the TOVA) with regard to sensitivity to symptoms associated with ADHD/ASD.
Methods
Participants
The patient group was recruited from a driving assessment unit in Sweden where they had been referred by their physician for a fitness-to-drive evaluation. The inclusion criterion was a confirmed diagnosis of ADHD. Most of the patients also had a confirmed diagnosis of ASD. Thus, the patient group is referred to as patients with ADHD/ASD. The exclusion criterion was a diagnosis of comorbid mild intellectual disability. None of the patients had driving experience; they were being assessed for fitness to drive and thus had not yet acquired a permit to practice driving. In total, n = 51 patients (36 males, 15 females; mean age, 17.9 years; standard deviation [SD], 2.5 years) were included; 33 (65%) had both an ADHD diagnosis and an ASD diagnosis, and 18 (35%) had an ADHD diagnosis only. No patient had ASD as a sole diagnosis; all participants with an ASD diagnosis also had an ADHD diagnosis. Of the 18 patients with ADHD only, 6 had inattentive ADHD type. About half of the patients (eight of those with ADHD only, 18 of those with ADHD and ASD) were taking medication prescribed for their ADHD/ASD diagnoses, such as methylphenidate, psychotropic medication, or a combination. In the invitation letter, they were instructed to take their medication as prescribed. No reward was given to the patients for participation in the study.
A control group (n = 38; 22 male, 16 female; mean age = 16.5 years; SD = 0.8 years) without a neurodevelopmental disorder or driving experience was recruited through personal networks and online advertising, stating the inclusion and exclusion criteria. They received a cinema ticket as compensation for their participation.
Before the data collection, all participants received both oral and written information emphasizing that their participation in the study would not affect their ability to obtain a learner’s permit. Consent was obtained from participants under the age of 18 years and their parents. The study was approved by the Ethics Review Board in Xxxxxxx (registration number XXX-XX).
Neuropsychological Tests
The participants were assessed during the course of a standard clinical evaluation of fitness to drive, which included two neuropsychological tests, the UFOV test, and the TOVA. These two tests were selected in the study because they are standardized tests with specific methods for administration and scoring, and are commonly used in clinical settings.
The UFOV Test
The UFOV test is computerized, takes about 15 minutes, and includes three subtests.Citation25 In the first task (processing speed), the participant identifies a car or a truck presented in the center of the screen for varying lengths of time. In the second part (divided attention), the participant identifies a car or truck as before, but also localizes a simultaneously presented car in the periphery of the screen, which is alternately positioned at eight different points around the screen. The third task (selective attention) is similar to part two but the objects in the periphery are embedded in triangles as distractors to make the task more difficult. The score represents the display speed in milliseconds (14–500 ms) at which the participant can perform the tasks correctly; lower scores indicate faster performance. The total score is the sum of the three parts; a higher score is indicative of poorer performance on the UFOV test.
The TOVA
The TOVA is also a computerized test and takes about 22 minutes to complete.Citation23,Citation26 During the task, one of two stimuli (a black square in a light-colored square) flashes on a computer screen. The participant is instructed to press a button on a microswitch every time the black square is positioned at the top of the larger square (correct response). The participant is instructed to inhibit their response if the black square is position at bottom of the larger square (non-target). The variables used in this study were (1) response time (mean time to correct response, i.e., processing and response time); (2) response-time variability (variability of attention); (3) commission errors (i.e., false positives, inappropriately responding to the non-target stimulus, indicative of impulsivity); (4) omission errors (i.e., misses, failure to respond to targets, indicative of inattention); and (5) the Attention Comparison Score (ACS), which is a measure of the participant’s overall performance compared with other individuals with ADHD.Citation22 The TOVA scores (i.e., 1–4) are normalized with regard to gender and age, and standardized for a mean of 100 and a standard deviation of 15, with higher scores indicative of better performance. The ACS is based on the sum of three z scores that are compared with the performance of an identified ADHD sample, namely from response time in the first half of the test, the d′ value from the second half of the test, and the total score for response time variability. Hence, the ACS has a mean around 0, and a standard deviation around 3. The lower the ACS (i.e., <0), the greater the indication of more severe ADHD symptoms.
The SDT
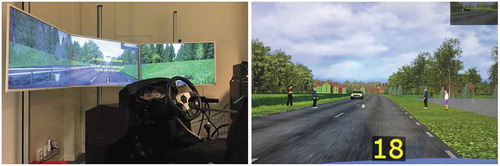
The SDT was included because of its face validity insofar as the simulated driving task entails most properties of real-life driving, but without risk of physical damage in case of collisions. The simulator hardware is based on steering wheel, pedals, and a dashboard from a Ford Focus, three 40-inch LCD monitors, and a surround sound system (, left picture). The simulated car is equipped with automatic transmission and thus requires no previous driving experience to be able to drive. However, the participants were informed of the basic traffic rules they needed to know in order to carry out the driving scenarios, such as to yield for pedestrians at pedestrian crossings, and how to adhere to traffic signs and speed limits. The program has a driving scenario (15 min) that includes 30 situations of varying criticality that are evaluated through a selection of performance indicators such as collisions, position, reaction times, speed keeping, time-based safety margins, and regulatory compliance (e.g., giving way to pedestrians). The program included various traffic environments, such as rural roads, highways, and a smaller urban city road. Initially, the participants were acquainted with the simulator by driving a 5-min route (country road). The drive was also used to detect any signs of simulator sickness. Thereafter, the actual data collection started.
Figure 1. The simulator (left) and an example of a scenario with children playing and a ball rolling across the road (right)
Objective Measures
There were three objective measures based on the driving log (i.e., all coordinates and speeds sampled at 20 Hz). The first measure was the number of collisions, based on 10 risky situations, as follows. (1) a pedestrian walking right to left on a pedestrian crossing; (2) a tractor turning out onto the main road from the right; (3) a ball rolling right to left from children playing on a rural road (, right picture); (4) a cyclist who the driver is expected to overtake; (5) a car from the left crossing over the road; (6) a car reversing from a driveway on the right in a suburban area; (7) a car from the right crossing over the road; (8) a car coming from right in a suburban area; (9) a pedestrian crossing the road from right to left; (10) a car in front braking abruptly on the freeway. The range was thus 0–10 collisions.
The second measure was the risk index, collisions excluded, based on the sum of 14 driving behaviors in terms of deviation from the speed limit, speed adaptation, overtaking, reaction times, distances from other road users, adhering to stop signs and obligation to yield, as follows: (1) speed through a suburban area, speed limit 30 kph; (2) speed on a highway, speed limit 100 kph; (3) overtaking a tractor; (4) speed by a school, speed limit 30 kph; (5) reaction time when a ball rolls over the road; (6) lateral position when overtaking a stationary bus; (7) speed when overtaking a cyclist, speed limit 50 kph but 40 kph deemed ideal to decrease risks; (8) lateral position to the same cyclist; (9) adherence to a stop sign; (10) reaction time to a car reversing from the right in a suburban area; (11) reaction time to a car from the right in a suburban area; (12) stopping for pedestrians by a pedestrian crossing; (13) overtaking a car aggressively on the freeway, with short clearance before lanes merge; (14) mean overall speed compared with the mean overall speed limit to increase the weight of speed variables. All 14 behaviors were weighted such that the higher the score, the less from ideal (i.e., the greater the risk of accident), with a value around 1 indicating great risk (Appendix A). Thus, the lowest (ideal) score was 0, and scores approaching 13 would indicate very risky driving, reflecting very poor risk awareness (or intentional violations of rules).
The third – and main – measure was the combined score from the number of collisions and the risk index. This is called the SDT z score and is the inversed standardized mean of the standardized scores (i.e., z scores) of the total number of collisions and the risk index. The standardization into z scores is performed by subtracting the individual score from the variable’s mean and dividing the difference by the variable’s standard deviation. The resulting z variables have distributions of scores identical to the original ones, but with the mean = 0 and SD = 1. The mean score based on the two z variables also inevitably has a mean = 0, but SD < 0 (unless there is a perfect positive correlation). Therefore, the mean of the two z scores was standardized also to achieve SD = 0. Finally, the score was inversed, such that positive scores indicate better performance and negative scores indicate poorer performance (as with UFOV and TOVA).
Ratings of Driving Behavior
The final measure of the SDT was the overall observer (investigator) mean rating of driving behavior, defined as the mean of the ratings of concentration, attention, inhibition, judgment, and ability to follow rules (scale 1–4, with 16 steps). The investigators for the simulator test were two specially trained driving assessors (occupational therapists, the first author and third author). They were both blinded to the patients’ fitness-to-drive assessment results (i.e., pass or fail, and the UFOV test and the TOVA tests results). The national regulations (from the Swedish Transport Agency) define the specific skills to be considered in the fitness-to-drive assessments for individuals with neurodevelopmental disorders, namely concentration, attention, inhibition, judgment, and the ability to follow rules.Citation4 The investigators assigned a score to each of these five skills determined by the most unsafe behavior observed during the driving. The scale is based on the instrument P-Drive and defined as a measure of the ability to drive safely or unsafely.Citation27 The participants’ driving behaviors were scored on a four-point rating scale based on the quality of performance; 4 = competent driving, 3 = questionable driving, 2 = a safety problem, and 1 = unsafe drivingCitation27 (Appendix B).
Procedure
The test session proceeded as follows. The participants were first interviewed about their situation, their perspective on the reason for being referred for assessment of their fitness to drive, their medical history, and they were asked to verify that they had not yet begun to practice driving. In most cases, one or both parents were present during this interview (about 25 min). The second part of the test session was the UFOV test (15 min) followed by the TOVA (20 min). Fourth, a debriefing and discussion took place about the test results and whether the referring physician would receive a recommendation that the candidate is fit to drive or not. The final stage was the SDT (25 min). In addition, there were breaks between all parts of the test session to reduce risk of fatigue.
Design and Statistical Analyses
The design was between groups. Homogeneity of variances was tested with Levene tests. Mean differences were tested with t tests‚ with Hedge’s g as standardized effect size. Ordinal-scale data were tested with Mann-Whitney U tests, with the rank-biserial correlation coefficient as standardized effect size. Strength of associations between variables was calculated by Pearson correlations (but Spearman correlations for ratings of SDT driving behavior), with t-tests of the null hypothesis that there is no correlation in the population.
Results
In addition to the following analyses, effect of medication for ADHD symptoms was tested by comparing the results for those in the patient group who had prescribed medication for their ADHD symptoms with those who had not. However, no significant result was found.
Mean Differences, Neuropsychological Tests
The UFOV Test
The patient group had greater variance on divided attention, but no significant mean differences were found for total score or processing speed, divided attention, or selective attention ().
Table 1. Descriptive and inferential statistics of UFOV scores.
The TOVA Test
The patient group had significantly greater variance and performed significantly and substantially worse than the control group on the ACS (). However, most individuals in the patient group performed within the normal range, with ACS < 0 (). As can also be seen in , the patient group performed worse with regard to response-time variability, response time, and omission errors, but no significant difference could be detected for commission errors. The Hedge’s g values indicate medium to large effects for the significant results.
Table 2. Descriptive and inferential statistics of the TOVA scores
Figure 2. Scatterplot of TOVA-ACS and SDT z-scores for the control and patient groups, with z scores based on performance of both groups combined
Mean Differences, SDT
Objective Measures
The patient group collided more often, had higher risk scores, and hence also poorer SDT z scores than the control group, with medium-sized effects (). The patient group also had significantly greater variance in the number of crashes, which affected the SDT z score (). In terms of increased risk of crashing at least once during the SDT, the (nonsignificant) odds ratio was 1.32 (CI95: 0.57; 3.06), implying greater risk for the patient group. In terms of the difference in crash risk between those who only had an ADHD diagnosis and those who had a dual diagnosis of ADHD and ASD, the (nonsignificant) odds ratio was 1.54 (CI95: 0.48; 4.90), implying greater risk for those with a dual diagnosis.
Table 3. Descriptive and inferential statistics for the objective measures in the SDT
Ratings of Driving Behavior
The mean score for the patient group (mean = 3.49, SD = 0.59) was significantly lower than that of the control group by a medium effect size (mean = 3.16, SD = 0.67), t(87) = 2.47, p = .02, g = 0.52, but the variances were not significantly heterogeneous. (The mean score was also tested with the Mann-Whitney U test; .) As can be seen in , the patient group performed worse with regard to concentration, attention, and judgment, albeit with small effect sizes, but no significant difference was found for inhibition and rule following.
Table 4. Descriptive and inferential statistics for ratings of driving behavior in the SDT.
Intratest Correlations, Neuropsychological Tests
The UFOV Test
As can be seen in , a moderate correlation was found between processing speed and divided attention for the control group, whereas moderate correlations were found between selective attention and divided attention, and selective attention and processing speed for the patient group. Because selective attention resulted in the longest response times, the sum score was most affected by this variable, hence the strong correlations between the sum score and selective attention.
Table 5. Intratest correlations for the UFOV total score and subtests
The TOVA
Generally, the TOVA variables were more strongly correlated (and had more instances of significant correlations) within the patient group than within the control group ().
Table 6. Intratest correlations for the TOVA scores
Intratest Correlations, the SDT
Objective Measures
As can be seen in , the number of crashes and the risk index (excluding crashes) were significantly correlated for both groups, albeit with a greater number in the patient group categorized as strong correlation.
Table 7. Intratest correlations for objective measures of driving performance in the SDT
Ratings of Driving Behavior
The pattern of correlation coefficients in shows that the five aspects of cognitive performance were generally moderately correlated with each other. For the patient group, the rating of concentration (variable number 2) had fewer significant correlations with the other variables.
Table 8. Intratest Spearman correlations for ratings of driving performance in the SDT
Intertest Correlations
As can be seen in , the SDT z score and the SDT mean rating score were significantly and strongly correlated for both groups combined and the patient group. For the control group, but not for the patient group, the TOVA overall score was significantly correlated with the SDT mean rating score. The UFOV total score was significantly correlated with the TOVA overall score, but only for the patient group.
Table 9. Correlations between the main measures from the SDT and the neuropsychological tests.
Discussion
The aim of the study was to investigate the between-group differences in cognitive tests and driving behaviors among adolescents with ADHD/ASD and controls, and to validate and compare the SDT against the two validated neuropsychological tests. The results showed that on the neuropsychological tests, the patient group with ADHD/ASD diagnoses performed generally more poorly and had greater within-group variance compared with the control group without neuropsychological diagnoses. This is in line with previous studies.Citation14,Citation28
With regard to driving performance on the SDT, the patient group with ADHD/ASD also had more difficulty with respect to the objective measures of driving behavior in terms of the number of crashes, the risk index, and the ratings of driving performance. The patient group also had greater variability in the number of crashes (and a tendency toward statistical significance for greater variability on the risk index, p = .07).
The strong correlation between the SDT z score and the SDT mean rating score (r = 0.73 for all 89 participants, and r = 0.80 for the patient group) can be regarded as a validation of the SDT. That is, the driving behaviors logged and combined into the SDT z score were also observed and scored by the investigators, who were experienced and had access to the enormous amount of data experienced during live interaction. Some driving characteristics emerged that were explicit to certain participants in the patient group. In several cases, the investigators noted poor driving behavior or lack of reflection during the complex scenarios that required more attention and concentration from the driver. A concrete example is the scenario in the suburban area, where several participants crashed or nearly crashed. In their defense, they were novice drivers, but some did not learn from the incident by adapting to a safer driving behavior during the remainder of the drive. Instead, they continued to drive without reflection or awareness of the driving environment where better attention and speed adaptation were needed. Difficulties in identifying challenges and risks have been reported previously among drivers with ASD.Citation13,Citation29 Moreover, some of our participants focused on less important details in the simulator program, such as the design of the surroundings and the trees in the forest next to the road. In addition, some dysfunctional driving behaviors were observed when interacting with fellow road users. For example, one participant got upset over the children’s behavior when a ball rolled across the road (, right side) and kept driving fast instead of slowing down. However, in contrast to previous studies, most of the participants with ADHD/ASD managed speed regulation and lane maintenance similar to the control group.Citation30,Citation31
To our knowledge, no previous studies have been published on TOVA with regard to driving. Because the TOVA (but not the UFOV test) differentiated between the groups, it appears to be the more sensitive of the two neuropsychological tests with regard to the difficulties that are essential to ADHD/ASD (especially deficiencies in sustained attention, which is a core criterion of ADHD). It, therefore, appears to be a more valid test for this population of patients than the UFOV test. The UFOV test is a standardized test for older adults,Citation32 and there is only limited empirical evidence that it can be used to discriminate younger adults with neurodevelopmental disorders.Citation28,Citation33 In this study, the means of both groups were within the normal range for young adults for both tests.Citation18
The SDT also differentiated between the two groups and has good face validity for evaluation of fitness to drive. It is therefore suggested that both the TOVA and the SDT can be valid and useful tests for assessments of fitness to drive for young candidates applying for a driving license, who also have an ADHD/ASD diagnosis. In addition, the experience and knowledge from the SDT can be beneficial to the individuals themselves and their relatives as a pedagogical tool to gain insight and knowledge before they obtain the learner’s permit.Citation29 However, the two tests have different task characteristics. The TOVA is stylized in comparison with the SDT, which is more realistic. Depending on personal preferences and interest, it can be easier to understand the purpose of either task and muster motivation to perform well. For instance, the TOVA can either be experienced as interesting and easy, due to its stylized graphics and structured rules, or it can be experienced as sterile, boring, and meaningless. The same applies for the SDT; it can be experienced as captivating, fun, and realistic or as too detailed, complex, and meaningless. In other words, both tests require the participant to understand the purpose of the task and how to perform the task and be motivated to perform well. The present results suggest that understanding of the purpose and motivation vary considerably more among young patients with ADHD/ASD than among adolescents without a neurodevelopmental diagnosis. Some participants with attention and concentration problems may find it too difficult to focus on these tests, and their motivation may therefore fail. It may be that a poor performance on either test reflects poor understanding of the purpose of the task, or poor motivation to perform, or a combination of both aspects, more often than it reflects the participant’s real performance level. Alternatively, performance on either test can be affected by temporarily impaired sustained attention as a consequence of having performed earlier tests. It is also possible that motivation and sustained attention interact. In other words, it is likely that many participants fail to do themselves justice on the tests. On the other hand, such failure to do oneself justice with regard to doing one’s best and being careful about the task at hand is crucial for safe driving in real traffic. In the test setting, it is more a question of how to clinically interpret the test results, and why test results for one patient may not match another. Moreover, it is not the diagnosis itself but the degree of the impairment that is crucial for safe driving. Thus, people with neurodevelopmental diagnoses can have varied difficulties and impairments that affect their driving. In addition, many individuals with ADHD/ASD may also have other diagnoses or problems that may affect their daily living. For example, they may have sleep-wake disorders, depression, or anxiety.Citation34
The observations during the testing suggest that the TOVA may be perceived as sterile, tedious, and boring by participants. Therefore, some participants may fail to muster motivation to perform. On the other hand, the simple layout may help others with neurodevelopmental disorders to find focus and perform well. For drivers with ADHD, attention deficits are associated with incidents in traffic, especially during monotonous driving.Citation35,Citation36 Moreover, the observations during the SDT suggest that some participants fail to realize the purpose of the task and drive as if it were a video game, not imagining the risks that would exist in real-life driving. Cognitive and emotional maturity (managing oneself and taking responsibility) is usually delayed for those with ADHD and ASD.Citation37 That is, they may not be ready to start their driver’s education at the age of 16 years. Starting their driving education a bit later may have a positive impact on, for example, impulse control, and may thus reduce unsafe driving behavior.Citation38
The combined results suggest that both the TOVA and the SDT have potential in fitness-to-drive assessments. Both tests are apparently sensitive to the neuropsychological problems associated with ADHD/ASD, but above all, their strengths and weaknesses may complement each other. presents a scatterplot for each group, with TOVA-ACS and SDT z score performance. Both variables are presented as standard (z) scores, based on the performance for both groups combined. The box in each scatterplot indicates ±2 standard deviations for the control group. Note that the control group had substantially smaller variation than the patient group (cf. also ).
As can be seen in , a relatively greater proportion of the participants in the patient group fell outside the box for the normal distributions for the control group, on both coordinates (i.e., the TOVA and the SDT). Further, many of these participants fell quite far outside the box, much lower. The most extreme cases in performed high on one test and extremely low on the other. Extremely uneven performance (e.g., if an individual has a difference greater than two standard deviations between the TOVA and the SDT, i.e., if TOVA-ACS z score − SDT z score > |2|) would suggest that understanding the purpose of the test or motivation was severely lacking during one of the tests. The discrepancy between test results may then warrant a follow-up test after a discussion with the participant. In , the individuals with a difference in scores >2 in absolute values are marked. The correlation was r = 0.39 (identical for both groups), p < .05 for both groups, when these outliers were excluded.
Figure 3. Scatterplot of TOVA-ACS and SDT z-scores for the control and patient groups; individuals with differences between z scores greater than two in absolute values are marked
The present study was not intended to establish norm data for clinical testing. However, SDT and TOVA scores below two standard deviations for the mean of the norm group (i.e., outside the box in ) may be regarded as a liberal criterion, and a score below this should definitely be taken as an indication that the candidate for a learner’s permit may not be fit to drive and should be more carefully assessed. Poor scores may reflect truly poor capacity, on the one hand, and lack of understanding of what the test is intended to measure or poor motivation to perform well on the other hand. However, if the candidate for a driver’s license lacks the ability to muster motivation to perform well on a test during the assessment, there might be a risk that this reflects a more general cognitive and emotional immaturity. Such candidates may not be fit to drive, because they may fail in the task-relevant cognitive abilities during on-road driving as well.
The two main limitations of the present study were that, first, the relatively small sample size did not allow for comparisons between candidates with a sole ADHD diagnosis and those with combined ADHD and ASD diagnoses. Second, more detailed diagnostic information was lacking with regard to severity of symptoms and which neurodevelopmental diagnosis was primary.
Further studies should investigate how the TOVA and the SDT predict on-road driving performance, for instance by following up if, and how efficiently, the candidates manage to obtain their license. Follow-up tests in case of discrepancies between test results should be included in such a study to evaluate the effects of understanding and motivation. Future studies should also seek to dissociate the effects of the different neurodevelopmental disorders by increasing the sample size such that those candidates with an ADHD diagnosis only can be compared with those with a dual diagnosis of ADHD and ASD. In addition, more detailed diagnostic information should be controlled for.
In conclusion, the SDT can be regarded as sensitive and valid with regard to behaviors indicative of fitness to drive among candidates for learner’s permits who are diagnosed with ADHD/ASD. The same applies for TOVA, but not for UFOV. Finally, the SDT and the TOVA can be regarded as complementary, and a large difference between test results for a candidate is likely to reflect poor motivation to perform, perhaps because of difficulties with sustained attention, and may warrant a follow-up test.
Declaration of interest
The authors have no conflicts of interest to report. The authors alone are responsible for the content and writing of the paper.
Acknowledgments
We express our sincere thanks to all who participated in the study. The study was funded by the Swedish Transport Agency and Stiftelsen Promobilia.
Additional information
Funding
References
- Selander H, Santos Tavares Silva I, Kjellgren FS, Sunnerhagen K. “The car is my extra legs”: experiences of outdoor mobility amongst immigrants in Sweden with late effects of polio. PLoS ONE. 2019;14:e0224685.
- Collia DV, Sharp J, Giesbrecht L. The 2001 National Household Travel Survey: a look into the travel patterns of older Americans. J Safety Res. 2003;34:461.
- Campos JL, Bédard M, Classen S, Delparte JJ, Hebert DA, Hyde N, Law G, Naglie G, Yung S. Guiding framework for driver assessment using driving simulators. Front Psychol. 2017;8:1428.
- Swedish Transport Agency. Code of statutes 2010:125. Norrköping, Sweden: Swedish Transport Agency; 2010.
- Nylander L, Holmqvist M, Gustafson L, Gillberg C. Attention-deficit/hyperactivity disorder (ADHD) and autism spectrum disorder (ASD) in adult psychiatry. A 20-year register study. Nord J Psychiatry. 2013;67:344–50.
- Idring S, Rai D, Dal H, Dalman C, Sturm H, Zander E, Lee BK, Serlachius E, Magnusson C. Autism spectrum disorders in the Stockholm youth cohort: design, prevalence and validity. PLoS One. 2012;7:e41280.
- Barkley RA, Cox D. A review of driving risks and impairments associated with attention-deficit/hyperactivity disorder and the effects of stimulant medication on driving performance. J Safety Res. 2007;38:113–28.
- Chang Z, Lichtenstein P, D’Onofrio BM, Sjölander A, Larsson H. Serious transport accidents in adults with attention-deficit/hyperactivity disorder and the effect of medication: a population-based study. JAMA Psychiatry. 2014;71:319–25.
- Randell NJS, Charlton SG, Starkey NJ. Driving with ADHD: performance effects and environment demand in traffic. J Atten Disord. 2002;24:1570–80.
- Almberg M, Selander H, Falkmer M, Vaz S, Ciccarelli M, Falkmer T. Experiences of facilitators or barriers in driving education from learner and novice drivers with ADHD or ASD and their driving instructors. Dev Neurorehabil. 2017;20:59–67.
- Daly B, Nicholls E, Patrick K, Brinckman D, Schultheis M. Driving behaviors in adults with autism spectrum disorders. J Autism Dev Disord. 2014;44:3119–28.
- Sheppard E, Ropar D, Underwood G, Loon E. Brief report: driving hazard perception in autism. J Autism Dev Disord. 2010;40:504–08.
- Silvi C, Scott-Parker B, Jones C. A literature review of the likely effects of autism spectrum disorder on adolescent driving abilities. Adolesc Res Rev. 2018;3:449–65.
- Patrick KE, Schultheis MT, Agate FT, McCurdy MD, Daly BP, Tarazi RA, Tarazi RA, Chute DL, Hurewitz F. Executive function “drives” differences in simulated driving performance between young adults with and without autism spectrum disorder. Child Neuropsychol. 2020;26:649–65.
- Vaa T. ADHD and relative risk of accidents in road traffic: a meta-analysis. Accid Anal Prev. 2014;62:415–25.
- Selander H. Driving assessment and driving behaviour [PhD thesis]. Jönköping (Sweden): Jönköping University; 2012.
- Korner‐Bitensky N, Sofer S. The DriveABLE competence screen as a predictor of on‐road driving in a clinical sample. Aust Occup Ther J. 2009;56:200–05.
- Owsley C, Ball K, Keeton DM. Relationship between visual sensitivity and target localization in older adults. Vis Res. 1995;35:579–87.
- Clay OJ, Wadley VG, Edwards JD, Roth DL, Roenker DL, Ball KK. Cumulative meta-analysis of the relationship between useful field of view and driving performance in older adults: current and future implications. Optom Vis Sci. 2005;82:724–31.
- Bennett DM, Gordon G, Dutton GN. The useful field of view test, normative data in children of school age. Optom Vis Sci. 2009;86:717–21.
- McManus B, Cox MK, Vance DE, Stavrinos D. Predicting motor vehicle collisions in a driving simulator in young adults using the useful field of view assessment. Traffic Inj Prev. 2015;16:818–23.
- Greenberg LM, Kindschi CL, Dupuy TR, Hughes SJ. T.O.V.A. clinical manual. Los Alamitos (CA): The TOVA Company; 2015.
- Schatz AM, Ballantyne AO, Trauner DA. Sensitivity and specificity of a computerized test of attention in the diagnosis of attention-deficit/hyperactivity disorder. Assessment. 2001;8:357–65.
- Campos JL, Bedard M, Classen S, Delparte JJ, Hebert DA, Hyde N, Law G, Naglie G, Yung S. Guiding framework for driver assessment using driving simulators. Front Psychol. 2017;8:1428.
- Edwards JD, Ross LA, Wadley VG, Clay OJ, Crowe M, Roenker DL, Ball KK. The useful field of view test: normative data for older adults. Arch Clin Neuropsychol. 2006;21:275–86.
- Greenberg LM, Waldmant ID. Developmental normative data on the Test of Variables of Attention (T.O.V.A.). J Child Psychol Psychiatry. 1993;34:1019–30.
- Patomella A, Caneman G, Kottorp A, Tham K. Identifying scale and person response validity of a new assessment of driving ability. Scand J Occup Ther. 2004;11:70–77.
- Classen S, Monahan M, Wang Y. Driving characteristics of teens with attention deficit hyperactivity and autism spectrum disorder. Am J Occup Ther. 2013;67:664–73.
- Cox DJ, Owens JM, Barnes L, Moncrief M, Boukhechba M, Buckman S, Banton T, Wotring B. A pilot study comparing newly licensed drivers with and without autism and experienced drivers in simulated and on-road driving. J Autism Dev Disord. 2020;50:1258.
- Classen S, Monahan M. Evidence-based review on interventions and determinants of driving performance in teens with attention deficit hyperactivity disorder or autism spectrum disorder. Traffic Inj Prev. 2013;14:188–93.
- Reimer B, Fried R, Mehler B, Joshi G, Bolfek A, Godfrey K, Zhao N, Goldin R, Biederman J. Brief report: examining driving behavior in young adults with high functioning autism spectrum disorders: a pilot study using a driving simulation paradigm. J Autism Dev Disord. 2013;43:2211–17.
- Ball K, Owsley C. The useful field of view test: a new technique for evaluating age-related declines in visual function. J Am Optom Assoc. 1993;64:71–79.
- Chee D, Lee H, Patomella A-H, Falkmer T. Driving behaviour profile of drivers with autism spectrum disorder (ASD). J Autism Dev Disord. 2017;47:2658–70.
- Gillberg C, Gillberg IC, Rasmussen P, Kadesjo B, Soderstrom H, Rastam M, Johnson M, Rothenberger A, Niklasson L. Co-existing disorders in ADHD: implications for diagnosis and intervention. Eur Child Adolesc Psychiatry. 2004;13:I80–92.
- Rosenbloom T, Wultz B. Thirty-day self-reported risky driving behaviors of ADHD and non-ADHD drivers. Accid Anal Prev. 2011;43:128–33.
- Biederman J, Fried R, Monuteaux MC, Reimer B, Coughlin JF, Surman CB, Aleardi M, Dougherty M, Schoenfeld S, Spencer TJ, et al. A laboratory driving simulation for assessment of driving behavior in adults with ADHD: a controlled study. Ann Gen Psychiatry. 2007;6(1):4.
- Berger I, Slobodin O, Aboud M, Melamed J, Cassuto H. Maturational delay in ADHD: evidence from CPT. Front Hum Neurosci. 2013;7:691.
- Thompson AL, Molina BSG, Pelham W, Gnagy EM. Risky driving in adolescents and young adults with childhood ADHD. J Pediatr Psychol. 2007;32:745–59.
Appendix A
SDT risk index: variables and weights
The SDT risk index is the sum of the following variables.
X, individual score; RT, response time, defined as sudden change in accelerator-pedal position, brake-pedal pressure, or steering wheel position. Overtaking: yes (1) or no (0). Stopping: yes (1) or no (0). Maximum score = 1 if no lateral distance.
Appendix B
Examples of scoring for driving simulation behavior