Abstract
In this paper, we detail the design and the implementation of an open source, server-side web mapping framework for the analysis of health data. The framework forms part of a larger project, the goal of which is to provide an analytical web geographical information system (GIS) that enables health experts to analyse spatial aspects of health data. The aim of the framework is to provide a method for the dynamic and flexible spatial visualisation of health data to facilitate data exploration and analysis. Consequently, a dynamic thematic web mapping technique, an extension to the Open Geospatial Consortium (OGC) web map service standard, was developed. The technique combines a data query, processing technique and styling methodology on the fly to generate a thematic map. The resulting thematic map represents a virtual map layer that enables a user to rapidly visually summarise properties of a data-set. A test web interface was developed to assess the efficacy of the web mapping technique. As the dynamic web mapping method builds on existing OGC web mapping standards, it can be readily integrated with the existing lightweight slippy map web clients and virtual globes.
1. Introduction
Through communication with a web map service (WMS) protocol server (www.opengeospatial.org/standards/wms, accessed 15 February 2012), a lightweight, web map client can be used to view and interact with map layers stored on the server. In this paper, we detail the design of an open source, server-side web mapping framework that seeks to extend the role of WMS and web-based geographical information system (GIS) to the analysis of health data. The framework provides a flexible and dynamic approach to spatial visualisation, initially concentrating on producing traditional univariate thematic map layers or choropleths.
Health data-sets have the potential to be both large and complex. For example, approximately one million hospitalisations occur within the state of Western Australia per year. Information visualisation can be applied to visually summarise the properties of such data-sets, to enable a user to examine underlying trends and perform comparisons. In this case, the visual summary takes the form of a thematic map layer generated by processing the data to produce summary statistics. To ensure full flexibility in the analysis, such thematic maps should be automatically generated on the fly, rather than restricting users to a set of pre-determined, pre-processed layers. Such an approach would give a user rapid access to highly customisable thematic layers. For example, the user can specify any spatial region and demography of interest, including an age range and gender, in effect enabling the user to access summary properties for all subsets of a data-set. Consequently, this paper proposes a thematic map server that combines the online semantic compression of spatial health data with web mapping for information visualisation. This facilitates access to summary properties of potentially large data-sets without requiring access to the actual data.
The map server framework provides a flexible method for information visualisation and represents the initial stage in a larger project. Information visualisation can be extended to visual analytics by combining multiple visualisations and modelling techniques and integrating multiple sources of information (e.g. socio-economic, demographic and environmental data). Thus, the goal of the larger project is to develop a web-based virtual laboratory for the analysis of health data. The overall aim of the virtual laboratory is twofold. The first is to enable health experts to analyse and mine information from spatial health data without expert GIS knowledge. The second, longer-term aim, is to increase the accessibility and sharing of information related to health not only with health users but, dependent on the nature of the data-set, also with the community at large, including non-health researchers and the general public.
The significance of this work to the Digital Earth is twofold. First, by extending the WMS open standard, the visualisation methods described in this paper can be readily incorporated into a virtual globe environment. For example, functionality to render WMS already exists in Google Earth and is being incorporated into webGL virtual globes. Examples include www.webglearth.org (accessed 1 December 2012) and the OpenLayers 3D project (github.com/jktaylor/openlayers – accessed 4 December 2012). Second, the framework represents an initial consideration of two factors that will influence the next generation of the Digital Earth (Goodchild et al. Citation2012), GIS functionality and information access. The framework facilitates data exploration through the calculation and the visualisation of summary health statistics for an area, generated on the fly. Furthermore, using this dynamic approach, the resulting visualisation can be altered according to zoom level and extent; that is, analysis can be automatically adjusted to the region of interest specified by a user's viewpoint. In addition to the long-term goal of increasing overall access to health information, the framework enables health researchers to circulate specific health information. Virtual thematic map layers conveying the desired information can be published as persistent WMS/WFS layers, thus facilitating general access.
While a WMS server enables a user to access data present in the map layers stored on the server, more complex approaches enable the filtering of the data. While both the approaches are appropriate for many applications, the goal of the current project is the analysis of properties of health data. Thus, not only is mapping filtered subsets of the data required, it is also necessary to visualise properties of the data-sets. For example, determining the rate of a disease within a population is a common epidemiological function; to calculate the rate requires the aggregation of multiple sets of data, indicating disease events and the underlying ‘at risk’ population. Consequently, the requirements for a WMS for the analysis of health data extend beyond the mapping of stored data layers. The system requires the flexibility to map the functional output of aggregated data, potentially using multiple data-sets. Thus, the framework moves beyond dynamically styling and filtering a map layer to the dynamic creation and subsequent visualisation of higher-level features of the data-set.
A server-side approach was used to implement the framework. Specifically, we extend the concept of a WMS to enable the dynamic generation of a thematic map. This extended WMS server comprises a bespoke map server that combines a data query, processing technique and styling methodology on the fly to generate the requested thematic map accessed through a REST API. The main advantages of using a server-side technique are: first, the smaller data transfer involved, a map (image file) is the only information passed to the client, the downloading of an entire, potentially complex and detailed data-set is not required; second, database servers are highly optimised to run queries, especially when combining data-sets; third, it allows access to results derived from potentially sensitive data-sets for analysis without such data being transferred to the client; compulsory rules and filters can be placed on the server, further restricting output where necessary.
A web GIS was developed to test the efficacy of the web mapping framework. Aspects tested include: data access, layer generation and access to legend information. The full implementation comprises: a database, a web server incorporating the functionality of the extended WMS and a client-sided interface. Due to the analytical nature of the application, robust mapping classifications and colour schemes were explored. The resulting web GIS incorporates spatial visualisation and data exploration into the web-based querying of health data.
The layout of this paper is as follows: Section 2 discusses background material. Sections 3 and 4 outline the design of the web mapping framework implementation and the web GIS implementation. Section 5 comprises three case studies, including an examination of the effect of altering the analysis resolution. This is followed by conclusion and future work (Section 6).
2. Background
2.1. Open source web GIS
As this paper proposes an extension to an open standard, the decision was made to implement the system, using open source software. The common aspects, or functionality, required for a web GIS comprise: data storage, a server to process and respond to requests and a client-side user interface. For web applications, the user interface generally consists of a slippy map running in a web browser. There are numerous open source packages that can be utilised to address each of these aspects (for a comprehensive list, refer to http://gislounge.com/open-source-gis-applications/, accessed 15 February 2012). The following open source libraries and packages were incorporated into the map server and web GIS described in this paper.
Due to the requirement of complex geometry query support, PostGIS (postgis.refractions.net/, accessed 15 February 2012), the spatial extension to PostgreSQL (www.postgresql.org/, accessed 15 February 2012), was selected for data storage.
Spatially enabled web development frameworks facilitate the inclusion of GIS functionality within web applications. GeoDjango (geodjango.org, accessed 15 February 2012) is an example of such a framework, combining multiple spatial libraries required for manipulating spatial data and support for PostGIS. As GeoDjango is written in the Python programming language, it facilitates the integration of other Python libraries within the server framework. Two such libraries are Mapnik (mapnik.org, accessed 15 February 2012), used for generating map images, and the Python Spatial Analysis Library (PySAL – pysal.geodacenter.org, accessed 15 February 2012), which provides spatial analysis functionality. Consequently, the map server was implemented using a combination of GeoDjango, PySAL and Mapnik.
The OpenLayers (openlayers.org, accessed 15 February 2012) JavaScript slippy web map client enables interactive mapping, using a web interface. GeoExt (geoext.org/, accessed 15 February 2012) is an extension or wrapper on OpenLayers, which enables tight integration with the Ext JavaScript libraries. The Ext libraries facilitate the development of complex web interfaces. Thus, Ext and GeoExt were adopted for developing the user interface.
2.2. Health web GIS and thematic map visualisation
While GIS is considered useful for examining of epidemiological data (Kamadjeu and Tolentino Citation2006), it is often under-utilised (Joyce Citation2009). Samarasundera et al. (Citation2012) provide a detailed overview of the use of GIS in health care. A number of web-based approaches for the spatial visualisation of health data have been proposed. Such approaches range from the mapping of results, such as specific disease outcomes or health care services (Foley et al. Citation2010) to providing interactive map layers corresponding to specific spatial data-sets (Cinnamon et al. Citation2009). Thematic maps in health-based web GIS are predominantly used either to present the results or to visualise a relatively static snapshot of a data-set (Samarasundera et al. Citation2012). While the latter approach is useful for increasing the awareness of spatial information within a health department, the scope for analysis of the data is limited.
Thematic maps can be generated from a map layer comprising of a set of polygon geometry data, generally representing a geopolitical or statistical boundary, along with a feature value associated with each polygon. When rendering the map layer, a map style is applied, specifying the colouring for each polygon according to its feature value. depicts a number of methods that have been utilised to generate thematic maps, including the approach proposed in this paper (d).
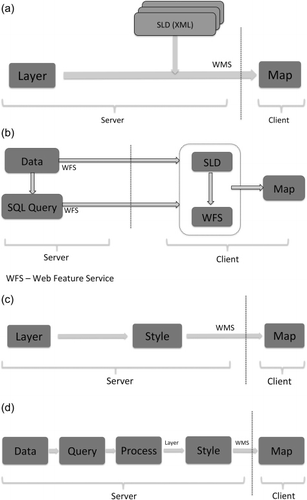
depicts a typical workflow for WMS thematic maps. For example, GeoServer (geoserver.org, accessed 15 February 2012) generates a thematic map by combining a feature layer with a Style Layer Descriptor (SLD) for the layer. The SLD specifies the colour for specific feature value ranges, which is then applied to the geometry features within the layer when the map is rendered. This is generally achieved by linking a layer to an Extensible Mark-up Language (XML) file containing the SLD, which is typically manually authored.
Increased interactivity has been achieved through rendering the thematic map on the client, using vector data returned from the server, using SVG (Kamadjeu and Tolentino Citation2006), KML (Yi et al. Citation2008) or GML (MacEachren et al. Citation2008), for example (). This approach incorporates the ability to perform basic data queries such as year range and can be extended to enable dynamic styling, allowing a user to choose a styling method and colour space for the map layer and then dynamically render the thematic map accordingly. The Mapfish Web Mapping Application framework (mapfish.org, accessed 15 February 2012) is an example of a development framework that facilitates this approach. However, if the data in the map layer remains unchanged, analysis using this approach remains limited.
represents a method for applying dynamic styling to thematic maps rendered on the server. An example of such approach, using open source software, was proposed by Evans and Sabel (Citation2012). This approach used a PostGIS database to store the map layer, GeoServer to render the map image and the Geothematics SLD server to apply the map classification method and colour scheme, selected by the user. Of note, Natural Breaks and Standard Deviation methods were included as map classification options.
While dynamic styling is desirable, an uncontrolled colour scheme may confuse the interpretation of the thematic map (Samarasundera et al. Citation2012); therefore a controlled colour scheme is preferable (Brewer and Pickle Citation2002), particularly for analytical applications.
Building on the dynamic styling methods, more complex web GIS applications are feasible. For example, by combining GeoServer with PostGIS, the feature layer can be stored as a table in a database, and thus updated, or changed as needed. Additionally, Open Geospatial Consortium (OGC) filters (www.opengeospatial.org/standards/filter, accessed 15 February 2012) can be applied to the features within a map layer. The Mapfish Web Mapping Application framework is an example of an open source approach that integrates filtering and dynamic styling within a single framework.
shows the workflow of the approach proposed in this paper. This approach differs from the previous approaches not only through the combination of server-sided querying and dynamic styling but also by including the functionality required to process the output of the query on the server.
While the design of the user interface is important (Bhowmick et al. Citation2008; Sutcliffe et al. Citation2011), a detailed discussion is beyond the scope of this paper. However, we note that an evaluation of the ESTAT desktop software for geovisualisation in epidemiology found the most positive user feedback related to the interactive and dynamic nature of the tool (Robinson Citation2007). This sets a benchmark for the degree of functionality that should be the eventual goal of web-based geovisualisation systems for health.
3. Map server
A bespoke map server was designed and implemented to act as a host for the extended WMS. Spatial visualisation offers a means of visually summarising potentially large health data-sets. To do this effectively, an approach is required that enables dynamic and flexible access to results obtained directly from processing the data, rather than using pre-defined map layers. Furthermore, the resulting visualisation should clearly convey the resulting information.
Consequently, the extended WMS map server proposed in this paper enabled a user to generate a thematic map layer by specifying a query, a process and styling information. That is, the extended WMS enables a customised, virtual map layer to be constructed on the fly, using user input to extract summary information from a given data-set. The resulting map image represents a specified visual summary of the data-set or a subset of interest within the data-set. Furthermore, to support the customisable analysis resolutions, the calculation of map classification over differing map extents was incorporated into the system.
When implementing the extended WMS server, it was decided that, where possible, functionality of the extended WMS protocol should mirror the original. For example, functionality should include the ability to query the data-sets available and to request a map and the corresponding legend for a map layer.
3.1. Design overview
A stateless client/server approach was decided upon for the implementation of the extended WMS server. While this will impact on performance, it does offer a flexible approach and mirrors the WMS OGC standard through an implementation that follows the REST protocol. The workflow through which the extended WMS server returns a virtual map layer () is as follows:
The required query is run over the data-set.
The required processing technique is applied to the result of the query.
The output of the processing technique is then used as input to the map style generation procedure. This procedure applies a map classification technique and colour scheme to dynamically generate the SLD for the thematic map.
The map is then returned to the user in the requested image format.
To achieve this process, further functionality is required, including in the following:
Details regarding the attributes of the metadata for the selected data-set used to determine the query.
The processing methods associated with the data-set.
The map classification and colour schemes available on the server.
3.2. System architecture
In order to assess the functionality and the concepts associated with the extended WMS server, it was necessary to develop a test system, comprising of a web GIS infrastructure. This infrastructure included: a spatial database containing a number of data layers along with their corresponding geometry layer and a web server hosting both the map server and the web interface. The web interface was used to assess the efficacy of the extended WMS server by facilitating interaction with the server.
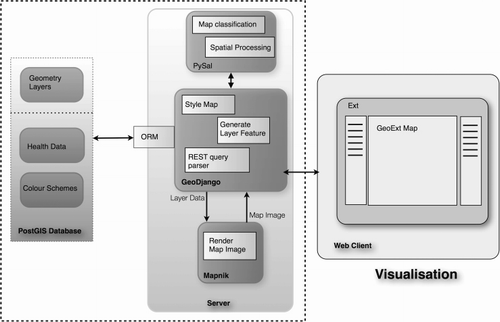
In this section, we detail the server-side architecture, which was implemented by integrating a number of open source components, shown in . The server consisted of two main modules:
Database: stores the map geometry layers and the data-set.
Server: contains the logic required to process requests from the client, acting as the interface between the client and the database.
3.2.1. Database
The PostGIS database was selected due to the high level of integration between PostGIS and the GeoDjango web development framework used to develop the map server (detailed in Section 3.2.2). The database was used to store both data-set and the metadata required to implement the extended WMS server.
Each data-set was split into non-spatial features and the associated polygon geometry features. The former was stored within a database table with each entry in the table containing an index to the original corresponding geometry feature. This method was used to reduce storage overheads due to the large number of features per polygon, as is the case with large spatial data-sets.
The metadata stored for each data-set were required to process and to interpret the querying of the layer. The metadata were used to determine the attributes and corresponding attribute types and the processing techniques available for the data-set. This approach was adopted due to the ease of data access achieved using the object relational mapping provided by GeoDjango. An alternative approach would be to store the metadata in XML files. Styling information, including the available colour schemes and map classification methods, was also stored as metadata within the database.
3.2.2. Web server
In designing the server module, the Model-View-Template (MVT) software architecture approach was adopted, as the MVT approach is well suited to implementing REST interfaces. The GeoDjango web development framework incorporates support for PostGIS into Django; this enables the server-side logic (View) to access and to query spatial data within a PostGIS database (Model) when responding (Template) to a REST query string.
In conjunction with GeoDjango, Mapnik was used to render the final thematic map image resulting from the data processing and map styling process, and the Exploratory Spatial Data Analysis toolbox within PySAL was used for both map classification (esda.mapclassify) and spatial processing techniques (esda.smoothing).
While many of the core WMS concepts were encapsulated in the implementation, the standard was extended to offer increased functionality. Using the MVT architecture, communication of information between the client and the server can be performed using either a mark-up language (XML) or a data interchange format (e.g. JavaScript Object Notation [JSON]).
3.3. Extended web map service implementation
In this section, we detail the implementation of the extended analytical WMS server protocols. In particular, we focus on the capabilities of the server, providing an overview of the implementation for each capability and the requirements for interacting with the functionality provided. Interaction with the server is achieved through REST queries and, for this implementation, the server either responds with a map image or a JSON object. The capabilities implemented include the ability to: get information on data stored in the database, get the properties of a selected data-set, generate a map layer and get the legend information for the generated layer.
3.3.1. Get data-sets
This function returns the available data-sets within the database. This method is analogous to WMS GetCapabilities but with available data-set being returned rather than layer information. No input arguments are required for this function.
The map layers are generated on the fly with respect to the data stored in the database. Where a map layer comprises of multiple heterogeneous features stored in a single table, each feature is represented by an individual data-set, and thus returned as an individual map layer. Data-set descriptions are also returned where applicable.
3.3.2. Get data-set properties
The get data-set properties function returns the information required to construct the analytical REST query string used to generate a map layer using the extended WMS server. The function takes a data-set name or index as input. The output comprises the information required to generate a virtual map layer, including the data-set attributes and processing properties along with the relevant properties related to thematic mapping, such as the styling options available.
Attribute properties consist of the name of the attribute, the attribute data type and how the attribute is queried. Examples of attribute properties are shown in . Processing properties consist of the analysis types available for the current data-set and determine the feature used to create the thematic map. The styling options consist of the choice of a map classification technique and the colour scheme to be used. This is analogous to generating an SLD on the fly. To increase both robustness and ease of use, reasonable defaults were specified for each layer property.
Table 1. Attribute property metadata.
3.3.3. GetMap
This function takes as input an extended WMS GetMap request string. The string contains the standard parameters contained in a WMS GetMap request, such as bounding box (BBOX), FORMAT, WIDTH and HEIGHT.
However, additional parameters can also be specified. These include a filter for each attribute or two in the case of a ranged query attribute and the processing technique to be executed. Additionally, the dynamic thematic map styling parameters can be specified, including the colour scheme and map classification method.
Furthermore, a styling extent parameter can be indicated. This extension to the WMS specification was required to perform dynamic styling at different resolutions, thus providing the flexibility required to perform analysis at different resolutions. Three such extent parameters were implemented: global, static or local. The relationships between the styling extent parameters and the corresponding styling resolutions are as follows:
Global: the map classification is calculated over the entire data-set extent (i.e. all polygons within the data-set's geometry layer).
Local: the map classification is calculated for the map extent (BBOX) specified by the WMS query. This option enables high-resolution analysis by restricting styling and, thus, analysis to the map extent on the web map client. The styling can then be changed dynamically as the user moves the map (pan or zoom). That is, the map classification is calculated according to the data subset currently being viewed by the user, resulting in an analysis of the current area of interest.
Static: the map classification is calculated for a specified extent, typically the map extent associated with the initial request. The extent subsequently remains static. This enables the map classification to be set for a specified area of interest, while allowing for panning and zooming.
The data subset resulting from the query is then used as input to the specified processing technique, producing the requested analysis as output. The combined query and processing technique produces a new feature, which is then associated with the relevant polygon geometry. This combination of polygon geometry and analysis feature is then used to produce a new, dynamic thematic map layer.
At the lowest level, the processing technique can simply return the data-set feature value; this is the case of a data-set corresponding to a map layer. If a query returns multiple values per polygon, more complex processing techniques can be applied to produce an aggregate feature for each polygon in the generated map layer. Examples of such processing techniques include standard aggregation and annotation techniques offered through SQL, such as Count and Sum. Using the aggregate data as the input to a function can generate more complex features. This method can include combining multiple data-sets or determining a property of the subset of data with respect to the data-set as a whole. For example, a simple epidemiological rate is calculated as the ratio of the events of a given disease to the underlying ‘at risk’ population.
The resulting map layer is then used as input to the styling method. This process consists of two stages. First, the map classification technique indicated in the input request is used to segment the layer feature space into n histogram bins. The feature space is determined according to the polygon boundaries that intersect with the styling extent. Second, the selected colour scheme is used to generate a colour for each bin; the colour is determined by divided the colour scheme equally into n colours; an RGB colour is then assigned to the corresponding feature space bin in the order of 1 to n. This output corresponds to the SLD for the thematic layer. If no styling method was selected, default classification and colour schemes are applied.
The combination of the thematic map layer, the SLD and the standard WMS protocol parameters are then used to generate a map image (e.g. a png file) of the thematic map layer. The WMS protocol parameters determine formatting, image size and map extent. The map image is then returned to the user in response to the initial REST request; this file can then be interpreted through a slippy web map client for interactive viewing or can simply be viewed or downloaded as an image file.
Mapnik was used to combine the map layer feature and styling information, along with the WMS protocol parameters, to render the map image. A significant speed up can be achieved when a user zooms in; thus, by only rendering the layer features and polygons for those polygons that intersect with the map extent, processing complexity can be reduced.
3.3.4. Get Legend
The Get Legend function of the extended WMS server returns the information required to render the legend for the thematic map layer. The method receives as input the same bespoke query, processing and map styling parameters required by the GetMap function. The Get Legend function also follows the same query, processing and styling workflow as the GetMap function. Get Legend differs in the information returned to the client; rather than returning a map, the map layer styling information is returned, including the following:
The upper and lower bound for each feature histogram bin resulting from the map classification.
The histogram count for each bin.
The colour for each bin, specified in RGB, accounting for the opacity of the map layer.
Extended information regarding the generated map layer.
3.4. Dynamic map styling
A number of options were made available for map styling. Such options included the choice of map classification technique, including a number of clustering techniques, along with an optimal classification technique. In addition, the user was able to select the number of histogram bins the feature space is classified into and the colour scheme to be applied to the thematic map.
Selected map classification techniques from PySAL esda.mapclassify library (pysal.org/library/esda/index.html, accessed 15 February 2012) were incorporated into the map server. The techniques included: Natural Breaks, the Fisher Jenks (presented as Natural Breaks – Optimal) and Jenks-Caspall algorithms, quantiles, maximum breaks (presented as Boundaries), standard deviation and mean (presented as Normal Distribution) and Max-P classification (presented as Regionalisation). In addition, an Optimal Clustering option was added, which calculated the map classification across a number of clustering techniques, using multiple histogram bin numbers, in order to optimise the intra-class variability in comparison with the feature space variability (the esda.mapclassify.k_classifiers algorithm). This method returns an optimal map classification technique along with the number of histogram bins.
The colour schemes used consisted of selected ColorBrewer colour schemes (Brewer Citation2012), extended to incorporate 256 colour intervals. The ColorBrewer colour schemes represent robust colour spaces for interpretation of the thematic map and have been widely adopted. However, it was necessary to extend the colour schemes beyond the default of nine in order to accommodate the optimal clustering algorithm. The colour scheme extension also enabled a high resolution to be used for equal interval map classification, for example, 256 colour intervals.
4. Implementation of the web GIS
In this section, we discuss the implementation details of the web GIS test environment that was developed to assess the efficacy of the extended WMS server. The aspects of the map server the web GIS interface was designed to test include: data access, map layer generation comprising of querying, processing and styling and the access and presentation of the map legend. The web interface allowed a user the option to select a data-set from the database for analysis and specify a query, processing technique, map classification and colour space, with options relevant to the data-set. Subsequently, the interface enabled the user to interact with the generated map layer.
4.1. Web interface
The interface was made up of three main elements: the left panel displaying the available data-sets, the middle panel the map, and the right panel information to the user, such as the map legend.
The web interface was implemented using the combination of the Ext JavaScript library (www.sencha.com, accessed 15 February 2012) and GeoExt. Ext facilitates a modular design and comprises of interface elements that move a web page closer to a desktop application while allowing a high degree of customisation.
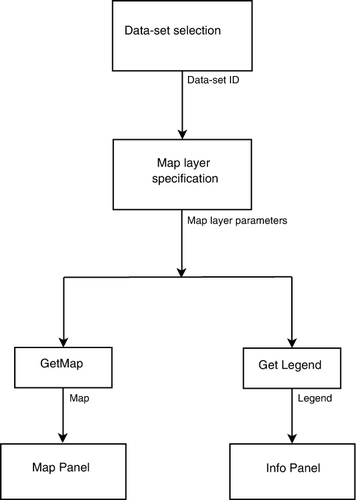
The analytical workflow to generate a thematic map using this technique is shown in . First, as the web page is initiated, the Get data-set function is accessed, returning a data tree representing the data sources and data-sets available within the database. The user then clicks on a node in the data tree, which triggers a call to the Get Data-set Properties function for the selected node. The subsequent information returned is presented to the user via a web form window. The form enables the user to select the appropriate query, processing and map styling methods for the required analysis, including the map classification and colour scheme selection.
Submitting the form triggers two actions. First, the form parameters are added to a WMS layer within OpenLayers, which, on adding the layer to the map, calls the extended WMS servers GetMap function. Second, the form parameters are used to call the Get Legend function; the legend table is then displayed in the right panel of the user interface. The legend table is used to display the lower bound, count and colour associated with each histogram bin. When using the local extent styling method, Get Legend is called each time the users perform a pan or a zoom. That is, the legend information is dynamically updated to reflect the new analysis extent.
The OpenLayers JavaScript client and, consequently, GeoExt incorporate the functionality to add a WMS layer directly to the map by initiating a WMS layer object (OpenLayers.Layer.WMS) and, subsequently, adding it to the OpenLayers.Map object on the client. We leveraged this functionality to add an extended WMS layer to the client. This was achieved by injecting the selected query, processing and styling parameters into the standard WMS layer as supplementary parameters. When a layer is added to the map, these parameters were included in the REST GetMap string that requests the map image from the map server. Thus, the WMS capabilities within OpenLayers were adapted to the REST interface elements of the extended WMS server in order to integrate the map server with the client. The only condition required for this approach to work is the ability to inject extra parameters into the WMS GetMap request string.
4.2. Usability
In this section, we examine usability with respect to the generation of thematic maps. The interface employed common, well-understood concepts to assess the efficacy of interacting with the extended WMS server. Thus, the data-sets stored in the database are accessed through a file tree type interface and the query, processing and styling options for a layer were chosen using a form layout. The subsequent REST query string that returns the map image was generated on the client using the form input. For example, in choosing an age range, the user inputs numbers corresponding to the lower age and upper age search range. For list properties, such as a gender attribute, processing type, colour scheme and map classification method, a drop down combo box was used.
Consequently, a user can access a map image without having knowledge of the REST interface protocols required to generate it. This enables access to results calculated from potentially large data-sets without requiring a user to have knowledge of the database schema used or the SQL required to interrogate the data.
5. Case studies
In this section, we detail the data-sets incorporated into the map server and examine a number of case studies investigating characteristics of the proposed system. The first two case studies examine the effect of the choice of dynamic styling options on the resulting thematic maps. The third examines use cases incorporating health data, demonstrating the rapid access to analysis results that can be facilitated by the map server.
5.1. Data
Three types of data-sets were imported into the PostGIS database. Two data-sets were extracted from the Australian Bureau of Statistics (ABS) data covering Western Australia, aggregated at the statistical local area (SLA) level. The third data-set comprised of synthetic hospitalisation data for the state of Western Australia. These data simulated typical hospitalisation data over the period of one year and were stored as unit record data with one record per hospitalisation incidence. The data were spatially aggregated to the SLA level, which corresponds to the spatial resolution currently available to the Epidemiology Department at the Department of Health, WA (DoHWA).
The first type of data-set comprised of demographic information and consisted of the following:
Demographics by age: population counts categorised by age, determined over yearly increments, along with gender, labelled as Male, Female or Persons (both male and female).
Count: sum of the number of people in each SLA.
Crude rate: ratio of the sum of a subset of the population in an SLA to the total population of the SLA.
Empirical Bayes rate: a smoothed version of the crude rate, calculated using PySAL (the esde.smoothing.Empirical_Bayes algorithm).
The second data-set type consisted of a number of high-level statistics calculated for the SLA. In this case, each statistic is considered as an individual data-set and, thus, map layer. The data-sets included: average household size and number of people per bedroom; and median values for family, household and individual income per week, rent per week and household mortgage per month. As there is only a single value for each data-set for each SLA, the only processing option offered for this data-set is termed Value. That is, the value for the feature is returned. This is essentially equivalent to mapping a WMS layer corresponding to the data-set without querying the data.
The health data consisted of approximately 700,000 hospitalisation unit records categorised by International Classification of Disease (ICD-10) codes. The data were spatially aggregated to the SLA, that is, each unit record contained an index to the appropriate SLA geometry. The ICD-10 codes take the form Cx.y; for the purpose of data access the disease chapters, C, was used as individual data-sets, and codes x and y were termed major code and minor code attributes, respectively. Consequently, in generating a virtual layer, a user initially selects the disease chapter of interest and then formulates a query specifying a subset of data of interest, using the form interface. The query attributes available comprised: major code, minor code, age, gender and hospitalisation date. The processing options incorporated common epidemiological functionality, such as the calculation of age standardised rates (ASR) and rate ratios. The complete functionality includes: disease counts, crude and empirical Bayes rates, crude age standardisation, indirect and direct ASR, and the direct age standardised rate ratio and the uncertainty for the direct age standardised rate. The returned disease counts comply with the current DoHWA privacy convention of suppressing counts between one and five. For rate calculations, the ‘at risk’ and standard populations were automatically calculated using the ABS demographic data.
5.2. Adjusting analysis resolution
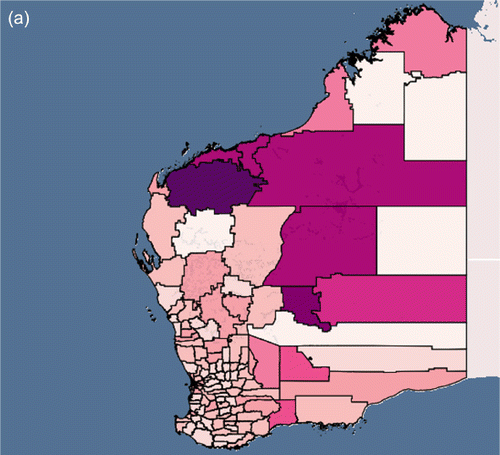
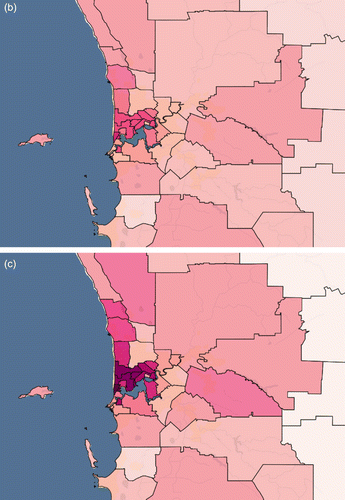
This section details the properties related to the choice of styling extent through the use of a case study for the Median Individual Income. Adjusting the styling extent corresponds to adjusting the analysis area of interest. This is particularly useful where extremes in the data-set occur outside this area of interest. – show the Median Individual Income styled globally for the state, styled globally for the main metropolitan area and styled locally for the metropolitan area, respectively. In this case, the extrema for the feature space occur outside the metropolitan area, despite the population in Western Australia being concentrated around the metro area. Consequently, using global extent styling, results in a reduced analysis resolution if the metropolitan area is the region of interest.
Figure 4. (a) Thematic map of the state for the Median Individual Income, styled globally for the state. (b) Thematic map shown in (a), zoomed to the metropolitan area. (c) Thematic map shown in (b), styled locally, for the metropolitan region.5.3. Map classification
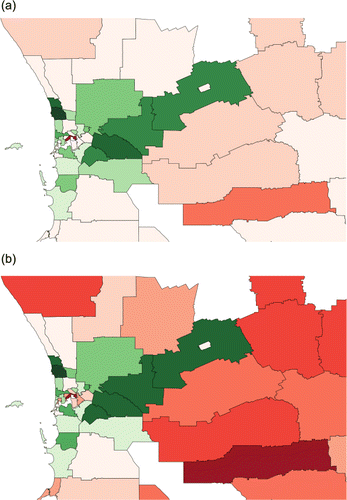
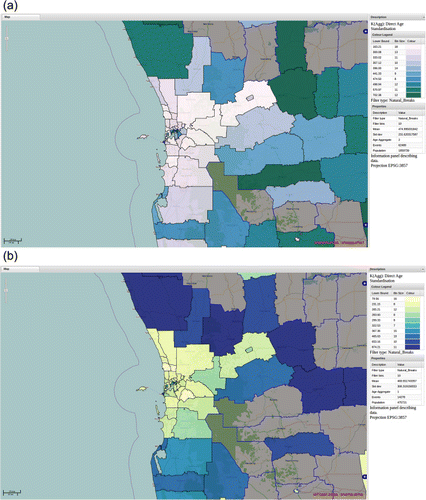
shows the effect of applying differing map classification techniques on the output visualisation. The thematic map displayed in the figure corresponds to the ASR Ratio, styled using a divergent colour scheme, with green used to represent values equal to or less than one and red values above one. depicts the rate ratio styled using the Equal Intervals map classification technique, while was styled using the Natural Breaks technique. Due to the Equal Intervals technique using the extrema of the feature set to segment the feature space, the presence of outliers can reduce the clarity of the information depicted in the thematic map. Consequently, this classification technique has the potential to reveal less information regarding the underlying distribution of the data (Samarasundera et al. Citation2012). The Natural Breaks classification technique is less affected by the presence of outliers; thus, the colour gradient is more reflective of the underlying distribution.
5.4. Spatial visualisation of health data
In this section, we examine two use cases for the health data, covering information access and data analysis.
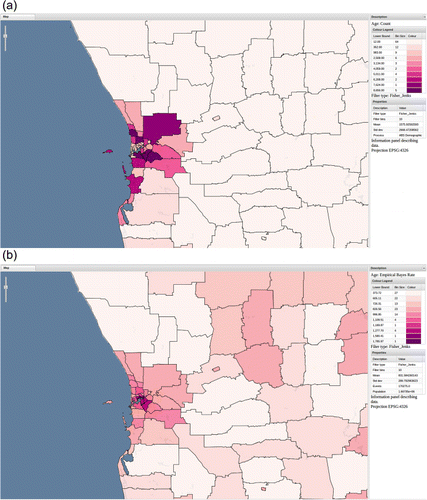
The first use case is an information access example. A service provider needs to be aware of counts for regions in order to guide the placement of facilities. This information can be further refined, where necessary, by focusing on specific demographic groups. While this information can be readily accessed and presented visually, as counts are not normalised, comparisons between regions on a thematic map are not possible. Thus, while visualising counts may highlight regions of interest, it represents a potentially misleading method of presenting the information and is open to misinterpretation. For example, – shows the difference between presenting the raw count for the 18- to 24-year-old demographic and the count as a proportion of the underlying population. One solution for this problem would be to adapt the extended WMS server to be a web feature server, which would enable the presentation of the information in the form of a table. In this manner, the proposed system can be extended to information extraction.
The second use case corresponds to one of the end goals for the overall system: facilitating access to results related to an epidemiological analysis workflow, incorporating spatial visualisation. shows the direct ASR for diseases of the digestive system (ICD-10 Chapter K), and displays the results for the 18–35 age demographic. The analysis results were generated by selecting the appropriate disease chapter and then submitting the resulting form, customising analysis according to the age range, gender and time period of interest. This represents an automation of a common epidemiological workflow, enabling quick access to analysis results.
6. Conclusion and future work
In this paper, we propose an analytical extension to the WMS protocol that enables a web GIS to be used as an analytical platform for health data. An extended WMS map server was implemented that enables a user to query, process and dynamically style data stored in a database. A web GIS was developed to test the effectiveness of deploying the analytical map generation technique using a web interface. It was found that, through mirroring existing WMS protocol functionality, a relatively simple, yet powerful, interface could be produced to enable a user to generate thematic maps. The use of a web GIS has the advantages of offering ease of access to data, while enabling a high degree of customisation in accordance with not only the health researcher but also the research task.
The proposed approach will, in some cases, be slower than a traditional WMS server. However, this is qualified as the method represents a comparatively efficient and accessible means for an epidemiologist to analyse spatial health data. Furthermore, the approaches proposed in this paper offer a great deal of flexibility when processing spatial data. For example, the extended WMS server framework can readily be extended to incorporate a Web Feature Service (WFS) server, returning a polygon with an associated feature set, resulting from processing a layer query. Furthermore, due to the modular nature of the styling implementation, the approach can be extended to the dynamic styling of WFS data. For example, a user could upload a GML, or GeoJSON, file to the server, comprising polygon boundary data along with an associated feature; this information can then be returned to the user in the form of a map image of the styled data.
The approach to web mapping proposed in this paper constitutes the first phase in the development of a full analytical web GIS platform for exploring the properties of large health data-sets. Consequently, there are a number of issues remaining to be addressed as future work. Paramount among these are issues relating to usability, privacy and security. Usability with respect to data access and processing results can be simplified due to automation. However, usability with respect to an analytical web GIS remains an open issue, particularly given the complexities of analysis envisaged by such a system. Furthermore, usability with respect to the intended audience, health researchers and analysts, needs to be considered (Koenig, Samarasundera, and Cheng Citation2011). The ultimate aim of the analytical web GIS is to enable users to generate results directly from unit record and point data. Thus, security and privacy issues associated with the sensitive nature of the data will also need to be addressed.
Acknowledgements
This work has been supported by the Cooperative Research Centre for Spatial Information, whose activities were funded by the Australian Commonwealth's Cooperative Research Centres Programme.
References
- Bhowmick, T., A.L. Griffin, A.M. MacEachren, B.C. Kluhsman, and E.J. Lengerich 2008. “Informing Geospatial Toolset Design: Understanding the Process of Cancer Data Exploration and Analysis.” Health and Place 14 (3): 576–607. doi: 10.1016/j.healthplace.2007.10.009
- Brewer, C. A. 2012. ColorBrewer. Accessed February 15. http://www.ColorBrewer.org
- Brewer, C. A., and L. Pickle 2002. “Evaluation of Methods for Classifying Epidemiological Data on Choropleth Maps in Series.” Annals of the Association of American Geographers 92 (4): 662–681. doi: 10.1111/1467-8306.00310
- Cinnamon, J., C. Rinner, M. Cusimano, S. Marshall, T. Hern, R. Glazier, and M. Chipman 2009. “Evaluating Web-based Static, Animated and Interactive Maps for Injury Prevention.” Geospatial Health 4 (1): 3–16. http://www.geospatialhealth.unina.it/articles/v4i1/gh-v4i1-02-cinnamon.pdf.
- Evans, B., and C. Sabel 2012. “Open-Source Web-based Geographical Information System for Health Exposure Assessment.” International Journal of Health Geographics 11 (1): 2. doi: 10.1186/1476-072X-11-2
- Foley, D. H., R. C. Wilkerson, I. Birney, S. Harrison, J. Christensen, and L. M. Rueda 2010. “Mosquito Map and the Mal-area Calculator: New Web Tools to Relate Mosquito Species Distribution with Vector Borne Disease.” International Journal of Health Geographics 9 (1): 11. doi: 10.1186/1476-072X-9-11
- Goodchild, M., H. Guo, A. Annoni, L. Bian, K., de Bie, F. Campbell, M. Craglia, et al. 2012. “Next-generation Digital Earth.” Proceedings of the National Academy of Sciences 109 (28): 11088–11094. doi: 10.1073/pnas.1202383109
- Joyce, K. 2009. “To Me It's Just Another Tool to Help Understand the Evidence’: Public Health Decision-makers’ Perceptions of the Value of Geographical Information Systems (GIS).” Health and Place 15 (3): 831–840. doi: 10.1016/j.healthplace.2009.01.004
- Kamadjeu, R., and H. Tolentino 2006. “Web-based Public Health Geographic Information Systems for Resources-constrained Environment Using Scalable Vector Graphics Technology: A Proof of Concept Applied to the Expanded Program on Immunization Data.” International Journal of Health Geographics 5 (1): 24. doi: 10.1186/1476-072X-5-24
- Koenig, A., E. Samarasundera, and T. Cheng 2011. “Interactive Map Communication: Pilot Study of the Visual Perceptions and Preferences of Public Health Practitioners.” Public Health 125 (8): 554–560. doi: 10.1016/j.puhe.2011.02.011
- MacEachren, A., S. Crawford, M. Akella, and G. Lengerich 2008. “Design and Implementation of a Model, Web-based, GIS-Enabled Cancer Atlas.” Cartographic Journal 45 (4): 246–260. doi: 10.1179/174327708X347755
- Robinson, A. C. 2007. “A Design Framework for Exploratory Geovisualization in Epidemiology.” Information Visualization 6 (3): 197–214. doi: 10.1057/palgrave.ivs.9500155
- Samarasundera, E., T. Walsh, T. Cheng, A. Koenig, K. Jattansingh, A. Dawe, and M. Soljak 2012. “Methods and Tools for Geographical Mapping and Analysis in Primary Health Care.” Primary Health Care Research Development 13 (1): 10–21. doi: 10.1017/S1463423611000417
- Sutcliffe, A., S. Thew, O. De Bruijn, I. Buchan, P. Jarvis, and J. McNaught 2011. “Supporting Creativity and Appreciation of Uncertainty in Exploring Geo-coded Public Health Data.” Methods of Information in Medicine 50 (2): 158–165. http://dx.doi.org/10.3414/ME09-01-0070.
- Yi, Q., R. E. Hoskins, E. A. Hillringhouse, S. S. Sorensen, M. W. Oberle, S. S. Fuller, and J. C. Wallace 2008. “Integrating Open-source Technologies to Build Low-cost Information Systems for Improved Access to Public Health Data.” International Journal of Health Geographics 7 (1): 29. doi: 10.1186/1476-072X-7-29

