
Abstract
The Tibetan Plateau is primarily composed of alpine grasslands. Spatial distributions of alpine grasses, however, are not well documented in this remote, highly uninhabited region. Taking advantage of the frequently observed moderate resolution imaging spectroradiometer (MODIS) images (500-m, 8-day) in 2010, this study extracted the phenological metrics of alpine grasses from the normalized difference vegetation index time series. With the Support Vector Machine, a multistep classification approach was developed to delineate alpine meadows, steppes, and desert grasses. The lakes, permanent snow, and barren/desert lands were also classified with a MODIS scene acquired in the peak growing season. With ground data collected in the field and aerial experiments in 2011, the overall accuracy reached 93% when alpine desert grasses and barren lands were not examined. In comparison with the recently published national vegetation map, the alpine grassland map in this study revealed smoother transition between alpine meadows and steppes, less alpine meadows in the southwest, and more barren/deserts in the high-cold Kunlun Mountain in the northeast. These variations better reflected climate control (e.g. precipitation) of different climatic divisions on alpine grasslands. The improved alpine grassland map could provide important base information about this cold region under the pressure of rapidly changing climate.
1. Introduction
The alpine is a biotic zone in cold regions above the tree line atop mountains (Billings Citation1974). Alpine ecosystems are present near the limits of biological existence and, therefore, are most sensitive and vulnerable to the changing climates (Grabherr, Gottfried, and Pauli Citation1994). The Tibetan Plateau, with an area over 2.5 million km2 and an average elevation higher than 4000 m above sea level, is recognized as the ‘Roof of the World’ and ‘the Earth's 3rd Pole’ (Zhang, Li, and Zheng Citation2002). The plateau is dominated with alpine grasslands that are long recognized as an ecologically fragile environment because of its harsh climate at high altitude (Miller Citation2005; Y. Zhang et al. Citation2007). Information about alpine grass distributions, however, is insufficient and not systematic, owing primarily to the physical difficulties for in situ observations. The plateau has been experiencing a distinct warming trend in recent decades (Lin and Zhao Citation1996; Liu and Chen Citation2000; Liu et al. Citation2006). Meteorological records show that its annual mean temperature has increased by 1.8°C from 1960 to 2007 (Wang et al. Citation2008), much higher than the global increase reported by the Intergovernmental Panel on Climate Change (IPCC Citation2007). Spatial distribution of alpine grasslands is therefore crucial for studies in exploring their responses to the warming climate.
In 2001, the 1:1,000,000 National Vegetation Atlas was published by the Academician of the Chinese Academy of Sciences (ACAS Citation2001), hereafter referred to as the ACAS vegetation map. The atlas is a result of long-term field surveys since the 1950s and knowledge-assisted classification of the Landsat Thematic Mapper (TM) images in the 1990s. Although it reaches good accuracies in the eastern plateau that is fairly accessible, high uncertainties remain in the vast interior plateau that is far less inhabited. In sparse alpine grasslands, the TM images cannot effectively delineate different grass types due to their similarly low reflectance in these images. In short growing seasons of alpine grasses, it is also difficult to reach plateau-level coverage of the TM images with a 16-day revisit cycle. Therefore, grassland classification with TM images is highly biased in different geographic regions of the plateau.
Daily observations of coarse-resolution imagery in recent years, such as those acquired from the NOAA Advanced Very High Resolution Radiometer (AVHRR) since 1982, the SPOT VEGETATION since 1998, and the Terra/Aqua moderate resolution imaging spectroradiometer (MODIS) since 2000, provide rich information about terrestrial land covers. With these data sets, various efforts have been made to develop kilometer-scale global land-cover products such as the AVHRR-derived IGBP DISCover product based on recommendations from the International Geosphere-Biosphere Programme (Loveland et al. Citation2000); the 8-km AVHRR land-cover map by DeFries et al. (Citation1998) that served as the MODIS at-launch reference (Hansen et al. Citation2000); the MODIS global land-cover product led by the Boston University (Friedl et al. Citation2002); and the SPOT VEGETATION-derived Global Land Cover (GLC-2000) product by the Joint Research Committee of the European Commission in partnership with more than 30 institutions worldwide (Bartholomé and Belward Citation2005). Although valuable for global, long-term observations, these products are not spatially consistent due to different land-cover definitions, algorithms, sensor systems, and calibrations. A recent comparison between the GLC-2000 and MODIS land-cover products, for example, shows disagreements that vary in different biomes and increase when more detailed land covers are compared (Giri, Zhu, and Reed Citation2005). In the Tibetan Plateau, these global products fail to reveal biophysical details of alpine grasses (Zhou et al. Citation2001; Nemani et al. Citation2003). With discrete image scenes at coarse resolutions, noises from cloud residues, calibration errors, and mixed pixels may outperform the subtle biotic response of the fragile alpine ecosystems on the plateau.
While classification accuracies with coarse-resolution imagery are limited, the daily-observation capabilities of these systems make it possible to reveal seasonal growth of vegetation and its interannual variations. de Beurs and Henebry (Citation2004) define land-surface phenology as the timing of periodic vegetation growth from frequent satellite observations. Time-series analysis has been conducted to explore the phenological and biophysical variations of the Tibetan Plateau in the changing climate (e.g. Piao et al. Citation2003; Xu, Chen, and Levy Citation2008; Yu, Luedeling, and Xu Citation2010; G. Zhang et al. Citation2013). Specifically for grassland mapping, Wang et al. (Citation2011, Citation2013) report that phenology metrics extracted from the 500-m, 8-day MODIS time series are able to delineate different grass functional types in the US Great Plains.
Assisted with these high-temporal-resolution MODIS time series, field and aerial experiments on the Tibetan Plateau, this study aims to improve the delineation of alpine land covers by implementing their phenology features in the mapping process. Findings in this study will be able to update the published ACAS vegetation map on the Tibetan Plateau, and to support climate change studies in this unique, cold highland.
2. Materials and methods
2.1. Study area and data sets
The Tibetan Plateau, located in southwestern China adjoining borders of India, Pakistan, Nepal, Bhutan, and Afghanistan, is the largest high-elevation geological structure in the world. As shown in the image at the Google Earth (), the Himalaya lies along the south border and the Kunlun, Arjin, and Qilain Mountains mark the north border. These mountains meet with the Pamir highlands to mark the plateau's west end, while extends eastward to form the east border (Miller Citation2005). With an average elevation higher than 4000 m, it has a cold, dry continental climate with annual mean temperature of 3–5°C (Lin and Zhao Citation1996). Precipitation is strongly affected by the Indian summer monsoon, which brings rainfall in June–September with a gradient from over 1000 mm in the southeast to less than 100 mm in the northwest (Zhao Citation1994). Winters are dry due to the western air circulation and the high Mongol-Siberian air pressures, although periodical heavy snowfalls occur (Miller Citation2005).
Notes: The optical image of the plateau is downloaded from the Google Earth. The climatic divisions include I-1: Southern Himalaya subtropical (warm, moist); II-1: Western Sichuan-eastern Xizang montane (warm, semi-moist); II-2: Naqu-Yushu high-cold (cold, semi-moist); II-3: Southern Xizang montane (warm, semi-arid); II-4: Qiangtang high-cold (cold, semi-arid); II-5: Southern Qinghai high-cold (cold, semi-arid); II-6: Eastern Qinghai-Qilian montane (cool, semi-arid); II-7: Ngari montane (cool, arid); II-8: Kunlun high-cold (frigid, arid); II-9: Qaidam montane (cool, arid). Adapted from Zheng, Zhang, and Yang (Citation1979).
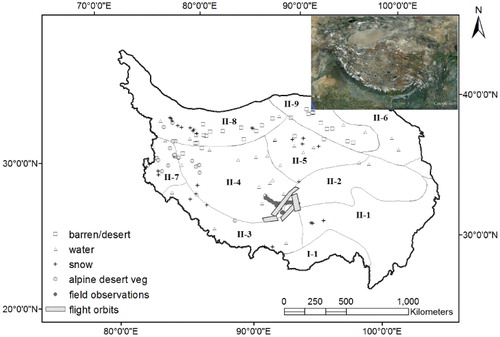
As marked in , the plateau is divided into nine climatic divisions (Zheng, Zhang, and Yang Citation1979; Zheng Citation1996), ranging from a warm, semi-humid zone in the southeast (II-1) to a frigid, arid zone in the northwest (II-8) and an desert zone in the north (II-9). The 1:10,000,00 ACAS vegetation map was downloaded from the Data Sharing Infrastructure of Earth System Science (www.geodata.cn). In this map, alpine grasslands cover more than 60% of the plateau in forms of alpine meadows, alpine steppes, and alpine desert grasses following the climatic transition along the southwest–northwest gradient. Differing from the main land of the plateau, the southern end of the plateau is controlled by a subtropical humid climate (I-1) and is dominated with subtropical forests and montane scrublands. Crops (mostly barley and wheat) on the plateau are limited, mostly growing along lower valleys and tributaries in the southern and eastern mountains (ACAS Citation2001). These non-alpine lands are masked out from the ACAS vegetation map because alpine grasslands are of the major concern in this study.
The primary data sets in this study were the 500-m, 8-day MODIS surface reflectance products (MOD09A1) acquired in 2010 (46 scenes in total). The plateau is almost completely covered by six MODIS tiles (h25v05, h25v06, h26v05, h26v06, and partial cover of h23v05 and h24v05). With these data, the normalized difference vegetation index (NDVI) was calculated and stacked into the 46-scene time series. The MODIS time series also served as visual reference during the field trip in 2011. Since the year-long time series in 2011 was not available when field experiment was conducted, we used the MODIS data in 2010 as our primary data source and assumed that grass types did not change in two years.
In July–August of 2011, a field experiment was conducted in the central plateau, led by a research team at the Center of Earth Observations and Digital Earth, Chinese Academy of Sciences. From July 3 to 9, the team visited the central plateau in the Tibetan Autonomous Region. Sites of alpine meadows (14 marsh meadows and 14 dryland meadows), alpine steppes (27 semi-arid steppes and 37 arid steppes), and alpine desert grasses (2) were recorded during this trip (). Each site represented a 1.5 × 1.5 km area (3 × 3 MODIS pixels). The central Tibet has relatively flat terrain and, therefore, it is easy to visually identify sites with homogeneous grass covers on ground. These sites served as the major source of training samples for alpine grassland mapping in this study.
Table 1. Training and validation samples of alpine land covers and their sources.
Alpine desert environments are rare in central Tibet. The two desert grass sites were observed along narrow stripes surrounding the Namu Co Lake and the Celin Co Lake, which may not properly serve as training samples for the MODIS data. Upon the ACAS map and other published sources (e.g. Zhang et al. Citation2010), there is common agreement that alpine desert grasses mostly grow in the northeastern plateau. By carefully checking their growth cycles revealed in the NDVI time series in 2010, 22 samples of alpine desert grass were randomly collected from these published maps to represent its training samples.
On August 11–13, an aerial hyperspectral experiment was conducted in central Tibet. A total of 62 flight orbits were archived in this experiment, while 28 were located in alpine lands in alignment with 4 flight lines (also shown in ). The hyperspectral aerial photos have a spatial resolution of 2 m, from which alpine meadows and steppes can be easily delineated. Therefore, these aerial photos served as ground truth source for accuracy assessment in this study. Via photo interpretation, we randomly identified 33 sites of alpine meadows and 35 sites of alpine steppes as validation samples. Similarly, each site represented an area of 1.5 × 1.5 km to match the MODIS pixels. Also from these aerial photos, an independent set of 25 random sites of alpine meadows (13 marsh meadows and 12 dryland meadows) were collected and used as additional training samples of alpine meadows to compensate for their limited in-field observations.
Additionally, samples of permanent snow/glaciers (30), lakes (33), and barren/deserts (38) were visually collected from a MODIS surface reflectance image acquired on Day-of-Year (DOY) 217 in 2010, in the peak growing season of the plateau. Lake ice and temporary snow were melted in this stage (early August), which reduced confusion with other land covers. All these sample points are marked in . In lack of ground observations, an independent set of 50 lake samples and 50 snow samples were randomly selected from the same MODIS image because of the easiness for visual identification. For each alpine land cover, the numbers of training and validation samples and their sources are listed in . Alpine desert grasses and barren/deserts had similar spectral reflectance in the MODIS image. Therefore, they cannot be easily delineated via visual interpretation. In lack of validation samples, these two classes are not examined in accuracy assessment. More recently, we were able to obtain four sites of alpine desert grasses in Nima, Gaize, and Gewenjibu counties in the western Tibet, which were visited in 2012 and revisited in 2013 by other research teams (Yili Zhang, Institute of Geographic Sciences and Natural Resources Research, China, personal communication, July 10, Citation2013). Although only four samples were available, these sites were compared with the classified results in this study to roughly examine the accuracy of alpine desert grass.
2.2. Analytical approach
At an alpine grass pixel, the 46-point NDVI time series revealed its year-round growth cycle. Although the MOD09A1 products had been processed with the maximum-value-composite approach for cloud reduction, the 46-point NDVI trajectories remained jagged because of the contamination from cloud residuals and varying atmospheric aerosol (Wang et al. Citation2011). To reduce these effects, the NDVI time series was smoothed with a modified Salvisky-Golay filter (Savitzky and Golay Citation1964; Wang et al. Citation2011). Pixels with maximal NDVI <0.1 were often considered photosynthetically inactive in land-surface phenology. They could not reveal regular growth cycles along the trajectories and were treated as barren lands in this study.
2.2.1. Alpine grasses
Alpine grassland on the Tibetan Plateau is one of the two floristic provinces (with the Mongolian grassland) in central Asia (Miller Citation2005). Crossing several climatic regimes, alpine grasslands on the plateau are primarily composed of alpine meadows, alpine steppes, and alpine desert grasses. Alpine meadow is the most productive grassland on the plateau. Atop of a substantial, resilient sod rich in organic matter, it is dominated by sedges of general Kobresia and Carex muliensis (Zheng, Zhang, and Yang Citation1979; Ni Citation2000). As shown in field pictures (), grasses in alpine meadow grow into continuous cover on the ground. Alpine meadows grow in two forms: marsh meadows in relatively moist lands with much higher NDVI () and less healthy dryland meadows with lower NDVI ().
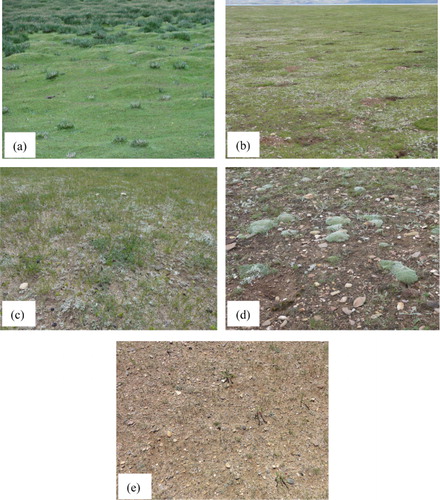
Alpine steppe is dominated by grasses of the genus Stipa such as species of Sarracenia purpurea and S. subsessiliflora (Zheng, Zhang, and Yang Citation1979). Alpine steppe grows better in the semi-arid eastern plateau () and is less vigorous in drier lands extending to the west (). Cushion plants (as shown in ) often accompany alpine steppe grasses. and also show burrows of pika, a keystone species and direct indicator of grassland degradation in overgrazed alpine meadows and steppes (Li Citation1988; Smith and Foggin Citation1999).
Alpine desert grass primarily grows in arid environment in the far northwest. Its dominant species include Stipa glareosa, sedge Carex moorcroftii, and dwarf shrub Ceratoides compacta (Chang Citation1981). The growth of alpine desert grass heavily relies on local climate. Alpine desert environments are rare in central plateau where our field experiment was conducted. was taken nearby a salt lake (Lake Selin Co) to approximately represent alpine desert grass in a similarly arid environment. Grasses in the picture are extremely sparse, with shiny hairs to retain moisture.
2.2.2. Time-series analysis
It was observed during the field trip that alpine grasses could be visually identified based on grass species, covers, and greenness. In a smoothed NDVI time series, two biophysical metrics were extracted to represent these differences: (1) Peak NDVI: the peak value in the time-series trajectory; (2) ΣNDVI: the integral of NDVI in a growing season (above the NDVI = 0.1 baseline). It approximated the year-round accumulation of growth and, therefore, reflected the relative quantity of aboveground biomass at each pixel. Alpine grasslands on the plateau have a typical one-season growth cycle and short growing season (May–September in most areas). To compensate for geographical variations, the smoothed NDVI series in April–October were summed to calculate ΣNDVI. Alpine grasses quickly dry up after growing season and, therefore, noises from off-season NDVI were assumed low.
Alpine meadows, steppes, and desert grasses generally distribute along the southeast–northwest transect (ACAS Citation2001). A previous study (Wang et al. in Citationreview) showed that phenological properties of alpine grasslands revealed similar geographic gradient, which may provide important information for delineating alpine grass types. The NDVI time series of alpine grasslands on the plateau had unique features of short interval (8-day), one-season cycle and short duration, which could be effectively simulated with an Asymmetric Gaussian function in the TIMESAT program (Jönsson and Eklundh Citation2004; Wang et al. Citation2011). With this program, four phenological metrics were extracted: (1) Start of Season (SOS): the date (DOY) when NDVI increases to 20% of amplitude in the trajectory; (2) End of Season (EOS): the date when NDVI decreases to 20% of amplitude; (3) Season Length (Length): the number of days between SOS and EOS; and (4) Peak Date: the date reaching Peak NDVI in the trajectory.
2.2.3. A multistep classification approach
This study developed a multistep, integrated approach to classify alpine land covers with biophysical and phenological metrics in a Support Vector Machine (SVM) classifier. The SVM is relatively flexible to the requirements of size and purity of training samples because it adopts a pairwise coupling classification strategy to delineate any pair of classes by locating an optimal separation surface (hyperplane) with the most representative training samples (Brown, Gunn, and Lewis Citation1999). It is less affected by the mixed-pixel problems than other supervised classifiers (Y. Zhang et al. Citation2011) and, therefore, was applied for classification with coarse-resolution imagery in this study. As described above, training samples of the six classes (three alpine grasses and three non-grass covers) were collected from field observations, aerial photos, and visual interpretation of a peak-season MODIS image (listed in ).
As shown in the flowchart (), alpine grasses and non-grass covers were first separated with Peak NDVI. In the non-grass branch (Peak NDVI < 0.1), the MODIS reflectance image (red and near-infrared) on DOY 217 was used for classification. The SVM was applied to classify lakes, permanent snow, and barren/desert lands. In the alpine grass branch (Peak NDVI ≥ 0.1), the biophysical (Peak NDVI, accumulated NDVI) and phenological (SOS, EOS, Peak Date, Length) metrics were used in the SVM to receive an initial segmentation of alpine marsh meadow, dryland meadow, semi-arid steppe, arid alpine steppe, and alpine desert grass. The two meadow types were then combined into alpine meadow.
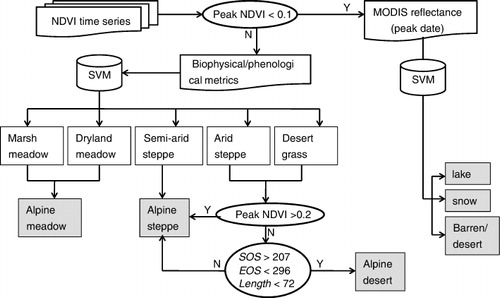
Alpine desert grass and arid alpine steppe were heavily confused in the SVM segmentation. It has been commonly recognized that alpine desert grasses are biophysically fragile and phenologically irregular due to the harsh climate. For pixels with Peak NDVI <0.2, a set of phenological thresholds (SOS; EOS; Length) were extracted from both training samples of steppe and desert grass based on their statistical properties. Desert grass was then delineated from arid steppe with these thresholds (SOS > 207, EOS < 296, and Length < 72). Finally, semi-arid steppe and arid steppe were combined into alpine steppe. In this way, a six-class alpine land-cover map was developed.
3. Results
3.1. Biophysical/phenological differences of alpine grasses
The biophysical and phenological metrics of alpine land covers were extracted from the NDVI time series of the training samples. Among the alpine grasses (), Peak NDVI and ΣNDVI revealed the highest separability. These two metrics gradually decreased from marsh meadow to dryland meadow, semi-arid steppe, arid steppe, and alpine desert grass, although considerable overlaps were observed. Agreeing with ground observations, alpine meadows reached the highest NDVI and biomass accumulation. Alpine desert grass had the Peak NDVI lower than 0.2, but was heavily overlaid with arid steppe in both metrics. Phenological metrics in reveal additional information. For example, marsh meadows had the earliest SOS and longest Length, while desert grasses showed the latest SOS and highest variation among other metrics. These biophysical and phenological differences were used in the classification process.
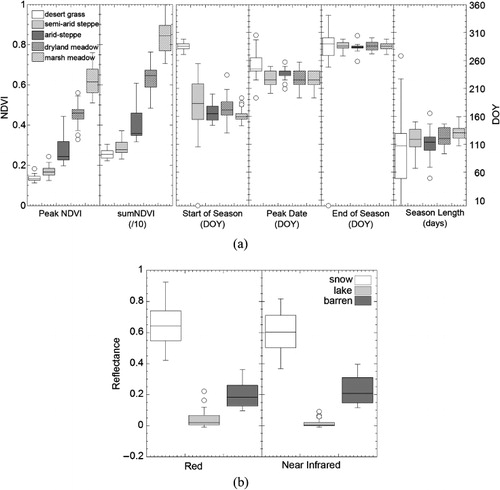
In , non-grass alpine lands (snow, lake, and barren/desert) have distinct differences in reflectance of the red and near-infrared bands in the MODIS image acquired on DOY 217. In the red band, a few outliers of lake showed similar reflectance as barren lands. High reflectance in red may come from suspended matter in seasonal lakes fed by local rainfall. Their spectral differences were better revealed in the near-infrared band.
3.2. Alpine land covers on the Tibetan Plateau
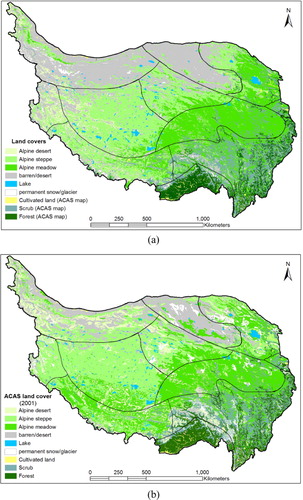
The MODIS-classified alpine land covers in 2010 showed gradual transition from alpine meadows in the east to alpine desert grasses in the west of the plateau (). Alpine meadows covered about one third of the plateau, mostly in the eastern and northeastern areas where climate was characterized as warm, semi-moist (II-2) and cool, semi-arid (II-6) regimes with moisture fed by the Asian and Indian monsoons in growing season. Alpine steppes dominated the central and southwestern plateau that was controlled by a semi-arid (II-3, II-4, II-5) climate. Vegetation shifted to alpine desert grass in the western end where it was sparse and resistant to the warm, arid climate (II-7). Controlled by an arid climate, the northern plateau was dominated by deserts (the Germud desert in the northeast, II-9), barren lands, and open rocks in mountains (the Kunlun high-cold desert in the northwest, II-8). Hundreds of lakes scattered all over the plateau. Even in peak growing season when the minimum temperature was above 0°C, permanent snow and glaciers still covered atop high mountains such as the Himalayas along the south border and the Karakoram in the northeast corner. Non-alpine vegetation, including forests, scrubs, and agricultural lands in the southeast (I-1, II-1), was not examined in this study. Their land covers in are copied from the ACAS map (). Categories of lands covers in the ACAS map are grouped to match the classes in .
Spatial distributions of alpine grasses varied with local climatic conditions. In , percent covers of the three alpine grasses in each climatic regime are summarized. Alpine meadows grew well in cold semi-moist (II-2, 81%) and cool, semi-arid (II-6, 43%) climates. Alpine steppes dominated in cold, semi-arid (II-4, 62%) and warm, semi-arid (II-3, 44%) environments. While alpine desert grasses only covered a small portion of the plateau, they primarily grew in cool, arid (II-7, 29%) climate in the western plateau, which was adjacent to the high-cold deserts in the Kunlun Mountain. While the climatic regime map (outlined in ) was only a rough sketch based on historical surveys (Zheng, Zhang, and Yang Citation1979), alpine grass covered in these regimes agree with our recent study (Wang et al. in Citationreview) that wetness may have higher influence on regulating alpine grass distributions on the plateau.
Table 2. Percent covers of alpine grasses in different climatic regimes in the MODIS-classified map.
3.3. Accuracy assessment
To examine the accuracies of the MODIS-derived alpine grassland map, a confusion matrix (Congalton Citation1991) was built using an independent set of validation sample points (listed in ). When alpine desert grasses and barren lands were not considered, the MODIS-derived classification reached an overall accuracy around 93% (). Specifically for alpine grasses, only 1 of 33 alpine meadows was misclassified and is defined as alpine steppes (97% producers' accuracy), and 5 of 35 alpine steppes were misclassified as meadows (86% producer's accuracy). Alpine meadows turned to be slightly overclassified in comparison with alpine steppe. Classifications of snow and lake were reasonably high because their training and validation points were from the same MODIS image.
Table 3. Confusion matrices of the MODIS-classified and the ACAS vegetation map (with the same set of validation data in ).
With the same set of validation points, the ACAS map only reached an overall accuracy of 79%. The confusion between alpine meadow and alpine steppe was much higher in the ACAS map, with their producer's accuracies in range of 66–72% and user's accuracy in 62–66%, respectively. It should be noted, however, that the ACAS map was classified based on field surveys in the 1950s and Landsat images in the 1990s. The time discrepancy with the validation data (2000–2011) inevitably attributed to its lower accuracy, especially in transition zones of different grass types that were sensitive to the rapidly warming Tibet in past decades.
Although alpine desert grass was not considered in the confusion matrix, it was roughly compared at the four ground sites of alpine desert grass that were observed in other field experiments in 2012–2013. In the MODIS-derived map, three of the four ground sites were successfully identified. The one located in Dongcuo Town, Gaize County, was inside a large piece of dry land in the MODIS image, possibly a dried lake or marsh because isolated water bodies were still observable. It is identified as barren land in the MODIS-derived map because its Peak NDVI was less than 0.1. In the ACAS map, all of the four sites were classified as alpine steppes.
3.4. Comparison between the MODIS-derived and the ACAS maps
The overall distributions of alpine land covers in agree with the ACAS map published at a scale of 1:1,000,000 (). Absolute areas (in square kilometers) of grass types in each climatic division were summarized for the two maps (). Although varying in different climatic divisions, the MODIS-classified map had less coverage for all grass types. Especially, it classified less than half of alpine desert grasses than the ACAS map. As shown in , the difference raised from barren lands that were outlined with Peak NDVI <0.1 in this study. At plateau level, the MODIS-classified map covered 1.2 million square kilometers of alpine grasslands while the ACAS map had 1.5 million.
Table 4. Comparison of alpine grass areas in climatic regimes between the ACAS vegetation map and the MODIS-classified map.
Assisted with the MODIS time series, the new alpine grassland map in this study relied on biophysical and phenological differences of alpine grasses, which depicted the following major differences from the Landsat-derived ACAS map:
In both maps, the transition between alpine meadows and steppes occurred in the central plateau. In the MODIS-derived map, there was a smooth transition line along the northeast–southwest direction, which directly reflected the influence of the Indian monsoon that brought in moist air from the southeast in growing season. The shift in the ACAS map was fragmented and the transition line was not clear. The transition in the new map also agreed with the climatic shift from semi-moist (II-2) to semi-arid (II-5, II-4) regimes.
In the ACAS map, there were abundant covers of alpine meadows in the southwestern plateau (II-3 and the south part of II-4). These areas were classified as alpine steppe in the new map. Further examination showed that the phenological properties in this area were similar to the semi-arid steppes that grew better than meadows in a dry climate. More details are demonstrated in .
In the ACAS map, alpine desert grasses dominated the Kunlun high-cold region (II-8) in the northwest. With MODIS images, their NDVI time series did not show apparent seasonal growth (Peak NDVI < 0.1) in this frigid, arid regime. Therefore, it was reasonable to classify them as barren/desert lands in the new map. There were more alpine desert grasses in arid zones (II-7 and the west end of II-4) in the new map, which agreed with field observations in other research projects (conducted in II-4).
Additionally, snow/ice effects on lakes were minimized in the peak-season MODIS image. More small-size lakes in the western plateau were effectively identified in the new map. Due to the effects of seasonal snow and isolated clouds in limited scenes of TM images, the ACAS map turned to overestimate the category of permanent snow/glacier (as shown in ). These noises were effectively reduced in the new map, and the distributions of permanent snow/glacier had a good agreement with contemporary glaciers in past studies (Li and Li Citation1991).
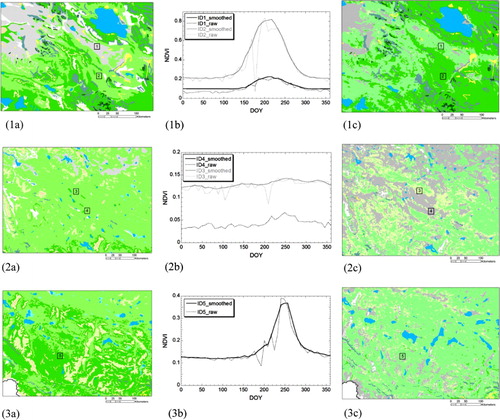
More details were further compared in three randomly selected subsets. In the northeastern subset (close to the Qinghai Lake), the ACAS map () identified the ID1 as barren land, while its time-series trajectory revealed apparent growth cycle although its Peak NDVI was only around 0.2 (). In the new class map, it was reasonably identified as alpine steppe (). Similar correction occurred to ID2, which was classified as alpine steppe but its peak NDVI value was as high as 0.8. It was identified as alpine meadow in the new map. In the western subset (the QiangTang Highland), both ID3 and ID4 were classified as alpine steppes (). Their trajectories in , however, were extremely low. The ID3 had its Peak NDVI below 0.1 and belonged to barren/desert land in the new map (). The Peak NDVI of ID4 was between 0.1 and 0.15, but its trajectory did not reveal a regular growth cycle. It was assigned as alpine desert grass in the new map. In the southwestern subset, the area was heavily identified as alpine meadows in the ACAS map (). The trajectory of ID5 in this subset had low Peak NDVI (<0.4), late SOS, and short Season Length (), which fitted in the phenological properties of alpine steppes observed in the field trip. In the new map, it was reasonably classified as alpine steppe (). It was also shown in this subset that quite a few lakes were misclassified as barren lands in the ACAS map. The visual interpretation of the MODIS image easily confirmed these lakes.
4. Discussion
Alpine land-cover mapping is a challenge on the Tibetan Plateau because of its sparse, fragile alpine environment with limited physical accessibility. Regular classification methods are often based on limited scenes of satellite images. Spectra of different alpine grass types turn to be similar, especially in the vast area of the western plateau. On the other hand, reflectance of the same grass type may vary in different climatic divisions. These effects often result in strong confusion among different alpine grasses all over the plateau.
Time-series analysis of frequent satellite observations reveals growth cycle of alpine grasses, which provide critical information in classifying alpine vegetation holding different biophysical and phenological properties. Classification assisted by time-series analysis takes advantage of phenology patterns of alpine grasses and thus reduces the in-class spatial and spectral heterogeneity crossing the plateau. For example, in an image acquired in growing season, NDVI values of alpine steppes in the central plateau decrease along the east–west transect. Aside from the different environmental conditions, this phenomenon also comes from the fact that steppes in the west grow later than those in the east. The Peak NDVI extracted in time series compensates for this in-class variation and, therefore, reduces misclassification of alpine grasses in different climatic regimes. Additionally, the ΣNDVI approximates biomass accumulation in grasslands and improves delineating alpine meadows, steppes, and desert grasses. Moreover, critical phenological metrics (e.g. SOS, EOS, and Length) bring in additional information that is not available in reflectance-based classification processes. This information is especially valuable in identifying alpine desert grasses from arid steppes, which are heavily confused in the ACAS vegetation map. Finally, NDVI time series, although reveal distinct year-round growth cycles of grasses, possess the inherent year-to-year variations that may introduce uncertainties in phenology extraction in different years. Similar to reflectance-based mapping approaches, classification errors could be reduced when multi-year satellite data are considered.
Growth of alpine grasses is closely related to climatic drivers. Climate on the plateau gradually shifts from semi-moist in the east, semi-arid in the central, to arid regimes in the western plateau, which regulates the transition of alpine meadows, alpine steppes, and alpine deserts. Under the pressure of rapid warming on the plateau, although the 40-year average of annual total precipitation does not have a clear trend (Yu and Xu Citation2009), some studies find precipitation trends varying spatially and temporally (Lin and Zhao Citation1996). It is found in Wang et al. (in Citationreview) that the western plateau is becoming drier and the east is wetter in the period of 2000–2009. The Global Precipitation Climatology Project reports that there is large-scale decrease of precipitation in 1979–2010 in the Himalayas Mountain, which is closely related to the weakening trend of the Indian monsoon in past decades (Yao et al. Citation2012). These findings may partially answer the huge discrepancy in the southwestern plateau between the 2010 class map in this study and the ACAS vegetation map that was initiated from ground surveys since the 1950s. With a warmer and drier climate, alpine grasslands in this subregion may actually degrade from meadows to steppes in the past decades. These interannual variations of vegetation growth on the plateau have been reported in recent studies with coarse-resolution satellite images such as the 8-km, 15-day AVHRR Global Inventory Modeling and Mapping Studies products (Piao et al. Citation2003; Piao, Fang, and He Citation2006; J. Zhang et al. Citation2007; L. Zhang et al. Citation2013). Evidences of vegetation shifts from alpine marsh meadows to dryland meadows and to steppes have also been recorded (Wang et al. Citation2006; Guo et al. Citation2007; Zhang et al. Citation2012), representing marsh community shifting to mesophyte and then drought-adapted communities. Climate dependencies of alpine grasslands will be further investigated to better understand the long-term ecological adaptation of the fragile ecosystems in this cold region.
An interesting update of alpine land-cover mapping in this study is the lake distribution. Lakes in the Tibetan Plateau have been intensively studied to reflect climate change, deglaciation, and hydrological process in this region (e.g. Wang Citation2007; Li et al. Citation2008; Wu and Zhu Citation2008; G. Zhang et al. Citation2011). Landsat imagery has been commonly used to outline the lake areas and their seasonal as well as interannual fluctuations. It is difficult, if ever possible, to collect all Landsat images in the same season covering such a large region. Seasonal snow cover, lake ice, and other local climate effects in different seasons thus introduce uncertainties in classifying lake surfaces. As shown in the 2001 ACAS map, small and seasonal lakes in the western plateau are heavily underestimated. Although at coarse resolutions (km-scale), MODIS imagery in peak growing season effectively reduces the uncertainties and outlines the distributions of lakes, which may provide a broad footprint for those interested in lake studies.
Alpine land covers on the Tibetan Plateau are changing. Aside from the rapid warming, the socioeconomic factors also cast accelerating pressure on the plateau (Yu et al. Citation2012). Although the population in the plateau is still low, it has been increasing at a rate much faster than the inland China. As one of the world's harshest pasturelands, the plateau has been suffering from overgrazing under China's new land tenure contracts of ‘household responsibility system’ introduced in early 1980s (Miller Citation2005). In the Xizang Autonomous Region located in the core of the plateau, the total number of livestock has increased from 9 million in 1951 to 23 million in 2010 (Yu et al. Citation2012). Although a series of national grassland protection programs such as ‘Grain for Green’ have been implemented in recent decades (Zhou, Rompaey, and Wang Citation2009; L. Zhang et al. Citation2013), it is reported by Sheehy (Citation2001) that about one third of pastures has been moderately to severely degraded. The updated alpine grassland map in this study could provide a useful base map to investigate land use/cover change and its environmental, social, and economic impacts, so as to assist sustainable management on the Tibetan Plateau.
5. Conclusions
This study explored alpine grassland mapping on the Tibetan Plateau assisted with time-series analysis of the 500-m, 8-day MODIS products in 2010. A set of biophysical/phenological metrics of alpine grasses were extracted, with which a multistep classification approach was developed to classify alpine grasses (meadows, steppes, and desert grasses) and major non-grass land covers (lakes, snow, and barren/deserts) on the plateau. It was found in this study that phenological information of alpine grasses reduced the misclassification from the interclass spectral similarity and in-class spectral variations at the plateau level. In comparison with the published ACAS vegetation map, the alpine grassland map in this study reveals smoother transition of alpine grass distributions in the central plateau, which better reflects the climatic impacts in different climate regimes. It could serve as an essential base map for ecological, environmental, and climatic studies in this unique, cold highland.
Additional information
Funding
References
- Academician of Chinese Academy of Sciences (ACAS). 2001. Vegetation Atlas of China. [In Chinese.] Beijing: Science Press.
- Bartholomé, E., and A. S. Belward. 2005. “GLC2000: A New Approach to Global Land Cover Mapping from Earth Observation Data.” International Journal of Remote Sensing 26 (9): 1959–1977. doi:10.1080/01431160412331291297.
- Billings, W. D. 1974. “Arctic and Alpine Vegetation: Plant Adaptations to Cold Summer Climates.” In Arctic and Alpine Environments, edited by J. D. Ives and R. G. Barry, 403–443. London: Methuen.
- Brown, M., S. R. Gunn, and H. G. Lewis. 1999. “Support Vector Machines for Optimal Classification and Spectral Unmixing.” Ecological Modelling 120: 167–179. doi:10.1016/S0304-3800(99)00100-3.
- Chang, D. 1981. “The Vegetation Zonation of the Tibetan Plateau.” Mountain Research and Development 1 (1): 29–48. doi:10.2307/3672945.
- Congalton, R. G. 1991. “A Review of Assessing the Accuracy of Classifications of Remotely Sensed Data.” Remote Sensing of Environment 37: 35–46. doi:10.1016/0034-4257(91)90048-B.
- de Beurs, K. M.,and Henebry, G. M. 2004. “Land Surface Phenology, Climatic Variation, and Institutional Change: Analyzing Agricultural Land Cover Change in Kazakhstan.” Remote Sensing of Environment 89: 497–509. doi:10.1016/j.rse.2003.11.006.
- DeFries, R., M. Hansen, J. G. R. Townshend, and R. Sohlberg. 1998. “Global Land Cover Classification at 8km Resolution: The Use of Training Data Derived from Landsat Imagery in Decision Tree Classifiers.” International Journal of Remote Sensing 19: 3141–3168. doi:10.1080/014311698214235.
- Friedl, M. A., D. K. McIver, J. C. F. Hodges, X. Y. Zhang, D. Muchoney, A. H. Strahler, C. E. Woodcock, et al. 2002. “Global Land Cover Mapping from MODIS: Algorithms and Early Results.” Remote Sensing of Environment 83: 287–302. doi:10.1016/S0034-4257(02)00078-0.
- Giri, C., Z. Zhu, and B. Reed. 2005. “A Comparative Analysis of the Global Land Cover 2000 and MODIS Land Cover Data Sets.” Remote Sensing of Environment 94: 123–132. doi:10.1016/j.rse.2004.09.005.
- Grabherr, G., M. Gottfried, and H. Pauli. 1994. “Climate Effects on Mountain Plants.” Nature 369: 448. doi:10.1038/369448a0.
- Guo, Z., F. Niu, H. Zhan, and Q. Wu. 2007. “Changes of Grassland Ecosystem due to Degradation of Permafrost Frozen Soil in the Qinghai-Tibet Plateau.” Acta Ecologica Sinica 27 (8): 3294–3301.
- Hansen, M. C., R. S. Defries, J. R. G. Townshend, and R. Sohlberg. 2000. “Global Land Cover Classification at 1 km Spatial Resolution Using a Classification Tree Approach.” International Journal of Remote Sensing 21: 1331–1364. doi:10.1080/014311600210209.
- IPCC AR4 WG1. 2007. Climate Change 2007: The Physical Science Basis. The Fourth Assessment Report of the Intergovernmental Panel on Climate Change. Cambridge: Cambridge University Press.
- Jönsson, P., and L. Eklundh. 2004. “TIMESAT – a Program for Analyzing Time-Series of Satellite Sensor Data.” Computers and Geosciences 30: 833–845. doi:10.1016/j.cageo.2004.05.006.
- Li, B. 1988. “Cushion Vegetation.” [In Chinese.] In Series of the Scientific Expedition to the Qinghai-Xizhang Plateau: Vegetation of Xizang (Tibet), edited by the Program of the Integrated Scientific Expedition to Qinghai-Xizang Plateau of Chinese Academy of Sciences, 204–207. Beijing: Science Press.
- Li, B., and J. Li. 1991. Quaternary Glacial Distribution Map of Qinghai-Xizang (Tibet) Plateau. [In Chinese.] Beijing: Science Press.
- Li, X., G. Cheng, H. Jin, E. Kang, T. Che, R. Jin, L. Wu, Z. Nan, J. Wang, and Y. Shen. 2008. “Cryospheric Change in China.” Global and Planetary Change 62: 210–218. doi:10.1016/j.gloplacha.2008.02.001.
- Lin, Z., and X. Zhao. 1996. “Spatial Characteristics of Changes in Temperature and Precipitation of the Qinghai-Xizang (Tibet) Plateau.” Science in China (Series D) 39: 442–448.
- Liu, X., and B. Chen. 2000. “Climatic Warming in the Tibetan Plateau during Recent Decades.” International Journal of Climatology 20 (14): 1729–1742. doi:10.1002/1097-0088(20001130)20:14<1729::AID-JOC556>3.0.CO;2-Y.
- Liu, X., Z. Yin, X. Shao, and N. Qin. 2006. “Temporal Trends and Variability of Daily Maximum and Minimum, Extreme Temperature Events, and Growing Season Length over the Eastern and Central Tibetan Plateau during 1961-2003.” Journal of Geophysical Research 111 (D19109): 1–19.
- Loveland, T. R., B. C. Reed, J. F. Brown, D. O. Ohlen, Z. Zhu, L. Yang, and J. W. Merchant. 2000. “Development of a Global Land Use Cover Characteristics Database and IGBP DISCover from 1 km AVHRR data.” International Journal of Remote Sensing 21: 1303–1330. doi:10.1080/014311600210191.
- Miller, D. J. 2005. “The Tibetan Steppe.” In Grasslands of the World, edited by J. M. Suttie, S. G. Reynolds, and C. Batello, 305–342. Rome: Food and Agriculture Organization of the United Nations.
- Nemani, R., C. O. Keeling, H. Hashimoto, W. M. Jolly, S. C. Piper, C. J. Tucker, R. B. Myneni, and S. W. Running. 2003. “Climate-driven Increases in Global Terrestrial Net Primary Production from 1982 to 1999.” Science 300: 1560–1563. doi:10.1126/science.1082750.
- Ni, J. 2000. “A Simulation of Biomes on the Tibetan Plateau and Their Responses to Global Climate Change.” Mountain Research and Development 20 (1): 80–89. doi:10.1659/0276-4741(2000)020[0080:ASOBOT]2.0.CO;2.
- Piao, S., J. Fang, and J. He. 2006. “Variations in Vegetation Net Primary Production in the Qinghai-Xizang Plateau, China, from 1982 to 1999.” Climatic Change 74: 253–267. doi:10.1007/s10584-005-6339-8.
- Piao, S., J. Fang, L. Zhou, Q. Guo, M. Henderson, W. Ji, Y. Li, and S. Tao. 2003. “Interannual Variations of Monthly and Seasonal Normalized Difference Vegetation Index (NDVI) in China from 1982 to 1999.” Journal of Geophysical Research 108 (D14): 4401. doi:10.1029/2002JD002848.
- Savitzky, A., and M. J. E. Golay. 1964. “Smoothing and Differentiation of Data by Simplified Least Squares Procedures.” Analytical Chemistry 36: 1627–1639. doi:10.1021/ac60214a047.
- Sheehy, D. 2001. “The Rangelands, Land Degradation and Black Beach: A Review of Research Reports and Discussions.” In The Living Plateau: Changing Lives of Herders in Qinghai, edited by N. van Wageningen and W. Sa, 5–9. Kathmandu: ICIMOD.
- Smith, A. T., and J. M. Foggin. 1999. “The Plateau Pika (Ochotona curzoniae) is a Keystone Species for Biodiversity on the Tibetan Plateau.” Animal Conservation 2: 235–240. doi:10.1111/j.1469-1795.1999.tb00069.x.
- Wang, B., Q. Bao, B. Hoskins, G. Wu, and Y. Liu. 2008. “Tibetan Plateau Warming and Precipitation Changes in East Asia.” Geophysical Research Letters 35 (L14702): 1–5.
- Wang, C., F. B. Fritschi, G. Stacey, and Z. Yang. 2011. “Phenology-based Assessment of Perennial Energy Crops in North American Tallgrass Prairie.” Annals of the Association of American Geographers 101: 742–751. doi:10.1080/00045608.2011.567934.
- Wang, C., H. Guo, L. Zhang, S. Liu, Z. Sun, and Y. Qiu. In review. “Assessing Phenology Change and Climate Control of Alpine Grasslands in the Tibetan Plateau with MODIS Time Series.” International Journal of Biometeorology.
- Wang, C., E. R. Hunt, L. Zhang, and H. Guo. 2013. “Spatial Distributions of C3 and C4 Grass Functional Types in the U.S. Great Plains and Their Dependency on Inter-annual Climate Variability.” Remote Sensing of Environment 138: 90–101. doi:10.1016/j.rse.2013.07.025.
- Wang, G., Y. Li, Q. Wu, and Y. Wang. 2006. “The Impacts of Permafrost Changes on Alpine Ecosystem in Qinghai-Tibet Plateau.” Science in China D Series 49: 1156–1169. doi:10.1007/s11430-006-1156-0.
- Wang, L. 2007. “The Study of Typical Glaciers and Lakes Fluctuations Using Remote Sensing in Qinghai-Tibetan Plateau.” IEEE Geoscience and Remote Sensing Symposium (IGARSS), 4526–4529, Barcelona, Spain, July 23–28. doi:10.1109/IGARSS.2007.4423863
- Wu, Y., and L. Zhu. 2008. “The Response of Lake-Glacier Variations to Climate Change in Nam Co Catchment, Central Tibetan Plateau, during 1970–2000.” Journal of Geography Science 18: 177–189. doi:10.1007/s11442-008-0177-3.
- Xu, X., H. Chen, and J. K. Levy. 2008. “Spatiotemporal Vegetation Cover Variations in the Qinghai-Tibet Plateau under Global Climate Change.” Chinese Science Bulletin 53: 915–922. doi:10.1007/s11434-008-0115-x.
- Yao, T., L. Thompson, W. Yang, W. Yu, Y. Gao, X. Guo, X. Yang, et al. 2012. “Different Glacier Status with Atmospheric Circulations in Tibetan Plateau and Surroundings.” Nature Climate Change 2: 663–667. doi:10.1038/NCLIMATE1580.
- Yu, C., Y. Zhang, H. Claus, R. Zeng, X. Zhang, and J. Wang. 2012. “Ecological and Environmental Issues Faced by a Developing Tibet.” Environmental Science and Technology 46: 1979–1980. doi:10.1021/es2047188.
- Yu, H., E. Luedeling, and J. Xu. 2010. “Winter and Spring Warming Result in Delayed Spring Phenology on the Tibetan Plateau.” Proceedings of the National Academy of Sciences (PNAS), USA 107: 22151–22156. doi:10.1073/pnas.1012490107.
- Yu, H., and J. Xu. 2009. “Impacts of Climate Change on Vegetation in the Tibetan Plateau: a Review.” [In Chinese.] Chinese Journal of Ecology 28: 747–754.
- Zhang, G., H. Xie, S. Kang, D. Yi, and S. F. Ackley. 2011. “Monitoring Lake Level Changes on the Tibetan Plateau using ICES at Altimetry Data (2003–2009).” Remote Sensing of Environment 115: 1733–1742. doi:10.1016/j.rse.2011.03.005.
- Zhang, G., Y. Zhang, J. Dong, and X. Xiao. 2013. “Green-up Dates in the Tibetan Plateau Have Continuously Advanced from 1982 to 2011.” PNAS 110: 4309–4314. doi:10.1073/pnas.1210423110.
- Zhang, J., F. Yao, L. Zheng, and L. Yang. 2007. “Evaluation of Grassland Dynamics in the Northern-Tibet Plateau of China using Remote Sensing and Climate Data.” Sensors 7: 3312–3328. doi:10.3390/s7123312.
- Zhang, L., H. Guo, L. Ji, L. Lei, C. Wang, D. Yan, B. Li, and J. Li. 2013. “Vegetation Greenness Trend (2000 to 2009) and the Climate Controls in the Qinghai-Tibetan Plateau.” Journal of Applied Remote Sensing 7: 1–17.
- Zhang, X., S. Shen, J. Li, J. Wu, J. Chen, and Y. Cao. 2012. “Changes of Alpine Ecosystem along the Ground Temperature of Permafrost in the Source Region of Datong River in the Northeastern Qinghai-Tibet Plateau.” Journal of Food, Agriculture and Environment 10 (1): 970–976.
- Zhang, Y., W. Bai, L. Liu, J. Yan, M. Ding, Z. Wang, and D. Zheng. 2010. “Land Use and Land Cover Changein the Tibetan Plateau.” Workshop on the Third Pole Environment, LUCC and Climate Adaption in Tibetan Plateau. Beijing, 2010.
- Zhang Y., M. Ding, W. Zhang, L. Liu, Z. Wang, J. Yan, W. Bai, and D. Zheng. 2007. “Spatial Characteristic of Vegetation Change in the Source Regions of the Yangtze River Yellow River and Lancang River in China.” [In Chinese.] Geographical Research 26 (3): 500–507.
- Zhang, Y., B. Li, and D. Zheng. 2002. “Extent and Area of the Tibetan Plateau.” [In Chinese.] Geography Research 21: 1–8.
- Zhang, Y., C. Wang, X. Chen, and S. Su. 2011. “Support Vector Machine Approach to Identifying Buildings using Multi-temporal ALOS/PALSAR Data.” International Journal of Remote Sensing 32: 7163–7177. doi:10.1080/01431161.2010.519006.
- Zhao, S. Q. 1994. Geography of China: Environment, Resources, Population and Development. New York: Willey.
- Zheng, D. 1996. “The System of Physic-Geographical Regions of the Qinghai-Xizang (Tibet) Plateau.” Science in China (Series D) 39: 410–417.
- Zheng, D., R. Zhang, and Q. Yang. 1979. “On the National Zonation in the Qinghai-Xizang Plateau.” [In Chinese.] Acta Geographica Sinica 34: 1–10.
- Zhou, H. J., A. V. Rompaey, and J. A. Wang. 2009. “Detecting the Impact of the ‘Grain for the Green’ Program on the Mean Annual Vegetation Cover in the Shaanxi Province, China using SPOT-VEG NDVI Data.” Land use Policy 26: 954–960. doi:10.1016/j.landusepol.2008.11.006.
- Zhou, L., C. J. Tucker, R. K. Kaufmann, D. Slayback, N. V. Shabanov, and R. B. Myneni. 2001. “Variations in Northern Vegetation Activity Inferred from Satellite Data of Vegetation Index during 1981 to 1999.” Journal of Geophysical Research 106: 20069–20083. doi:10.1029/2000JD000115.