
Abstract
This paper presents a supervised polarimetric synthetic aperture radar (PolSAR) change detection method applied to specific land cover types. For each pixel of a PolSAR image, its target scattering vector can be modeled as having a complex multivariate normal distribution. Based on this assumption, the joint distribution of two corresponding vectors in a pair of PolSAR images is derived. Then, a generalized likelihood ratio test statistic for the equality of two likelihood functions of such joint distribution is considered and a maximum likelihood distance measure for specific land cover types is presented. Subsequently, the Kittler and Illingworth minimum error threshold segmentation method is applied to extract the specific changed areas. Experiments on two repeat-pass Radarsat-2 fully polarimetric images of Suzhou, China, demonstrate that the proposed change detection method gives a good performance in determining the specific changed areas in PolSAR images, especially the areas that have changed to water.
1. Introduction
Recently, many methods have been proposed for change detection in single-channel synthetic aperture radar (SAR) image, and several features can be utilized, such as area, shape, average intensity, texture, and underlying land cover. Compared with single-channel SAR data, polarimetric synthetic aperture radar (PolSAR) data contain both phase and amplitude information from radar returns transmitted in two different polarizations, signifying that more scattering information can be utilized when PolSAR data are available for change detection (Lee and Pottier Citation2009).
SAR change detection involves four major steps: pre-processing filtering and co-registration, difference map extraction, threshold segmentation, and image fusion. Among these steps, difference map extraction is one of the most important sectors. Recently, some excellent studies have been performed in the field of difference map extraction. Many polarimetric features have been applied, such as polarization state conformation, optimal polarization theory, and fully polarimetric clutter models (Conradsen et al. Citation2003; Qong Citation2004; Brisco et al. Citation2013).
Taking advantage of the discrimination of different scattering mechanisms, terrain and land-use classification has become the most important application of PolSAR (Lee and Pottier Citation2009). However, in terms of difference map extraction, we still cannot distinguish the land type before and after a change from the difference map generated by the PolSAR change detection method. Furthermore, in certain applications, we do not need all of the changed areas, but only those from specific class wi to specific class wj. For example, only the areas that changed into urban areas are useful for research on city expansion, and in this case, other changed areas will be regarded as a false alarm. Therefore, the method of applying the class information of PolSAR to change detection deserves more specific studies. The objective of this paper is to propose a distance measure to detect the areas changing from specific class wi to specific class wj and then apply this distance to PolSAR change detection.
2. Proposed distance measure
In this section, we first derive the joint distribution of two random complex vectors. To extract the changed areas from specific class wi to specific class wi, a generalized likelihood ratio test (GLRT) is built and a maximum likelihood (ML) distance measure is derived.
2.1. The joint distribution of two random complex Vectors
We say that a p-dimensional random complex vector X follows a complex multivariate normal distribution with mean 0 and covariance matrix Σ, that is,
Let us partition
Note that the independence of X(1) and X(2) is not determined, and their joint distribution cannot be calculated directly by multiplying their respective PDF. Here, we make a nonsingular linear transformation to the subvectors
Since Y(1) and Y(2) are independently normally distributed, their joint density is:
2.2. Proposed distance measure
The well-known PolSAR scattering vector, based on the complex Pauli spin matrix, is given by
Because k1 ∈ CN (q, Σ11) and k2 ∈ CN (q, Σ22), the likelihood function of the joint distribution of k1 and k2 can be obtained from equation (13).
2.3. The reduced distance under uncorrelated assumption
Due to the calculation of matrix T12, the proposed distance dP in equation (21) can only be obtained from two single-look PolSAR images. However, for data compression and preliminary speckle reduction, the PolSAR data are frequently multi-look processed by spatial averaging at the expense of loss of spatial resolution. In this case, the uncorrelated assumption of the target vectors, k1 and k2, should be applied to estimate the value of dP.
When we assume that k1 and k2 are mutually independent, their joint distribution can be obtained directly by multiplying f (k1) and f (k2). Therefore, the likelihood function in equation (13) becomes a function of the parameters Σ11 and Σ22:
3. Change detection method
Based on the proposed distance, a supervised PolSAR detection method for specific land cover type changes is presented. First, two repeat-pass fully PolSAR images should be co-registered in advance. Then, the training areas are selected for class wi and class wj from the two images respectively, and their coherency matrices are calculated. By applying the proposed measure dP, the change from class wi to class wj is obtained.
When the difference map is extracted, a binary map is constructed to obtain an image of the change region. The most common solution to this problem is to select the threshold in the histogram of the difference image automatically. The Kittler and Illingworth (KI) minimum error threshold segmentation method is widely used in image segmentation based on Bayesian decision theory (Kittler and Illingworth Citation1986). Moser and Serpico (Citation2006) propose a generalized KI algorithm, which gives a good performance in the field of change detection. Here, we apply this improved KI method to extract the changed areas from specific class wi to specific class wj.
After KI threshold segmentation, we could observe that the segmented binary image had many small unconnected changed areas, and these areas are usually not considered for change detection. In addition, there are some black holes in the changed areas, which increase the difficulty of calculating the changed areas and extracting boundary and reduce the final accuracy of change detection. Therefore, a morphologic operation, connected components extraction, is applied to remove the small unconnected changed areas and small black holes (Gonzalez and Woods Citation2007). A binary change mask is achieved by morphologic operation and we label the changes in the original images.
4. Experimental results and discussion
To illustrate the change detection capability of the derived GLRT distance measure, two repeat-pass Radarsat-2 fully PolSAR images taken at Shihu Lake area of Suzhou, China, acquired separately on 9 April 2009 and 15 June 2010, were used for our experiment. The spatial resolution is 10 × 8 m, and the incidence angle ranges from 38.37° to 39.85°. There are urban areas, lawns, forest, lake, mountain, and bare land in this area, and thus, it is very suitable for verifying the detectability of specific land cover types. A 7 × 7 neighborhood sliding window size is selected for estimating the polarimetric coherency matrix.
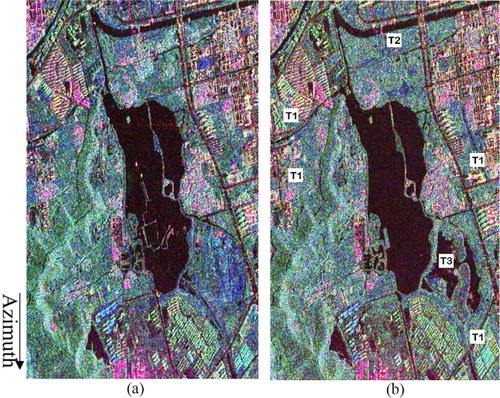
The Pauli decomposition maps are presented in . According to field investigations, as well as two Google Earth images of this area, which have a similar imaging time with the experimental data (acquired separately on 15 March 2009 and 19 June 2010), we find three major feature change classes between the two images, labeled from T1 to T3 in . Class T1 indicates the change from bare lands to urban areas, class T2 denotes the change from urban architecture to bare lands, and class T3 indicates the change from lawns or bare lands to water. These three changed areas are delineated as the reference images for accuracy validation.
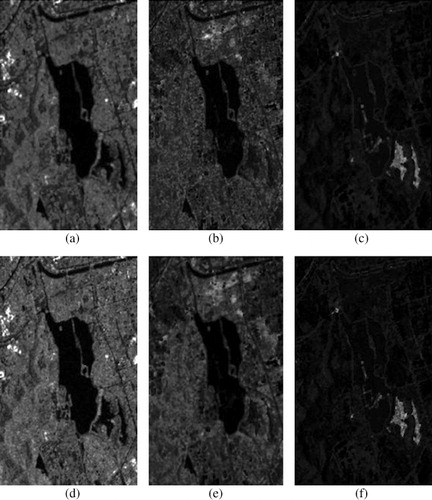
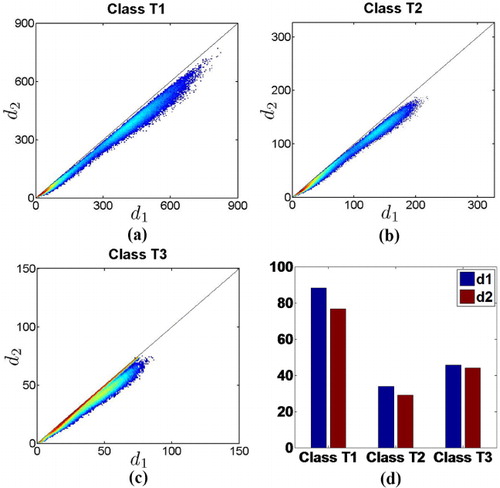
shows the difference maps using the proposed distance dP and its reduced form dR, respectively. It can be observed that all of the changed areas marked in have been detected successfully, and the difference maps generated by dP have less noise and higher contrast than those of dR. For further analysis, the comparison of these two measures for three change types is shown in . When d2 is equal to d1, the curve lies along the diagonal line. The average of d1 and d2 is shown in . In general, the test statistic for the full PolInSAR matrix in equation (19) is only slightly better than that for the uncorrelated case. We may conclude that the correlation information between these two images is small.
The independence of class wi and class wj can be verified by:
After the extraction of the difference map, we use KI threshold segmentation and connected components extraction to divide the difference map into two classes: changed areas and no-change areas. presents the corresponding color-coded image, with red indicating T1, green denoting T2, and blue indicating T3. The two most important indices for change detection, namely detection rate and false alarm rate of changed areas, are shown in . Note that all change classes have been detected with a high detection rate and a low false alarm rate and that the detection capability of class T3 gives a better performance than the two other change classes. A possible reason for this is that the sample selection for water areas is easier than the other land cover types, especially for mixed lawn and urban areas in class T2. Accordingly, this method has great potential for application in the monitoring of floods.
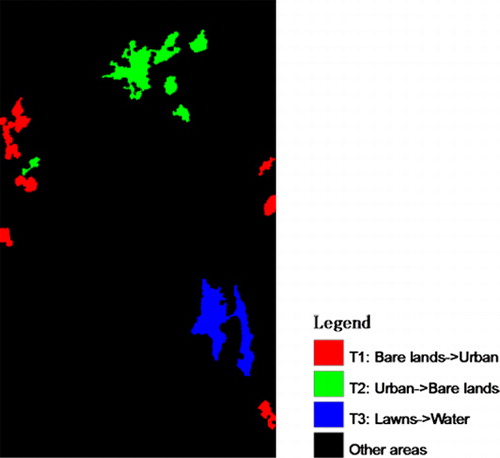
Table 1. Accuracy of change detection.
5. Conclusions
In this paper, we have developed a supervised PolSAR change detection method applied to specific land cover types. To detect the areas changing from class wi to class wj between two repeat-pass PolSAR images, a distance measure dP is derived based on a generalized likelihood ratio test, and the specific changed areas are noted to have a higher dP than the other changed areas and no-change areas. When we assume that the target vectors belonging to the two images are mutually independent, a reduced distance dR can be obtained. dR has fewer constraints than dP and can be estimated only from multi-look complex PolSAR data. For PolSAR change detection, class wi and class wj have a slight correlation, and thus, dR can be promoted as a substitute of dP when there are no single-look PolSAR data available.
The effectiveness of the proposed change detection method is illustrated by two Radarsat-2 fully polarimetric SAR images taken at Shihu Lake area of Suzhou, China. The results show that the change areas of all change classes can be detected successfully with a high detection rate and a low false alarm rate. Moreover, the application of this method in the monitoring of floods is worthy of further investigation.
Additional information
Funding
References
- Anderson, T. W. 2003. An Introduction to Multivariate Statistical Analysis. Hoboken, NJ: Wiley-Interscience.
- Brisco, B., A. Schmitt, K. Murnaghan, S. Kaya, and A. Roth. 2013. “SAR Polarimetric Change Detection for Flooded Vegetation.” International Journal of Digital Earth 6 (2): 103–114. doi:10.1080/17538947.2011.608813.
- Conradsen, K., A. A. Nielsen, J. Schou, and H. Skriver. 2003. “A Test Statistic in the Complex Wishart Distribution and Its Application to Change Detection in Polarimetric SAR Data.” IEEE Transactions on Geoscience and Remote Sensing 41 (1): 4–19. doi:10.1109/TGRS.2002.808066.
- Ferro-Famil, L., E. Pottier, and J. S. Lee. 2001. “Unsupervised Classification of Multifrequency and Fully Polarimetric SAR Images Based on the H/A/Alpha-Wishart Classifier.” IEEE Transactions on Geoscience and Remote Sensing 39 (11): 2332–2342. doi:10.1109/36.964969.
- Gonzalez, R. C., and R. E. Woods. 2007. Digital Image Processing. Upper Saddle River, NJ: Prentice Hall.
- Goodman, N. R. 1963. “Statistical Analysis Based on a Certain Multivariate Complex Gaussian Distribution (An Introduction).” Annals of Mathematical Statistics 34 (1): 152–177. doi:10.1214/aoms/1177704250.
- Kittler, J., and J. Illingworth. 1986. “Minimum Error Thresholding.” Pattern Recognition 19 (1): 41–47. doi:10.1016/0031-3203(86)90030-0.
- Lee, J. S., and E. Pottier. 2009. Polarimetric Radar Imaging: From Basics to Applications. Boca Raton, FL: CRC Press.
- Moser, G., and S. B. Serpico. 2006. “Generalized Minimum-error Thresholding for Unsupervised Change Detection from SAR Amplitude Imagery.” IEEE Transactions on Geoscience and Remote Sensing 44 (10): 2972–2982. doi:10.1109/TGRS.2006.876288.
- Qong, M. 2004. “Polarization State Conformation and Its Application to Change Detection in Polarimetric SAR Data.” IEEE Geoscience and Remote Sensing Letters 1 (4): 304–308. doi:10.1109/LGRS.2004.835221.