
Abstract
Typhoons are usually accompanied by strong winds, heavy rain, storm surges and other disastrous events, and they are the most severe weather phenomena in the western part of the North Pacific Ocean. Visualisation is a key technology for analysing and presenting climate simulations and observations together with related social and ecological data. Virtual globes are a logical platform for visualising such geospatial data via the Internet. To implement interactive visualisation of typhoon data within virtual globes, this study provides a 3D texture-mapping algorithm to render volume textures on a globe. In addition, a systematic framework is proposed in which a hierarchical octree-based multiresolution data structure is implemented to organise the large volume dataset, and a graphics processing unit-based dynamic interpolation approach is proposed to obtain a smooth effect. Finally, the structure is combined with a level of detail strategy to enable the rendering of dynamic volumetric data at an acceptable interactive frame rate. To demonstrate the capabilities of this framework, data for a simulated typhoon event were rendered in World Wind, an open-source virtual globe. The experimental results demonstrate that the application of the proposed strategies can result in an interactive visualisation performance that renders typhoon data on virtual globes.
1. Introduction
Typhoons, a type of tropical cyclone, are usually accompanied by strong winds, heavy rain, storm surges and other disastrous events, and they can result in huge economic losses. They are the most severe weather in the western part of the North Pacific Ocean between the longitudes of 180° and 100°E. Typhoon visualisation is a significant component of weather research and forecasting (WRF) applications, and it plays an important role in disaster prevention and reduction. Volume visualisation, in particular, can provide the user with a more intuitive understanding of a storm's movement and potential dynamics, an analysis of the internal structure, a forecast of its path and auxiliary decision support.
Visualisation is a key technology for analysing and presenting climate simulations and observations along with related social and ecological data. There are many techniques for different data classes (for an overview, see Nocke, Flechsig, and Bohm Citation2007). Van Thu and Krishnamurti (Citation1992) used particles and a streamline model to track and visualise typhoon phenomena. Volume rendering technology, which is widely used for internal structure analysis and for evaluating the simulation mode, has also been proposed for typhoon research (Kim et al. Citation2005; Park, Bajaj, and Ihm Citation2004; Wang et al. Citation2002). Some specialised software packages, such as Vis5D, VAPOR and AVS/Express (Doleisch Citation2007; Hibbard et al. Citation1994; Vroom Citation1997), have the potential to support volume visualisation. Although these software packages have achieved fairly good results, they still lack collective interoperability for the public, and they are not ideal for large-scale dynamic volumetric data, especially in a network environment. Demand for new visualisation tools always exists in spite of hardware innovations.
After the ‘Digital Earth’ concept was proposed by Gore (Citation1998), different virtual globe platforms, such as World Wind and Google Earth, have emerged to support its development. These existing platforms are effective tools for the visualisation of geospatial data (including image, terrain and models) via the Internet but typically do not directly support volume visualisation, especially when the volume is very large (Brovelli and Zamboni Citation2012). In this article, we extend the World Wind software package created by National Aeronautics and Space Administration to enable typhoon data visualisation.
There have been some attempts to visualise volume data in virtual globes. For instance, Li et al. (Citation2011) visualised large-scale volumetric data based on level of detail (LOD) strategies. However, there still exist some challenges that require further research. First, volumetric data are specified in the Cartesian coordinate system, but the virtual globe uses a spherical coordinate system; thus, the traditional volume rendering approach cannot be directly applied for virtual globes. Second, the typhoon data are large volumes of data that vary through time and their dimensions vary widely. The multiresolution data structure proposed by Li et al. (Citation2011) does not consider cracking between the boundaries for adjacent bricks, and this approach must be improved. Furthermore, volume rendering is a computationally intensive task; thus, graphics processing units (GPUs) are often used to accelerate the rendering.
In this paper, we address these challenges to realise interactive dynamic visualisation of typhoon data in a virtual globe environment. This study has four main objectives: (1) to develop a systematic framework to interactively visualise typhoon data in an Internet-based environment; (2) to improve the 3D texture-mapping algorithm to render volumetric data on virtual globes; (3) to accommodate large volumes of data with a hierarchical octree-based multiresolution structure; and (4) to create a smoothly dynamic visualisation with a GPU-based interpolation approach. Ultimately, the methods integrated with an LOD strategy are expected to render typhoon events at high speeds on virtual globes.
The remainder of this paper is organised as follows. Section 2 presents a general review of the related works regarding visualising large volumetric datasets in Internet environments. Section 3 introduces the framework of our research. Section 4 presents a detailed elaboration of an improved texture-mapping approach to render volumetric data on virtual globes. Section 5 describes our approach to organise and render dynamic volumetric data, including the hierarchical octree-based multiresolution data organisation, volume animation and octree traversal and rendering strategy. Section 6 demonstrates the proposed approach using simulated typhoon data. Finally, Section 7 presents a brief discussion and our conclusions.
2. Related work
Virtual globes provide an effective framework for the visualisation of large-scale geospatial datasets as well as the efficient presentation of natural and social phenomena. Researchers utilise these new online collective visualisation tools to support spatial analysis and decision-making (Aurambout, Pettit, and Lewis Citation2008; Bailey and Chen Citation2011; Butler Citation2006; Li et al. Citation2011; Wu, He, and Gong Citation2010). These tools have also been demonstrated to be useful for meteorological research (Joseph Turk et al. Citation2011; Smith and Lakshmanan Citation2011; Sun et al. Citation2012; Titov et al. Citation2009). Climate simulations and observational data are often multidimensional and multivariate volumetric datasets; thus, their visualisation is also a data-rich and computationally intensive task (Shen Citation2006). Because of advances in data collection, static and dynamic volume data have become abundantly available in the geoscience and environmental science fields (Brovelli and Zamboni Citation2012). Virtual globes can be regarded as a logical platform to visualise such geospatial data over the Internet, the major objective of this study is to enhance the capability of virtual globes to support interactive dynamic volume visualisation on common personal computers.
Volume rendering technology that allows viewing data from multiple angles to explore the inner structure of 3D objects is an important branch of graphics and visualisation. It has been widely used in computed tomography scanning, medicinal applications of nuclear magnetic resonance and fluid mechanics (Kroes, Post, and Botha Citation2012; Montea et al. Citation2013).There are many approaches to volume rendering. Among them, the 3D texture-based volume rendering algorithm is an efficient tool for the display and visual analysis of volumetric data on graphics workstations or consumer hardware (Cabral, Cam, and Foran Citation1994; Dachille et al. Citation1998; Kniss et al. Citation2001; Ma et al. Citation1998; Weiler et al. Citation2000). First introduced by Cullip and Neumann (Citation1993) and Cabral, Cam, and Foran (Citation1994), this approach performs very well using the 3D texture capabilities of graphics hardware. However, traditional hardware does not support specular lighting and the gradient for high-quality light must be pre-integrated through, e.g. the use of a lookup table (Van Gelder and Kim Citation1996). A GPU-based pre-integrated texture-slicing method that included advanced lighting was proposed by Roettger and Ertl (Citation2002) to improve the rendering speed, but the gradient also must be recomputed when the transfer functions change. With advances in hardware, the specular light can now be computed on GPUs that have been used for the ray-casting algorithm (Roettger et al. Citation2003; Ruijters and Vilanova Citation2006; Stegmaier et al. Citation2005). We can also improve the quality of the texture-mapping algorithm in the fragment shader programme. Furthermore, because of the difference between the coordinate systems of the data and visualisation, the volume rendering algorithm cannot be used directly on virtual globes (Yang and Wu Citation2010). We also must improve the coordinate system before rendering the volumetric data on virtual globes.
These masses of volumetric data must be effectively organised in the rendering process. Octree is an established, multilevel data structure that addresses large data volumes and has been widely used in meteorological simulations, medical scanning and fluid dynamics applications (Boada, Navazo, and Scopigno Citation2001; LaMar, Hamann, and Joy Citation1999; Li et al. Citation2011; Ruijters and Vilanova Citation2006). There are two main octree construction approaches, the adaptive and uniform-size methods. Adaptive blocks may lead to some distortion in severely changed regions and be difficult to retrieve, and they are not suitable for network visualisation, but uniform-size organisation could be a viable option (Ljung et al. Citation2004). To maintain the coherency of datasets that vary in time, time–space partitioning trees and wavelet compression have also be used to treat volumetric data (Shen Citation2006; Shen, Chiang, and Ma Citation1999). In this article, the typhoon data are regularly gridded; thus, we use a hierarchical octree data structure to organise the volume animation data for visualisation.
After the data are effectively organised with an octree, a view-dependent LOD strategy is used to accelerate the volume rendering (Boada, Navazo, and Scopigno Citation2001; Guthe et al. Citation2002; LaMar, Hamann, and Joy Citation1999; Li et al. Citation2011). By rendering with varying degrees of detail, less data are loaded into the rendering pipeline and the rendering speed can be improved. In this paper, we use the LOD schema proposed by (Li et al. Citation2011), and the above-mentioned technologies are integrated into the node visualisation function to visualise large volumes of typhoon data at an interactive frame rate in network environments.
3. The dynamic typhoon visualisation framework
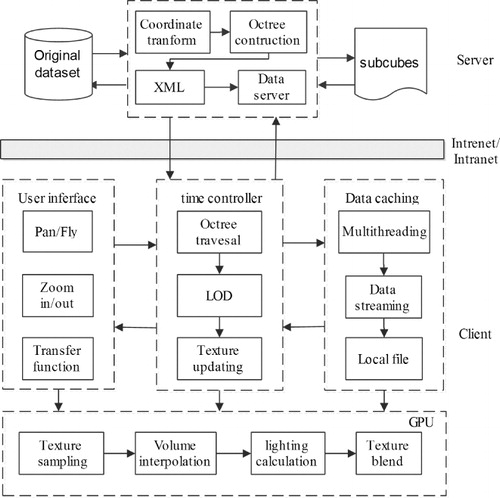
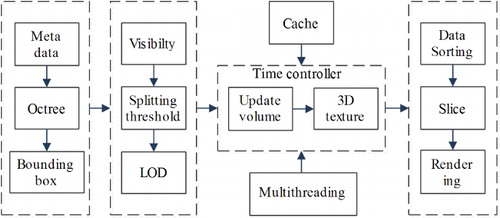
shows the framework of typhoon visualisation in a network environment. On the server, the original volumetric data are partitioned into sub-cubes and then organised and coded based on a hierarchical octree, and an XML configuration file is generated. For the client, the data are scheduled from the remote server by the transmission control protocol/Internet protocol and then rendered with the LOD strategy in the node visualisation function by the time controller. The data module is responsible for data downloading, management and caching; the user interface module includes transfer function widgets and the interactive interface. The texture sampling, animation interpolation, specular lighting calculation and blend function are all performed on the GPU.
4. Improved 3D texture rendering on globes
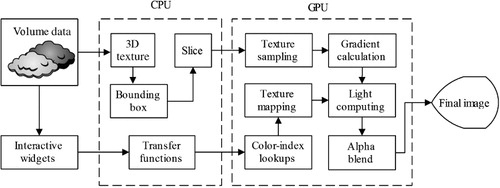
In this section, we describe the volume rendering algorithm; additional details (such as octree construction and scheduling) for large volumetric datasets are discussed in Section 5. The proposed method uses a view-dependent texture-slicing approach to render the volume texture. Compared to the traditional pre-integrated 3D texture-slicing approach, we optimised this approach to address two main aspects: (1) the use of gradients that are calculated on-the-fly to improve the rendering quality in the shader programme and (2) the rendering of volumetric data that are defined in the Cartesian coordinate system in virtual globes using a bounding box and coordinate transformation. shows a flow chart of the improved texture-slicing approach.
4.1. GPU-based texture-slicing algorithm
Hardware-assisted 3D texture mapping is the most practical way for large-scale volume visualisations (Clyne and Dennis Citation1999; LaMar, Hamann, and Joy Citation1999); however, traditional hardware does not support complex light computing, such as specular lighting. The pre-integrated approach limits the interactive capability of the system (Van Gelder and Kim Citation1996). The gradient and intensity values are stored in texture memory, which increases the data volume for network transmission. When the transfer function is changed, the colour and gradient must be recomputed. It is thus difficult to support real-time visualisation for large-scale volumetric data in a network environment. Furthermore, the non-normalised gradient that is used to calculate the illumination leads to light artefacts (Rezk-Salama et al. Citation2000). This effect can be improved on the CPU using the method proposed by Dachille et al. (Citation1998), but this improvement comes at the expense of the rendering speed.
4.1.1. On-the-fly gradient calculation
With advances in graphics hardware, most private computer graphics cards have programmable capabilities and the gradient can be computed in the fragment shader programme (Meiβner, Hoffmann, and Straβer Citation1999; Westermann and Ertl Citation1998). In this study, we use the intermediate and central difference gradient filters to obtain high-quality light. We propose a recalculation of the gradient on-the-fly to improve the 3D texture-rendering algorithm. As shown in , the original volumetric data are transferred into the main memory and sliced along the direction of view, and the magnitude and normalisation of the gradient are recalculated on the fly. Compared with the pre-integrated strategy, this algorithm reduces the amount of data transmitted (to 25% of the original), and the rendering quality of the algorithm is also improved.
In the rendering process, the voxel information is converted to optical properties, such as colour and opacity, by the transfer function (Kniss, Kindlmann, and Hansen Citation2002). With the approach described above, the original scalar voxel values are stored in the brick textures and the fragment shader is used to look up the red green blue alpha colour value post-interpolatively. This approach can be used because a change in the transfer function does not require creating new textures, which allows us the flexibility to change the transfer function at runtime.
4.2. Volume rendering on a globe
In Section 2, we reviewed the 3D texture-mapping algorithm, which visualises regular volumetric data and uses a regular volume bounding box as a proxy mesh (see ). However, the typhoon data are visualised on globes with spherical coordinates. Therefore, the traditional volume rendering approach cannot be used, and we thus optimise the method using bounding box construction and texture resampling in the rendering process.
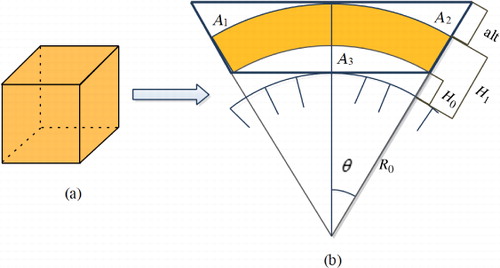
4.2.1. Bounding box of the volume texture
Because the texture coordinates are not homogeneous in the bounding box, the 3D texture coordinates in cannot be directly assigned to vertices. We suppose that the volumetric data are calculated in a bounding region from position minL (lat0, lon0, H0) to position maxL (lat1, lon1, H1) in a spherical coordinate system. shows the volumetric data in section using orange on virtual globes. Because of the curvature of the earth, the bounding box is larger than region in which the volumetric data are calculated, which is marked by wide black lines. The maximal altitude of the bounding box (H1 plus alt) can be calculated as follows:
In the volume rendering process, we must first obtain the bounding box of the volume texture. The spherical coordinates of the vertex in the bounding box are then transformed to Cartesian coordinates as follows:
4.2.2. Coordinate transformation
After the bounding box is defined, a set of slices along the view direction is calculated to obtain the colour information for the pixel shader, which is the core of the volume rendering algorithm. Because the voxels in the bounding box do not corresponding to the texture, the region of A1, A2 and A3 in is not a valid range. For each point on the slice along the ray direction, we can transform the vertex's Cartesian coordinates to spherical coordinates to judge whether it is in a valid range. The transformation of Cartesian coordinates to spherical coordinates is calculated as follows:
The valid ranges of the texture coordinates u, v and s are from 0 to 1. If the texture coordinates are beyond the valid range, the value of the intensity is set to zero and the colour is transparent.
5. Effective rendering of large-volume typhoon data
5.1. Typhoon data
To evaluate the visualisation approach, we used data that simulate a typhoon event called Rananim that occurred in the northwest Pacific Ocean in 2004. The data, which are stored in the NetCDF format, were generated based on the WRF Model. The simulation replicates a typhoon event from 12:00 am on 12 August 2004 to 6:00 pm on 14 August 2004, thereby producing data for a 54-h period. The geographic coverage of the data is from 9.0262 N to 45.1072 N and from 85.9631 W to 143.9630 W. Along the altitudinal direction, the model is able to estimate the wind particles at 19 pressure layers of the atmosphere at heights from approximately 100 m to 1000 m. Therefore, the data comprise 54 matrices, and each matrix has a dimension of 429 × 267 × 19, which correspond to the latitudinal dimension, the longitudinal dimension and the number of atmospheric/pressure layers, respectively.
The data are also a multivariate volumetric dataset, including the wind intensity, pressure layer and water vapour. Using a float value for the density, a linear coding method is used to store different scalar data, and each element in a 3D matrix is associated with wind properties (such as the speed, pressure and moisture content, for example), latitude, longitude and time. The total volume of the data is approximately 6 GB. If we use the pre-integrated gradient approach, the total volume would be 24 GB. This significant difference underscores the necessity of using an optimised solution for rendering the data.
5.2. Hierarchical octree-based data organisation
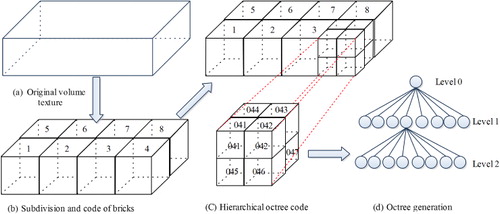
Octree-based multiresolution organisation has proved to be an effective method to improve the rendering of large volumetric datasets. Two issues must be considered before constructing the octree: (1) because of great differences in the dimensions of the data (such as 429 × 267 × 19 for the Remain simulation), uniform-resolution decomposition methods can yield many unnecessary empty cells and (2) the volume rendering algorithm does not support bi- and trilinear interpolation on the boundary; thus, to prevent cracks between bricks, the brick should be surrounded by a half-voxel layer of duplicate voxels. We propose a two-level strategy to constructing the octree to solve these problems. The whole process is divided into two steps, bricking and octree generation ().
5.2.1. Bricking
If X, Y and Z are the three dimensions in the original data cube and the lengths of the corresponding dimensions are L, W and H, respectively, then the length of all edges of decomposed sub-cubes is 2n, the value of which is limited by OpenGL or Direct x. To brick, we first decompose the original dataset into a series of bricks such that the length of all edges is 2n. Because of the half-voxel layer of duplicate voxels on the boundary, the effective size of each brick is 2n–1. This bricking process can be completed according to the following three sub-steps:
Step 1: Determine the shortest length among the three spatial dimensions from the original data. If H < L and H < W, then Z is the shortest dimension.
Step 2: Let D be equal to log2 of the smallest dimension and round the decimals to one. Then, the depth of the octree is D + 1, and 2D indicates the number of elements along each dimension at the highest resolution of the octree. The maximum of D is also limited by the network bandwidth and video memory of the graphics hardware.
Step 3: Decompose the original dataset into a series of bricks such that the length of all edges is 2D. For adjacent bricks that overlap a voxel, assign the quotients of the three dimensions to Mx, My and Mi. Then, the value of Mi (i = x, y, z) is
5.2.2. Octree construction
For each brick, a hierarchical octree-based multiresolution model is used to present the volumetric data from the highest level, D+1, to level 1. Each octree node corresponds to a cuboid part of the voxel volume, which can be divided into eight parts corresponding to the child nodes (see ). The actual voxel data are found in the brick textures at the final level of the octree, and every node represents one unique cell. Every higher octree-level node value can be calculated by averaging the values of its children. Our octree is held in the main memory and only describes the geometry of the visible data. The data cube created from resampling the original data forms the octree at the deepest level with the highest resolution. For example, to represent a 323-brick dataset with varying levels, sequences of cubes in the sizes of 323, 163, 83, 43, and 23 are generated. Finally, we obtain a full octree to represent one timestamp of the volumetric data.
For a dataset of N time series, the results are N octrees. The volumetric data are organised in a temporal sequence with time indexing implemented for each timestamp. The sub-trees of octrees at consecutive timestamps are identical; thus, the second timestamp only stores a pointer to the first time step in the rendering process. Each octree also stores statistical information regarding child nodes at every inner node, e.g. the min/max-bounds for the region that is covered by the node, and these values can be further used to optimise the rendering. The different scalars of the typhoon have individual octrees, which are indexed by the name of the scalar.
5.3. Volume animation
The simulated or observed meteorological data are often recorded as time sequences. For the status of a typhoon layer between the two points in time, the linear interpolation approach is often used. However, this process requires intensive computation and memory, and it is thus often impractical for large volumetric data. Thus, most volume rendering algorithms do not yet support dynamic interpolation. To obtain a smooth rendering performance, we propose an on-the-fly interpolation approach in the fragment shader.
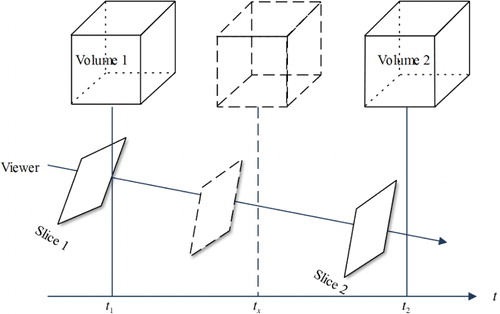
Because of spatial correlations within the data sequence, we can calculate sequential volumetric data using some view parameters in the rendering process and then obtain the intensity value with a linear interpolation approach based on the time. As shown in , we assume that in the two sequences of volumetric data Volume 1 and Volume 2, the data are sliced along the view direction by the same view parameters such that slice1 and slice2 are slices that correspond to different times. The intensity values of the points on the slices are Value1 and Value2 at the times t1 and t2; thus, the value at time 251658240tx can be calculated using Equation (6):
5.4. Octree traversal and rendering
Dynamic visualisation always requires scheduling the data access time sequences for volumetric data. After the multiresolution organisation, a robust strategy of data scheduling and LOD can greatly increase the efficiency of rendering and shorten the response time of the system (Dietrich, Gobbetti, and Yoon Citation2007). We focus on the LOD strategy and node visualisation functions, which are two key points in the rendering process. shows the flowchart of octree traversal and rendering.
5.4.1. LOD strategy
The objectives of the LOD strategy in the volume rendering process are (1) to accelerate the rendering speed by using less detail such that large data can be rendered in an interactive mode and (2) to regulate the frame rate such that the difference in resolution levels is minimised (Heok and Daman Citation2004; Li et al. Citation2011).
The view-dependent LOD method is adapted to visualisations of typhoon dynamics in this paper. While the requested octree node is in the view frustum, we must confirm the exact level of the octree multiresolution structure using the concept of the splitting threshold. As is shown in , assuming that the distance between the viewpoint and the centre of the cube is D and the length of cube is L, the size of threshold DF is:
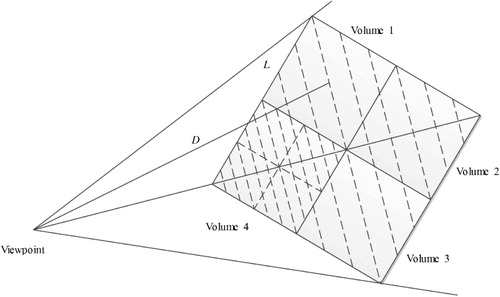
shows the bounding boxes of four bricks in the plane. Assuming that volume 1 corresponds to 163 voxels in the 3D texture, volume 4 is closer to the viewpoint than volume 1 and it will be rendered with a texture that has 323 voxels. The sampling rate of the slice in volume 4 is then 50% of that in volume 1. When the cube is far from the viewpoint, the data with less detail data will be loaded and rendered with a larger resampling rate.
5.4.2. Node visualisation function
The octree traversal is based on iterative application of a node visualisation function that computes the contribution of each brick to the final image. The node visualisation function is based on the algorithm proposed by Boada, Navazo, and Scopigno (Citation2001). The function can be decomposed into the following steps:
Octree definition. Obtain the metadata of the volumetric data, define the bounding box of the data cube on the centre of the node, and ensure that each brick of the volume has an accurate position.
LOD. Confirm the exact level of the multiresolution structure using the splitting threshold before the data are loaded in the main memory.
Texture updating. The 3D textures are updated by the time controller in the system. Multithreading asynchronous scheduling and stream transmission strategies are often employed to maintain the relative independence of the rendering process and data scheduling during the visualisation (Ahrens et al. Citation2001). According to the LOD and time, the corresponding data re-requested using different threading.
Volume sorting and rendering. The composition order of the bricks is obtained directly from a back-to-front octree traversal driven by the viewing direction. Then, the dynamic interpolation and rendering of each slice are integrated on the GPU as described in the section above.
The World Wind platform provides multithreading, LOD and local cache strategies for massive image data, and we extended these capabilities to support the volumetric data presented here.
6. Experiment and evaluation
To evaluate the effectiveness of our proposed approach, a set of experiments was conducted. The original volume data were reorganised by the proposed hierarchical octree data structure and then rendered in World Wind (C# version). For comparison, the original simulated typhoon data were rendered using the 3D texture-mapping algorithm without the gradient calculation that we have implemented in the platform. Various performance issues were evaluated by comparing the renderings for static and dynamic data, including (1) with and without the on-the-fly gradient calculation for lighting, coordinate transformation and animation interpolation and (2) with and without the octree and LOD strategies. The experiments were performed on a Windows desktop PC with 2 GB of physical memory and an NVIDIA GeForce GT 240 graphics card, which supports HLSL 3.0 technology.
6.1. Visualisation
Based on the framework proposed in Section 4, a multiresolution model was first generated from the original dataset. The simulated typhoon data have 54 3D matrices with the same dimensions (429 × 267 × 19). According to our data organisation, we first determined the dimensions of the bricks (14 × 9 × 1) and the depth of the octree (D + 1 = Round (log219) + 1 = 5). Each brick at the lowest resolution level has 32 × 32 × 32 voxels at the highest resolution level. The dimensions of the resampled 3D matrices are 435 × 280 × 32 because of the overlapping, the octree data structure was constructed using a trilinear interpolation method, and these cubes are five-level cubes. By aggregating or resampling the five-level cubes recursively four more times, a five-level octree data structure was generated to describe the 3D matrix at multiple resolutions.
shows snapshots of the renderings with the improved texture-mapping algorithm. The original volumetric data without performing a coordinate transformation in are converted to spherical coordinates, as shown in . The volumes rendered with and without lighting are shown in and . We can design different transfer functions for different variables in the user-controlled widgets, such as colour, opacity and the visualisation range. In our experiment, red, green and white colours were used to represent different levels of typhoons in .
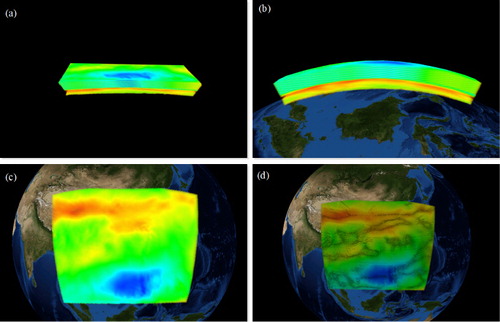
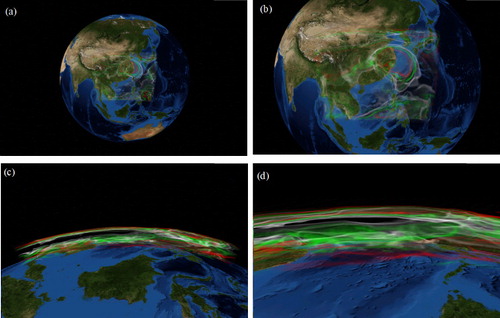
shows snapshots of renderings from four different viewing directions in World Wind with the implemented multiresolution strategies. As the view changes, the 3D scenes at the different resolutions are rendered accordingly. When the viewpoint was far from the Earth model, typhoon data at coarser resolutions were rendered as shown in and . When the viewpoint moved closer to the typhoon region, finer-scale data were loaded into the 3D engine and rendered as shown in and . Using the above LOD strategies, five effective speeds were realised. The frames per second (FPS) was relatively stable regardless of the distance between the viewpoint and the data centre.
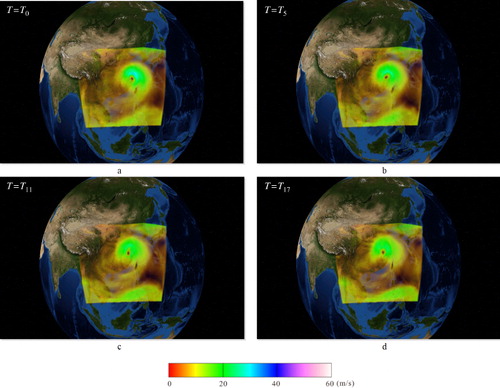
We have also realised dynamic visualisation smoothly on virtual globes. shows the movement of a typhoon event with the time. The outline of the typhoon centre can be clearly observed in the visualisation.
6.2. Comparisons
Compared to the rendering strategy proposed by Li et al. (Citation2011), our method provides three main advatanges: (1) differences in coordinate systems are considered; (2) cracks between bricks are prevented using the hierarchical octree-based data organisation; and (3) all of the rendering and dynamic interpolation steps are provided in the shader programme, which fully utilises the capability of the hardware.
As opposed to the pre-integrated texture-mapping method (Lum, Wilson, and Ma Citation2004), we also compare the effects of different optimisation strategies (without gradient, on-the-fly gradient calculation, coordinate transformations and dynamic interpolation) for the 3D texture-mapping algorithm. presents the average FPS for rendering one timestamp of the original data (429 × 267 × 19) from a different direction at a window size of 1440 × 900. Because of the resampling rate (460, 280 and 40) in the different direction, the FPS differs greatly. The highest speed is in the altitude direction, and the lowest is in the longitude direction. The average FPS is 43.0 in the longitudinal direction with the pre-integrated lighting approach, whereas the average FPS is 37.0 based on the improved approach without the gradient calculation. The comparison shows that it decreases to 26.9 after on-the-fly gradient calculation, to 23.6 after on-the-fly gradient calculation combined with coordinate transformation and 21.9 after on-the-fly gradient calculation combined with coordinate transformation and animation interpolation. The improved 3D texture-mapping approach is slower compared to the pre-integrated approach but provides greater interactivity and quality.
Table 1. The average FPS in different directions.
Although the relatively high FPS can be achieved in a different direction by using the GPU because the platform is designed on the basis of wide area network, various factors such as the network speed and data volume are significant when considering the data request and response. The original data were too large for a network transformation, and thus, we still need multiresolution data organisation and an LOD rendering strategy. With the time controller, the volume texture was rendered by dynamic interpolation to animate the movement of the typhoon in World Wind.
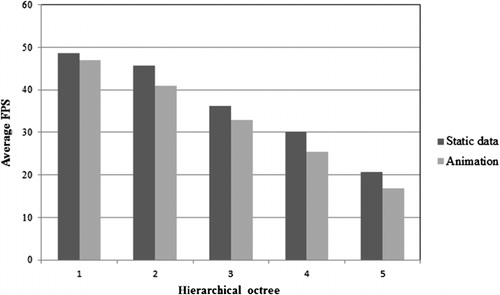
First, we evaluated how the multiresolution data structure affects the rendering. When the octree was constructed, rendering the data corresponded to fixed levels and resampling rate, and the FPS was recorded. Based on the improved 3D texture-rendering approach, we reached a relatively stable rendering speed compared with the original data from a different direction. As shown in , with the octree data structure, the FPS rates declined as the detail level increased. The average FPS was 20.4 and 16.84 for static and animation data, respectively, at the most detailed level. Because of greater data throughput, the speed is relatively less than for the original data without bricking.
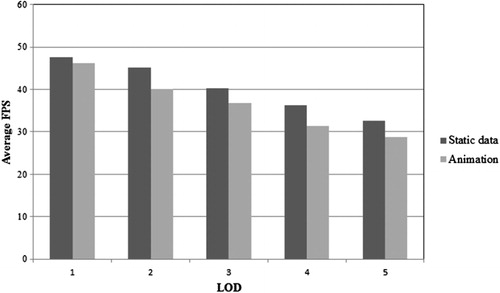
We use the LOD strategy to further accelerate the rendering when all of the cubes are organised in the proposed multiresolution structure, the continuous view-dependent LOD is configured, and the data likely span different levels. The LOD strategy yielded improvements in the rendering performance in the virtual globe environment. Data rendered at one level had the same LOD as low-resolution cubes, even when the viewpoints were far away. shows the FPS for the renderings with the LOD method. In both cases, the FPS declined with increasing detail. The performance decayed during the transitions between any two 3D matrices in the animation because more data were loaded into the GPU and more computational resources were needed to obtain a smooth effect. indicates that the performance of volume rendering with our enhancements is sufficient for dynamic volumetric data rendering.
7. Conclusions and future work
The objective of this paper is to propose a systematic framework for rendering typhoon phenomena at high speed in virtual globes. First, the traditional 3D texture-rendering algorithm is improved to render volumetric data on virtual globes on the GPU. Then, a hierarchical octree-based multiresolution data structure is used to organise the large volume of animation data, and a GPU-based dynamic volume texture interpolation is proposed to obtain a smooth rendering effect. Finally, these methods, combined with an LOD strategy, are integrated in the node visualisation function to realise an interactive dynamic visualisation of typhoon data in a virtual globe environment.
To illustrate the effectiveness of the proposed framework, data simulating a typhoon event were rendered in World Wind with and without the proposed strategy. Our experiments demonstrate that the proposed framework produces relatively high and stable FPS rates (>28.6 FPS) in the dynamic rendering process. The combination of these strategies enables efficient static rendering and smooth animation of dynamic phenomena at high speed.
The algorithm and approach discussed in this paper can process only regular gridded data. Irregular gridded data, including curvilinear or unstructured data, use a wide variety of configurations (Speray and Kennon Citation1990). Compared to regular grids, operations for irregular grids are more complicated (Kaufman and Mueller Citation2005). The simplest method is to resample the irregular grid to obtain a regular grid. To fix the resolution of the regular grid to the smallest cell in the irregular grid, the data can be resampled into a octree whose height is determined by the local granularity (Leven et al. Citation2002).The octree decomposition then allows the grid to be rendered within a dynamic rendering framework.
There are two issues that must be considered with respect to the rendering. The scalar intensity must be converted to RGB colour in the fragment shader using the transfer function, and it is important to design an appropriate function to present the inner structure of the typhoon in the client widget. In addition, the rendering speed varies with the volume texture resample rate, and thus, there is a trade-off between the rendering effect and speed.
Currently, this framework has been implemented only on one desktop or one laptop. The volume of time-varying typhoon data is very large, and the data storage and computation requirements are enormous. Further, the effectiveness of rendering methods may vary across computing platforms and are dependent on the nature of the applications in the network environment. Recent developments in cloud computing technology have provided a solution to these intensiveness issues and ensures the pooled, elastic and on-demand characteristics (Yang et al. Citation2011).We will present the framework on this new platform, and we will need to evaluate its efficiency in the new environment. The research results will also be integrated into the World Wind open-source library.
Additional information
Funding
References
- Ahrens, J., K. Brislawn, K. Martin, B. Geveci, C. C. Law, and M. Papka. 2001. “Large-Scale Data Visualization Using Parallel Data Streaming.” IEEE Computer Graphics and Applications 21 (4): 34–41. doi:10.1109/38.933522.
- Aurambout, J.-P., C. Pettit, and H. Lewis. 2008. Virtual GLobes: The Next Gis? Landscape Analysis and Visualisation: Spatial Models for Natural Resource Management and Planning. Berlin: Springer.
- Bailey, J. E., and A. Chen. 2011. “The Role of Virtual Globes in Geoscience.” Computers & Geosciences 37 (1): 1–2. doi:10.1016/j.cageo.2010.06.001.
- Boada, I., I. Navazo, and R. Scopigno. 2001. “Multiresolution Volume Visualization with a Texture-based Octree.” The Visual Computer 17 (3): 185–197. doi:10.1007/PL00013406.
- Brovelli, M. A., and G. Zamboni. 2012. “Virtual Globes for 4D Environmental Analysis.” Applied Geomatics 4 (3): 163–172. doi:10.1007/s12518-012-0091-3.
- Butler, D. 2006. “Virtual Globes: The Web-Wide World.” Nature 439 (7078): 776–778. doi:10.1038/439776a.
- Cabral, B., N. Cam, and J. Foran. 1994. “Accelerated Volume Rendering and Tomographic Reconstruction Using Texture Mapping Hardware.” Proceedings of the 1994 symposium on Volume Visualization, New York, October 17–18, 91–98.
- Clyne, J., and J. M. Dennis. 1999. “Interactive Direct Volume Rendering of Time-Varying Data.” Data Visualization 99: 109–120. doi:10.1007/978-3-7091-6803-5_11.
- Cullip, T. J., and U. Neumann. 1993. Accelerating Volume Reconstruction with 3D Texture Hardware. Technical Report TR93-027. Chapel Hill: University of North Carolina.
- Dachille, F., K. Kreeger, B. Chen, I. Bitter, and A. Kaufman. 1998. “High-quality Volume Rendering Using Texture Mapping Hardware.” Proceedings of the ACM SIGGRAPH/EUROGRAPHICS workshop on Graphics Hardware, Lisbon, August 8–9, 69–77.
- Dietrich, A., E. Gobbetti, and S.-E. Yoon. 2007. “Massive-Model Rendering Techniques: A Tutorial.” IEEE Computer Graphics and Applications 27 (6): 20–34. doi:10.1109/MCG.2007.154.
- Doleisch, H. 2007. “Simvis: Interactive Visual Analysis of Large and Time-Dependent 3D Simulation Data.” Proceedings of the 39th Conference on Winter Simulation: 40 Years! The Best Is Yet to Come, Washington, DC, December 9–12, 712–720.
- Gore, A. 1998. “The Digital Earth Understanding Our Planet in the 21st Century.” Australian surveyor 43 (2): 89–91. doi:10.1080/00050348.1998.10558728.
- Guthe, S., M. Wand, J. Gonser, and W. Straßer. 2002. “Interactive Rendering of Large Volume Data Sets.” IEEE Visualization, 2002. VIS 2002, Boston, MA, USA, 53–60.
- Heok, T. K., and D. Daman. 2004. “A Review on Level of Detail.” Proceedings of International Conference on Computer Graphics, Imaging and Visualization, Washington, DC, July 26–29, 70–75.
- Hibbard, W. L., B. E. Paul, D. A. Santek, C. R. Dyer, A. L. Battaiola, and M.-F. Voidrot-Martinez. 1994. “Interactive Visualization of Earth and Space Science Computations.” Computer 27 (7): 65–72. doi:10.1109/2.299413.
- Joseph Turk, F., J. Hawkins, K. Richardson, and M. Surratt. 2011. “A Tropical Cyclone Application for Virtual Globes.” Computers & Geosciences 37 (1): 13–24. doi:10.1016/j.cageo.2010.05.001.
- Kaufman, A., and K. Mueller. 2005. “Overview of Volume Rendering.” In The Visualization Handbook, edited by C. Johnson, and C. Hansen, 127–174. London: Academic Press.
- Kim, C. S., K. Parks, J. Park, J. Kim, and H. S. Lim. 2005. “Scientific Visualization of Time-Varying Oceanographic and Meteorological Data Using Vr.” 16th IEEE Visualization 2005 (VIS 2005), Minneapolis, MN, October 23–28, 97.
- Kniss, J., G. Kindlmann, and C. Hansen. 2002. “Multidimensional Transfer Functions for Interactive Volume Rendering.” IEEE Transactions on Geoscience and Remote Sensing 8 (3): 270–285.
- Kniss, J., P. Mccormick, A. Mcpherson, J. Ahrens, J. Painter, A. Keahey, and C. Hansen. 2001. “Interactive Texture-Based Volume Rendering for Large Data Sets.” IEEE Computer Graphics and Applications 21 (4): 52–61. doi:10.1109/38.933524.
- Kroes, T., F. H. Post, and C. P. Botha. 2012. “Exposure Render: An Interactive Photo-Realistic Volume Rendering Framework.” PloS One 7 (7): e38586. doi:10.1371/journal.pone.0038586.
- Lamar, E., B. Hamann, and K. I. Joy. 1999. “Multiresolution Techniques for Interactive Texture-Based Volume Visualization.” Proceedings of the Conference on Visualization'99: Celebrating Ten Years, San Francisco, CA, October 24–29, 355–361.
- Leven, J., J. Corso, J. Cohen, and S. Kumar. 2002. “Interactive Visualization of Unstructured Grids Using Hierarchical 3D Textures.” Proceedings of the 2002 IEEE symposium on Volume Visualization and Graphics, October 28–29, 37–44.
- Li, J., H. Wu, C. Yang, D. W. Wong, and J. Xie. 2011. “Visualizing Dynamic Geosciences Phenomena Using an Octree-based View-dependent LOD Strategy within Virtual Globes.” Computers & Geosciences 37 (9): 1295–1302. doi:10.1016/j.cageo.2011.04.003.
- Ljung, P., C. Lundstrom, A. Ynnerman, and K. Museth. 2004. “Transfer Function Based Adaptive Decompression for Volume Rendering of Large Medical Data Sets.” 2004 IEEE Symposium on Volume Visualization and Graphics, Washington, DC, October 10–12, 25–32.
- Lum, E. B., B. Wilson, and K.-L. Ma. 2004. “High-Quality Lighting and Efficient Pre-Integration for Volume Rendering.” Proceedings of the Sixth Joint Eurographics-IEEE TCVG Conference on Visualization, May 19–21, 25–34.
- Ma, K.-L., D. Smith, M.-Y. Shih, and H.-W. Shen. 1998. Efficient Encoding and Rendering of Time-varying Volume Data. Technical Report NASA/CR-1998-208424 ICASE Report No. 98-22. Hampton, VA: National Aeronautics and Space Administration, Langley Research Center.
- Meiβner, M., U. Hoffmann, and W. Straβer. 1999. “Enabling Classification and Shading for 3D Texture Mapping Based Volume Rendering.” Proceedings of the 10th IEEE Visualization 1999 Conference (VIS'99), San Francisco, CA, October 24–29, 207–214.
- Montea, C. F. P., F. Piccolib, C. Lucianod, S. Rizzid, G. Bianchinic, and P. C. Scutaric. 2013. “Estimation of Volume Rendering Efficiency with GPU in a Parallel Distributed Environment.” Procedia Computer Science 18: 1402–1411. doi:10.1016/j.procs.2013.05.307.
- Nocke, T., M. Flechsig, and U. Bohm. 2007. “Visual Exploration and Evaluation of Climate-related Simulation Data.” 2007 Winter Simulation Conference, Washington, DC, December 9–12, 703–711.
- Park, S., C. Bajaj, and I. Ihm. 2004. Visualization of Very Large Oceanography Time-varying Volume Datasets. Computational Science-ICCS 2004. Kraków: Springer, 419–426.
- Rezk-Salama, C., K. Engel, M. Bauer, G. Greiner, and T. Ertl. 2000. “Interactive Volume on Standard Pc Graphics Hardware Using Multi-textures and Multi-stage Rasterization.” Proceedings of the ACM SIGGRAPH/EUROGRAPHICS Workshop on Graphics Hardware, Interlaken, Switzerland, August 21–22, 109–118.
- Roettger, S., and T. Ertl. 2002. “A Two-step Approach for Interactive Pre-integrated Volume Rendering of Unstructured Grids.” Proceedings of the 2002 IEEE symposium on Volume Visualization and Graphics, Boston, MA, October 28–29, 23–28.
- Roettger, S., S. Guthe, D. Weiskopf, T. Ertl, and W. Strasser. 2003. “Smart Hardware-accelerated Volume Rendering.” Proceedings of the Symposium on Data Visualisation 2003, Grenoble, France, May 26–28, 231–238.
- Ruijters, D., and A. Vilanova. 2006. “Optimizing GPU Volume Rendering.” Journal of WSCG 14 (1–3): 9–16.
- Shen, H.-W. 2006. “Visualization of Large Scale Time-varying Scientific Data.” Journal of Physics: Conference Series 46: 535–544. doi:10.1088/1742-6596/46/1/074.
- Shen, H.-W., L.-J. Chiang, and K.-L. Ma. 1999. “A Fast Volume Rendering Algorithm for Time-varying Fields Using a Time-Space Partitioning (TSP) Tree.” Proceedings of the Conference on Visualization' 99: Celebrating Ten Years, San Francisco, CA, October 24–29, 371–377.
- Smith, T. M., and V. Lakshmanan. 2011. “Real-Time, Rapidly Updating Severe Weather Products for Virtual Globes.” Computers and Geosciences 37 (1): 3–12. http://www.sciencedirect.com/science/article/pii/S0098300410002657.
- Speray, D., and S. Kennon. 1990. “Volume Probes: Interactive Data Exploration on Arbitrary Grids.” SIGGRAPH Computer Graphics 24 (5), 5–12.
- Stegmaier, S., M. Strengert, T. Klein, and T. Ertl. 2005. “A Simple and Flexible Volume Rendering Framework for Graphics-Hardware-based Raycasting.” Proceedings of the Fourth Eurographics/IEEE VGTC Conference on Volume Graphics, Stony Brook, September 9–10, 187–195.
- Sun, X., S. Shen, G. G. Leptoukh, P. Wang, L. Di, and M. Lu. 2012. “Development of a Web-based Visualization Platform for Climate Research Using Google Earth.” Computers & Geosciences 47: 160–168. doi:10.1016/j.cageo.2011.09.010.
- Titov, A., E. Gordov, I. Okladnikov, and T. Shulgina. 2009. “Web-system for Processing and Visualization of Meteorological Data for Siberian Environment Research.” International Journal of Digital Earth 2 (1): 105–119. http://dx.doi.org/10.1080/17538940902866187.
- Van Gelder, A., and K. Kim. 1996. “Direct Volume Rendering with Shading via Three-dimensional Textures.” Proceedings of the 1996 Symposium on Volume Visualization, San Francisco, CA, October 28–29, 23–30, 98.
- Van Thu, T., and T. Krishnamurti. 1992. “Vortex Initialization for Typhoon Track Prediction.” Meteorology and Atmospheric Physics 47 (2–4): 117–126.
- Vroom, J. 1997. “AVS/Express: A New Visual Programming Paradigm.” Proceedings of AVS, Boston, MA, April 19–21, 65–94.
- Wang, H., K.-H. Lau, W.-M. Chan, and L.-A. Wong. 2002. “A PC-based Visualization System for Coastal Ocean and Atmospheric Modeling.” Proceedings of the Estuarine and Coastal Modeling (1999), New Orleans, LA, November 3–5, 1233–1243.
- Weiler, M., R. Westermann, C. Hansen, K. Zimmermann, and T. Ertl. 2000. “Level-of-Detail Volume Rendering via 3D Textures.” Proceedings of the 2000 IEEE Symposium on Volume Visualization, New York, October 9–10, 7–13.
- Westermann, R., and T. Ertl. 1998. “Efficiently Using Graphics Hardware in Volume Rendering Applications.” Proceedings of the 25th Annual Conference on Computer Graphics and Interactive Techniques, New York, July 19–24, 169–177.
- Wu, H., Z. He, and J. Gong. 2010. “A Virtual Globe-based 3d Visualization and Interactive Framework for Public Participation in Urban Planning Processes.” Computers, Environment and Urban Systems 34 (4): 291–298. doi:10.1016/j.compenvurbsys.2009.12.001.
- Yang, C., M. Goodchild, Q. Huang, D. Nebert, R. Raskin, Y. Xu, M. Bambacus, and D. Fay. 2011. “Spatial Cloud Computing: How Can the Geospatial Sciences Use and Help Shape Cloud Computing?” International Journal of Digital Earth 4 (4): 305–329. doi:10.1080/17538947.2011.587547.
- Yang, C., and L. Wu. 2010. “Gpu-Based Volume Rendering for 3D Electromagnetic Environment on Virtual Globe.” International Journal of Image, Graphics and Signal Processing 2 (1): 53–60. doi:10.5815/ijigsp.2010.01.07.