
Abstract
Approximately 34,000 aerial photographs covering large parts of Ethiopia and dating back to 1935–1941 have been recently recovered. These allow investigating environmental dynamics for a past period that until now is only accessible from terrestrial photographs or narratives. As the archive consists of both oblique and vertical aerial photographs that cover rather small areas, methods of image-based modelling were used to orthorectify the images. In this study, 9 vertical and 18 low oblique aerial photographs were processed as an ortho-mosaic, covering an area of 25 km2, west of Wukro town in northern Ethiopia. Using 15 control points (derived from Google Earth), a Root Means Square Error of 28.5 m in X 35.4 m in Y were achieved. These values can be viewed as optimal, given the relatively low resolution and poor quality of the imagery, the lack of metadata, the geometric quality of the Google Earth imagery and the recording characteristics. Land use remained largely similar since 1936, with large parts of the land being used as cropland or extensive grazing areas. Most remarkable changes are the strong expansion of the settlements as well as land management improvements. In a larger effort, ortho-mosaics covering large parts of Ethiopia in 1935–1941 will be produced.
1. Introduction
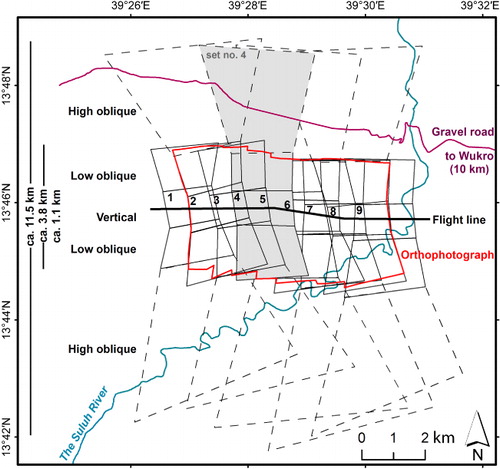
The aerial photographs of Ethiopia taken by the Italian Military Geographical Institute (IGMI) between 1935 and 1941 are the oldest remote sensing data of the country. They cover large parts of the central and northern highlands and form a unique dataset that allows the study of the status of the environment, in a period that until now is only accessible from terrestrial photographs (Nyssen et al. Citation2009; Frankl et al. Citation2011) or narratives (Pankhurst Citation1997). In total, ca. 34,000 individual aerial photographs were registered. Until recently, they were stored in old ammunition boxes of the Italian army which, together with age, strongly reduced their quality. Using multi-cameras, one vertical photograph, two low oblique photographs (28°30′ to the vertical) and one high oblique photograph (57°00′ to the vertical) were exposed simultaneously across the flight line (; Nyssen and Petrie Citation2013).
Stereographic analysis of the aerial photographs and subsequent mapping are originally made for the use of manual and analytical photogrammetric instruments that are no longer in use. The Santoni Stereocartograph and Stereosimplex instruments allowed corrections for the angular values of the oblique cameras when producing the stereo models (Nyssen and Petrie Citation2013). Producing orthophotographs from this material using conventional photogrammetric software did not deliver satisfactory results, as (1) stereo pairs of the vertical photographs cover small areas (ca. 4 km2) and (2) it was not possible to produce stereo models from overlapping oblique photographs. Moreover, fiducial marks were not present on the aerial photographs and no information was available on the camera calibration parameters.
Image-based modelling techniques allow textured 3D models to be created from large sets of (both terrestrial and airborne) photographs of the same surface taken from different positions. The methodology is based on semi-automated Structure from Motion–MultiView Stereo (SfM–MVS) workflows (Seitz et al. Citation2006; Verhoeven et al. Citation2013), which are integrated in software like PhotoScan (Agisoft). In recent years, detailed and accurate 3D photo models were created for small cultural heritage objects (Stal et al. Citation2012), buildings (Stal et al. Citation2011) and landforms (James and Robson Citation2012; Frankl et al. Citation2014). Using 20 vertical aerial photographs from 1945 over the Kreuttal region of Austria, Verhoeven et al. (Citation2013) produced an historical ortho-mosaic. In a similar way, Gomez (Citation2012) produced an ortho-mosaic of the Iwaki volcano (Japan) using vertical aerial photographs of 1965–1994. This reveals that multiple oblique and vertical aerial photographs taken over the same surface – as the 1935–1941 dataset of Ethiopia – are potentially suitable to be processed using image-based modelling.
The objective of this paper is, therefore, to use image-based modelling as a methodology to produce ortho-mosaics from multiple overlapping vertical and oblique aerial photographs taken from Ethiopia in 1935–1941. These ortho-mosaics will allow spatially explicit studies on past land use and cover or geomorphic processes.
2. Materials and methods
The scale of the vertical photographs collected by IGMI in 1935 is approximately 1:14,000, while the low and the high oblique photographs have scales of 1:15,000 and 1:26,000 (valid at their principal point). Sequential exposures have a longitudinal overlap of ca. 60%. The ground coverage of one assemblage covers a strip of approximately 11.5 km across the flight line, of which 1 km is recorded by the central vertical photograph ().
In this study, from one flight line, 9 vertical and 18 adjacent low oblique aerial photographs were used to create an ortho-mosaic (). The high-oblique aerial photographs could not be processed by image-based modeling due to (1) insufficient overlap as successive high-oblique aerial photographs were taken alternatively from left to right, (2) the very large image deformations induced by the large tilt of the camera, (3) very large relief displacements in the image and (4) the occurrence of large ‘blind’ areas hidden behind imposing mountain ranges. In total, the set of 27 aerial photographs covers an area of 25 km2. The area is located 10 km west of the town Wukro (North Ethiopia), a semi-arid limestone plateau dissected by the Suluh River valley. Elevations in the photographs scenery range between 1880 and 2140 m a.s.l.
First, the 27 aerial photographs (10 × 15 cm large) were scanned at 600 dpi with a desktop scanner (Nyssen and Petrie Citation2013). Then, the spatial extent of the aerial photographs was mapped on high-resolution Google Earth images (2006 Digital Globe, spatial resolution of ca. 0.5 m). Second, the individual vertical and low-oblique aerial photographs were pre-processed by optimising contrast and brightness in Adobe Photoshop. Overlapping vertical and low-oblique photographs were loaded in PhotoScan Pro, black borders where masked (in order to avoid erroneous matching) and the integrated semi-automatic SfM–MVS algorithm was run (Verhoeven et al. Citation2013). The SfM algorithm allows the creation of a 3D structure from multiple 2D images (i.e. aerial photographs). This included a feature point detection and description, image matching (cfr., defining tie-points), image triangulation and bundle adjustment (resulting in a sparse 3D point cloud of image matching points based on the projection of image pixels in 3D). As fiducial marks were not present on the aerial photographs and no information was available on the camera calibration parameters, a conventional photogrammetric inner orientation could not be performed. Hence, in PhotoScan, a separate camera model was estimated for each frame, neglecting the interior orientation but corresponding with the best-fitting linear geometry.
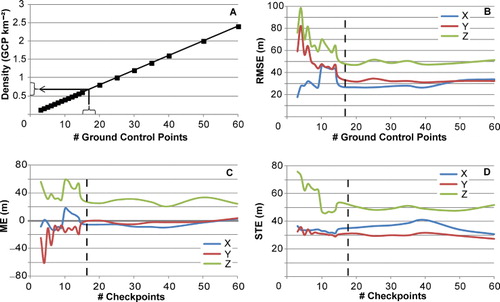
The absolute orientation was performed after the image alignment by assigning Ground Control Points (GCPs) to the images. These GCPs were defined by the unambiguous detection of characteristic points on the ancient images and Google Earth imagery (Frankl et al. Citation2013). The georeferencing of the model into WGS1984 was done by using points that occur on at least on two overlapping aerial photographs. Identifying GCPs on both Google Earth imagery and the aerial photographs was time-consuming, and depending on the area and image contrast, the number of points that could accurately be identified varied. In total, 76 GCPs could be identified that were well distributed in X, Y and Z. In order to determine the number of GCPs that needed to be selected to optimise the accuracy, models were produced with from 3 up to 60 GCPs, corresponding to a density of 0.12–2.4 points per km2 (). The Root Means Square Error (RMSE) was computed for the GCPs, and the Mean Error (ME) and Standard Deviation of the Error (SDE) was computed for the remaining checkpoints (not used in the georeferencing). This follows the guidelines of Smith, Chandler, and Rose (Citation2009), which define the ME as a good measure to detect systematic errors and the SDE as a measure for surface variability or precision.
Finally, the MVS algorithm in PhotoScan Pro produced a dense estimate of the surface geometry in the form of a Triangulated Irregular Network (TIN), which enabled a georeferenced ortho-mosaic to be generated. To get acquainted with the reality on the ground, a field visit was organised on 27 November 2013.
3. Results and discussion
Selecting the optimal number of GCPs for the absolute orientation was achieved by identifying the number of GCPs for which an additional increase in GCPs did not significantly affect the values of RMSE, ME and SDE (–). For all accuracy indicators (RMSE, ME and SDE), increasing the number of GCPs from 3 to approximately 15 resulted in more varied errors. Considering the RMSE in X, Y and Z, the values stabilised at an error of ca. 30 m in X and Y and ca. 50 m in Z when the number of GCPs was 15 or more (). Using 15 GCPs or more also caused the ME in X and Y approximately zero, meaning that no systematic errors occur in the planimetry (). For Z, a systematic 30-m overestimation of the elevation persists. This could be related to the poor resolution (90 m) of the Shuttle Radar Topographic Mission elevation data compared to the 3D geometry reconstructed by the SfM method. As the primary objective of this study was to produce an ortho-mosaic (being a true representation of the planimetry), a more detailed error analysis in Z was not done. We hereby stress that the models are not suitable for extracting elevation data or to study changes therein. The SDE of the checkpoints is similar to the RSME of the GCPs, although in X and Y increasing the number of GCPs did not seem to have much effect on improving the model accuracy (). From this, we retained 15 GCPs to produce the TIN and ortho-mosaic, corresponding to a GCP density of 0.6 GCPs km–2 (). summarises the resulting RMSE, ME and SDE. Considering that the SfM–MVS method yields accuracies of 1/1000 of the viewing distance, the planimetric accuracy of our ortho-mosaic (approx. 30 m in X and Y) is rather low; with the flight height being 2400 m above the ground surface, the maximal accuracy would be 2.4 m. However, this study uses aerial photographs of >70 years old that were stored in suboptimal conditions. Given (1) the deformation of the aerial photographs, (2) the very small intersecting angles of the corresponding rays, (3) the poor quality of the images and the lack of metadata (EXIF files) and (4) the geometric quality of the Google Earth imagery, the obtained error statistics can be viewed as optimal. From this dataset, improving the accuracy might be obtained when using GCPs that were recorded in the field with accurate Global Navigation Satellite System (GNSS) receivers or when using higher-resolution Digital Elevation Models. However, as indicated by James and Varley (Citation2012), using planimetric information from digital globes can yield accurate results. In addition, using GNSS receivers would limit the methodology to local studies, making the production of a country-wide 1935–1941 otho-mosaic unfeasible. Using original negatives (that include fiducial marks) may allow the calculations of an inner orientation of the aerial photographs and also improve the accuracy. These could, however, not be accessed for this study.
Table 1. Summarising statistics describing the accuracy of the retained photo-model with 15 GCPs.
In order to determine if the accuracy of the models is uniform for the scenery covered by the vertical and low-oblique aerial photographs, RMSEs were computed using GCPs identified on vertical and low-oblique aerial photographs, respectively. As indicated by a paired t-test (α = 0.05), the average errors in XYZ were not significantly different between the vertical and the low-oblique aerial photographs (p = 0.92).
shows the ortho-mosaic of the Ethiopian highlands of 1936, based on 15 CPs and the corresponding Google Earth imagery of 2008. The ortho-mosaic can also be viewed on http://geoweb.ugent.be/physical-geography/research/environment-ethiopia. The white stripes on the ortho-mosaic are areas for which a 3D surface could not be produced by PhotoScan and correspond to narrow gaps in ground coverage between the vertical and the low-oblique aerial photographs of one set, most probably due to manual cropping of the original aerial photographs when preparing the assemblages. Areas for which image matching was sub-optimal resulted in local distortions in the ortho-mosaic. The large variability in brightness between the different aerial photographs is also visible in the ortho-mosaic. The central part, which mainly corresponds to the vertical photographs, is generally brighter than the areas of north and south covered by the low-oblique aerial photographs.
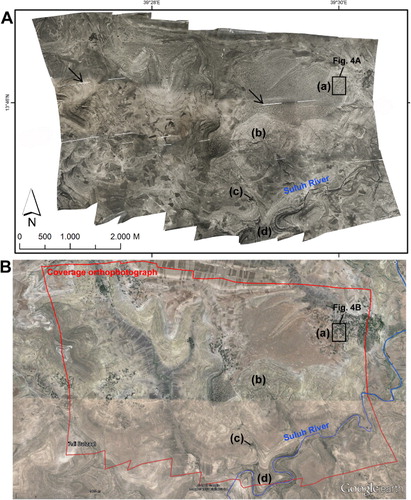
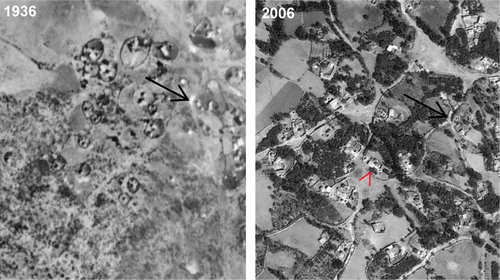
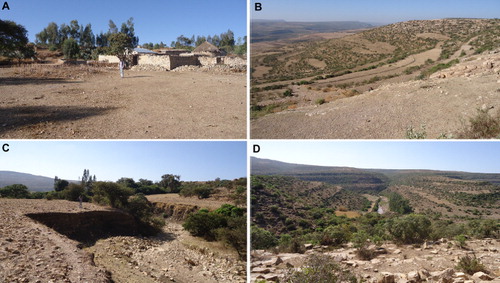
When comparing land use and management between the two periods, we can observe that the land use remained largely similar between 1936 and 2008 (). Large parts of the land were used as cropland and extensive grazing areas of sparse shrubland existed on steep slopes or where soils were too shallow to be cultivated. The areal expansion of the village of Zahina (a) is among the most remarkable changes between 1936 and 2008 ( and ). Moreover, the village area includes many more trees nowadays than ca. 80 years ago. The steep slopes that drain towards the Suluh River were incised by gullies in 1936 (b), and were covered by sparse shrubland and cropland. By 2008, land management on these steep slopes strongly improved with the introduction of stone bunds along contour lines (c) indicates a remnant forest which had the same extent in 1936 as in 2008. Preservation of the forest is due to the existence of the ‘May Cholot’ spring in the forest, which is considered as holy water by local communities. The vegetation cover in the Suluh River valley (d) did not change dramatically, although eucalypt plantations were introduced on the floodplain. The 2013 situation of (a), (b), (c) and (d) can also be viewed on terrestrial photographs in .
In order to develop a methodology for producing an ortho-mosaic, only 18 aerial photographs were used in this study. However, depending on the hardware used, ortho-mosaics can be produced for much larger areas, using more photographs. The maximum number of photographs that can be used mainly depends on the hardware. Studies are known that use more than 1000 photographs to produce image-based models (Castillo et al. Citation2013), indicating the potential for producing ortho-maps from the ca. 25,000 low-oblique and vertical aerial photographs of Ethiopia collected in the second half of the 1930s.
4. Software
PhotoScan recommends a hardware configuration of: CPU: Intel Sandy Bridge 2600 or 2700 RAM: DDR3-1600, 4 × 4 GB (16 GB total) or 4 × 8 GB (32 GB total) GPU: NVidia GeForce GTX 580. More information can be found on http://www.agisoft.ru/support. System requirements for Google Earth can be found on https://support.google.com/earth/?hl=en. For OS, Windows XP or later is required and for Mac, Mac OS X 10.6 or later.
5. Conclusions
In this study, multiple vertical and oblique aerial photographs taken from Ethiopia between 1935 and 1941 were used to produce a historical ortho-mosaic. This was done from image-based modelling methodologies integrated in PhotoScan. As a result, the Ethiopian landscape can be analysed from orthorectified large-scale aerial photographs, taking into account an planar error of ca. 30 m. Characteristics of historical land use and cover, geomorphological processes, etc., which until now could only be studied from archival terrestrial photographs or narratives, can now be studied from ortho-mosaics much in the same way as it is done for more recent periods. In a larger effort, multiple ortho-mosaics will be merged in order to produce an ortho-map of the early twentieth-century Ethiopian landscape.
Acknowledgements
The 1935–1941 aerial photographs were retrieved and scanned through a Memorandum of Understanding between the Ethiopian Mapping Agency (EMA), Mekelle University (Ethiopia) and Ghent University (Belgium); we particularly extend our thanks to Mr. Sultan Mohamed, Mr. Gezahegne Gebremeskel, Ms. Yetemwork Dejene and Ms. Shewaye (EMA), to Dr. Kiros Meles and Prof. Mitiku Haile (Mekelle University) and to Mr. Martijn Debever (Ghent University). Special thanks also to the people of Zahina village for their hospitality and to Seifu Gebreselassie and Dawit Lsanwerk for their support in the field.
References
- Castillo, C., P. Zarco-Tejada, M. R. James, M. Laredo, and J. A. Gómez. 2013. “Quantification of Gully Volume Using Very High Resolution DSM Generated through 3D Reconstruction from Airborne and Field Digital Imagery.” European Geosciences Union General Assembly, Vienna, April 7–12.
- Frankl, A., J. Nyssen, M. De Dapper, M. Haile, P. Billi, R. N. Munro, J. Deckers, and J. Poesen. 2011. “Linking Long-term Gully and River Channel Dynamics to Environmental Change Using Repeat Photography (Northern Ethiopia).” Geomorphology 129 (3–4): 238–251. doi:10.1016/j.geomorph.2011.02.018.
- Frankl, A., C. Stal, A. Abraha, J. Nyssen, D. Rieke-Zapp, A. De Wulf, and J. Poesen. 2014. “Detailed Recording of Gully Morphology through Image-based 3D Modelling.” Catena. In review.
- Frankl, A., A. Zwertvaegher, J. Poesen, and J. Nyssen. 2013. “Transferring Google Earth Observations to GIS-software: Example from Gully Erosion Study.” International Journal of Digital Earth 6 (2): 196–201. doi:10.1080/17538947.2012.744777.
- Gomez, C. 2012. “Historical 3D Topographic Reconstruction of the Iwaki Volcano Using Structure from Motion from Uncalibrated Aerial Photographs.” Accessed 5 May 2014. http://hal.archives-ouvertes.fr/docs/00/76/57/23/PDF/HAL-manuscript-IwakiSan.pdf.
- James, M. R., and S. Robson. 2012. “Straightforward Reconstruction of 3D Surfaces and Topography with a Camera: Accuracy and Geoscience Application.” Journal of Geophysical Research-Earth Surface 117 (1–7): 1–17. doi:10.1029/2011JF002289.
- James, M. R., and N. Varley. 2012. “Identification of Structural Controls in an Active Lava Dome with High Resolution DEMs: Volcán de Colima, Mexico.” Geophysical Research Letters 39: L22303. doi:10.1029/2012gl054245.
- Nyssen, J., M. Haile, J. Nauds, N. Munro, J. Poesen, J. Moeyersons, A. Frankl, J. Deckers, and R. Pankhurst. 2009. “Desertification? Northern Ethiopia Re-photographed after 140 years.” Science of the Total Environment 407: 2749–2755. doi:10.1016/j.scitotenv.2008.12.016.
- Nyssen, J., and G. Petrie. 2013. “Historical Aerial Photography of Ethiopia: Recovery and Organisation of Important Documentation from the 1930s.” GEO Informatics 16 (7): 32–36.
- Pankhurst, R. 1997. “A History of Early Twentieth Century Ethiopia.” Civic Webs Virtual Library. Accessed April 7, 2008. http://www.civicwebs.com/cwvlib/africa/ethiopia/pankhurst/early_20th_cent_ethiopia_1.htm.
- Seitz, S., B. Curless, J. Diebel, D. Scharstein, and R. Szeliski. 2006. A Comparison and Evaluation of Multi-view Stereo Reconstruction Algorithms. New York: IEEE Computer Society Conference on Computer Vision and Pattern Recognition, 519–528.
- Smith, M. J., J. Chandler, and J. Rose. 2009. “High Spatial Resolution Data Acquisition for the Geosciences: Kite Aerial Photography.” Earth Surface Processes and Landforms 34 (1): 155–161. doi:10.1002/esp.1702.
- Stal, C., A. De Wulf, K. De Coene, P. De Maeyer, T. Nuttens, and T. Ongena. 2012. “Digital Representation of Historical Globes: Methods to Make 3D and Pseudo-3D Models of Sixteenth Century Mercator Globes.” The Cartographic Journal 49 (2): 107–117. doi:10.1179/1743277412Y.0000000002.
- Stal, C., A. De Wulf, T. Nuttens, P. De Maeyer, and R. Goossens. 2011. “Reconstruction of a Medieval Wall: Photogrammetric Mapping and Quality Analysis by Terrestrial Laser Scanning.” EARSeL, Remote Sensing and Geoinformation 12.
- Verhoeven, G., C. Sevara, W. Karel, C. Ressl, M. Doneus, and C. Briese. 2013. “Undistorting the Past: New Techniques for Orthorectification of Archaeological Aerial Frame Imagery.” In Good Practice in Archaeological Diagnostics, edited by C. Corsi, 31–67. Swizterland: Springer International Publishing.