
Abstract
Initiatives that rely upon the contributions of volunteers to reach a specific goal are growing more and more with the success of Web 2.0–interactive applications. Also scientific projects are testing and exploiting volunteers' collaboration, but the quality of information obtained with this approach is often puzzling. This paper offers a rich overview of many scientific projects where geographic contributions are committed to volunteers, to the aim of defining strategies to improve information quality. By describing real examples of Volunteer Geographic Information (VGI), the contribution establishes a categorization based on the characteristics of the information, tasks, and scopes of the projects. After a discussion on the relationships of categories and VGI quality, the paper analyses techniques to improve the quality of volunteered information according to the moment of its assessment (i.e., ex ante, ex post, or both with respect to information creation). The paper outlines the main limitations of the different approaches and indicates some guidelines for future developments.
1. Introduction
Volunteer Geographic Information (VGI) was first coined by Goodchild as a special case of the more general Web phenomenon of user-generated content, when a geographic reference is specified (Goodchild Citation2007). Using VGI for scientific purposes is nowadays a hot research topic that the diffusion of the multimedia Web and Web 2.0 has made feasible with the ease of acquiring and publishing geo-referenced free texts and data, images and videos by crowdsourcing applications. The interest for such topic is testified by the growing number of initiatives that aim at collecting and organizing experiences of volunteers who are eager to aid a scientific project (i.e., the SciStarter project [http://scistarter.com], the Adventurers and Scientists for Conservation Project [http://www.adventureandscience.org], and the Science for Citizens project [http://www.scienceforcitizens.net]). There are also a number of ongoing scientific projects based on VGI in several fields of science that span from astronomy and planetary science, to biology, genome science, and natural and social sciences. Citizen Science – or Science 2.0 – has originally arisen to aid the scientific community to foster the collection of observations beyond the capacity of scientific researchers in a distributed, collaborative way, by calling upon the activity of volunteer citizens (Hand Citation2010). It encourages the use of Web-based domain platforms and location-based services for converting the observations of the real world into digital knowledge. In this way Citizen Science projects and their VGI content are becoming a pillar source of information in the Digital Earth framework. They constitute a bottom-up approach to the representation of both natural and human phenomena occurring on the planet and to their monitoring, measuring, and forecasting, as perceived by the human sensors capillary spread worldwide. Furthermore, VGI created in Citizen Science projects, differently than VGI for commercial purposes, necessarily needs to pass through a quality assessment phase before it can be turned into useful information that can be analyzed for the scopes of the scientific project. Thus, in general it can be considered as more reliable information than the VGI extracted from social media. Besides, while contributing to enhance the virtual representation of the planet, they improve social proactivity. Most Citizen Science projects rely on a huge amount of contributors (Kelling et al. Citation2009) and benefit from the appreciation of the scientific community.
Nevertheless, many researchers are skeptical of the usability of VGI in the scientific domain, due to the difficulty and frequent impossibility to assess the quality of each VGI item. The quality of VGI strongly depends on many aspects that comprise the type of contributions of the volunteers, the characteristics of the volunteers, and the way in which the information is created, by being aware or unaware OF the scientific plan for which it is used. Some scientific VGI projects have strongly stressed the need for accuracy of the contents related to the observed entities (i.e., eBird project, online available from http://ebird.org/content/ebird/).
In order to improve the use of VGI for science it is thus necessary to offer methods to assess the quality of the collected information. The definition of VGI quality implies analyzing possible causes of quality degradation and paves the path to adopt regulating policies, to cleanse the created information, and to constrain data entry by volunteers so as to minimize the possible creation of weak VGI items, characterized by errors, ambiguities, incompleteness, and inaccuracies.
Keeping that in mind, in this paper we initially review and categorize the VGI in Citizen Science projects, focusing the analysis on the way they deal with VGI quality (Section 2); we then describe ways in which it can be improved (Section 3). In the conclusion we summarize the main achievements and draw the line of a user-driven quality assessment approach.
2. VGI projects for Citizen Science: a categorization proposal
The scientific projects using VGI can be classified by means of distinct criteria. Generally they deal with information, which is a very general term that comprises both data and knowledge about data. If one characterizes data as a property of things, and knowledge as a property of an agent, information can be regarded as establishing a relationship between agents and things (Boisot Citation1998; see ).
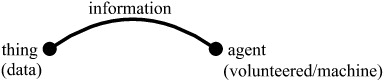
By following this paradigm, the quality of information provided in VGI projects can be defined by considering both the type of the contributions requested to the volunteers, i.e., the types of task, and the characteristics of the agents, i.e., the volunteers, and, not least, the technologies used to manage the data.
A recent effort by Connors, Lei, and Kelly (Citation2012) models and represents the intersection between VGI and Citizen Science in the environmental context by means of three categories, which are the level of participation, the specialization of volunteers, and the kind of information entered.
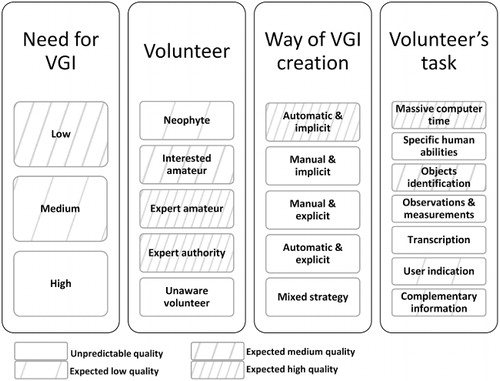
In this paper we propose to classify VGI projects for Citizen Science on the basis of five categories (and a set of related values) shown in . With respect to the categorization proposed in Connors, Lei, and Kelly (Citation2012), we introduce new categories: the scientific field of application and the need for VGI, which refer to the ‘thing/data’ side of the information bridge in . The other categories adopted, i.e., volunteers’ task, way of VGI creation, and characteristics of the volunteer, refer to the ‘agent’ side and can be related with the categorization in Connors, Lei, and Kelly (Citation2012). The specialization of volunteers described in that work can be related with the characteristics of the volunteer in , while both the level of participation and the kind of information entered are related with the kind of task required to the volunteer (‘Volunteer’s Task’ in ).
Table 1. Categorization of VGI projects.
This categorization is introduced to thoroughly understand the possible factors and characteristics of the quality of the created information. Each column label is a category independent from the others. The columns contain the possible values of each category. Values can be ordered or not. For example, values of ‘Need of VGI’ are ordered with respect to the importance of geographic information for the project (low, medium, high). The same could apply to the ‘Volunteer’ since values are ordered with respect to the skill and ability of the volunteers in creating information.
All categories are discussed here following, with examples taken from projects dealing with spatial data. Each discussion is completed, wherever available, with some considerations on VGI quality that can be expected.
2.1. Scientific field
Information quality greatly depends on the application field and the objectives of the application. Citizens Science projects and VGI are becoming very popular in many fields among which are Astronomy and Space Sciences, Computer and Electronic, Cultural Heritage, Natural Science, Medicine, Biology, Social Science, Weather, and Environment. The scientific field to which the project refers is crucial, as it often determines significant choices in data format, referring standards, lexicon, applications, and last but not least the information quality characteristics and quality needs. For example the quality requirements for a weather forecast application are different by those for a Cultural heritage project.
2.2. Types of task required of the volunteer
Projects can be also distinguished with respect to the task to be performed by the volunteers. A broad distinction was proposed by Bonney et al. (Citation2009) with three major models of participation: contributory projects are those where members of the public contribute data; collaborative projects ask volunteers not only to contribute and analyze data but also to help in refining project design, or in disseminating results; and co-created projects are those in which the public is working together with project designers, with some volunteers actively involved in distinct or all steps of a process. In the following we refine this model by considering the kind of resources that are crowdsourced. This has some similarity with the ‘level of participation and engagement of participants in Citizen Science activity’ as proposed by Haklay (Citation2012).
In the following we consider seven distinct tasks.
2.2.1. Massive computer time
Some projects just need that the volunteers make available the computer time of their PCs in order to automatically execute some processes that are supplied by the managers of the projects and that require huge computational costs. The project then needs to collect the results of the elaborations. In this case the volunteers are not providing proper geographic contributions, but a grid computer structure for powering the execution of an objective. Such projects require very low participation of the volunteers.
The Berkeley Open Infrastructure for Network Computing (BOINC) software (online available from http://boinc.berkeley.edu/) has been used by many projects that need a massive crowdsourced version of distributed computing for scientific necessities.
For instance, BOINC is used by the Climate prediction initiative (http://climateprediction.net/), which is a distributed computing project to produce predictions of the Earth’s climate up to 2100 and to test the accuracy of climate models. People around the world can provide their computers’ time to run a climate model. It runs as a background process and the results are automatically sent back. While the volunteers are able to see a summary of their results on the project website, their required participation is minimum and the quality of the results depends on the software and hardware used.
2.2.2. Specific human abilities
Some projects may need the execution of a human manual task, in which humans excel while computers do not. Such projects are contributory projects requiring a certain level of engagement. For example, the Galaxy Zoo project (http://www.galaxyzoo.org/.) uses volunteers’ ability to classify the shapes of hundreds of thousands of galaxies present in the huge amount of deep field images drawn from the National Aeronautics and Space Administration (NASA) Hubble Space Telescope. Shape recognition is a task at which human brain acts better than even the most advanced computer program. Participants are given pictures of galaxies and are required to answer certain questions like ‘Is the galaxy cigar shaped?’ and ‘Could the disk be viewed edge-on?’. The questions and images that are presented fit the human’s ability to identify similarities and differences based on visual appreciation. Using the same software developed for the project (Zoouniverse), citizen scientists can help researchers in several tasks related to research fields different than astronomy. Just like in the Whale Song Project, where participants are engaged in recognizing the call of killer orcas. The resulting dataset supports scientists in understanding pilot whale behavior.
When the volunteer is aware of the task and objective of his/her manual contributions, he/she can be asked to auto-evaluate the quality of the information he/she has created, like in the Galaxy Zoo project. The auto-evaluation approach is quite common in reviewing systems and can be used to weigh the reliability of the created information by a given volunteer.
2.2.3. Objects identification
These contributory projects require providing information on the observation of a huge number of objects of interest, geographically distributed, such as birds, plants, etc., and classification of related semantic, such as the species, together with other ancillary information, such as the area where the object is observed (geographic footprint), a description and photographs of the object, the time of the observation, etc. These are the majority of the Citizen Science projects in natural sciences, such as the many projects on birds and insects watching and plants observation. Many of these projects mainly need qualitative information or ask for interpreting the meaning of each observed entity: for example, to understand the differences between subtle shades of feather colors or bird calls, or the ground pattern indicating potential archeological sites. Among the many bird-watching projects, we recall the eBird project (http://ebird.org/). eBird employs volunteers to contribute their observations to a worldwide database that helps scientists learn more about the many species of birds.
The Great SunFlower project (http://www.greatsunflower.org/) gathers information about urban, suburban, and rural bee populations to learn about what is affecting pollination of gardens, crops, and wild lands.
The Wildlife Health Event Reporter project (http://www.whmn.org/wher/) is an experimental tool that records wildlife observations by citizens concerned about dead or sick wildlife. WHER is part of the Wildlife Health Monitoring Network, a Web-based open source system that supports data entry, storage, reporting, analysis, and exchange.
Other interesting projects in the spatial data realm are the OakMapper project (http://oakmapper.org/), the River Bone Collection project (http://www.adventureandscience.org/bone-collection.html), and the Open Dinosaur Project (http://opendino.wordpress.com/).
These above projects generally need a high quality of classification of the observed objects, while they may tolerate inaccuracies about their location.
2.2.4. Observational measurements
The concept ‘citizens as sensors’ has been coined to name the projects that employ volunteers to perform some measurements on the objects of interest (pollution concentration, traffic intensity, etc.), by the use of instrumentations or sensing devices. These projects are those that are most requiring with respect to the quality of created information to make scientists aware of the errors they might incur by using such measurements.
These projects can be both contributory and collaborative. Users may be asked to perform either simple quantitative measurements, which require some analysis and qualitative reasoning, or accurate measurements involving sophisticated instrumentations, skill, and specific abilities.
Several examples exist, in which public agencies or organizations ask citizens for help in collecting observations based on their perceptions. Often, the issue regards public safety and assistance, but sometimes it is related to scientific research. This happens, for instance, in the ‘Did You Feel It?’ Web service by the United States Geological Survey (online available from http://earthquake.usgs.gov/earthquakes/dyfi/) and in the Italian analogous service ‘Hai sentito il terremoto?’ by the National Institute of Geophysics and Volcanology (http://www.haisentitoilterremoto.it/), in which a website is dedicated to gather contributions regarding citizens’ experience of earthquakes. In these projects an online questionnaire is addressed to inhabitants, having as final goal the understanding of the local macro seismic intensity perceived by the observers. Fast contributions, in the immediate post-event, can play a role in the compilation of the shaking map and in the allocation of assistance, while the whole mass of information helps to better understand the relationship between earthquake intensity and its perception.
Other projects require the use of simple measurement tools. For example, the Snowtweets project (http://snowcore.uwaterloo.ca/snowtweets/) requests users to make a simple measurement of snow depth by a common ruler and does not require any interpretation of the data or analysis of the type of snow.
Other projects may need sensors to perform the task: new devices integrated into mobile phones are available for several scopes. The mCrowd (http://crowd.cs.umass.edu/) lets task designers select sensors for smartphones, including 3G, Wi-Fi, accelerometer, audio, Global Positioning System (GPS), gathering on-body electrocardiograms, using these data streams to create route-based or spatial sensing tasks. Through the use of such sensors, people can participate in collecting and sharing measurements of their living environment, allowing them to make even more detailed observations of their communities regarding, for example, city traffic, weather, air quality, pedestrian flow, environment, and rhythms of urban life.
The AIR project (http://www.pm-air.net/) is a public, social experiment in which people carry portable air-monitoring devices to sense pollution and fossil fuel burning hotspots. Volunteers are able to see pollutant levels in their current locations, as well as simultaneously view measurements from the other AIR devices in the network, as well as to see their distance from known pollution sources.
After the 2010 oil spill in the Louisiana Gulf, a group of educators and technologists organized the Gulf Oil Mapping project (http://publiclaboratory.org/place/gulf-coast) to assist residents in producing high-resolution aerial imagery of the spill’s effects, releasing them into the public domain. The project aims not to duplicate the satellite or flyover imagery, instead leads residents to use balloons, kites, and other simple and inexpensive tools to produce their own documentation of the spill, with the purpose to support environmental research, policy, and regulatory changes.
Safecast (http://blog.safecast.org/) is a global sensor network of volunteers set up after the Japan Tsunami in 2011 for collecting radiation measurements by various geigers, counters, and spectrometers and sharing them via Pachube, an open-source platform for monitoring sensor data (http://arduhome.jimdo.com/pachube/).
The GLOBE Student Climate Research Campaign (SCRC, online available from http://globe.gov/web/scrc/overview/) engages students in measuring, investigating, and understanding the climate system in their local communities.
2.2.5. Transcriptions and corrections
In these projects users are given existing data and are asked either to transcribe them into another form usable by project scientists or to amend them. For example, the Herbaria@Home and OldWeather projects (online available from the websites http://herbariaunited.org/atHome/ and http://www.oldweather.orgrespectively/) scan historical paper records from over a hundred years ago and ask participants to read the information and load it into the project geographical database. Most of the tasks is relatively simple and can be performed by less experienced or beginner citizen scientists. These projects evaluate the quality of the transcriptions based on their correctness and intelligibility.
2.2.6. User indications
These projects may require either low or high engagements of volunteers. Minimum engagement may mean just ratings of appreciation or scores or votes of already loaded contents. This is the case of the cultural projects that ask volunteers to express their evaluations of historical, archeological, cultural, and environmental sites. These projects need to take care of spamming contributions created on purpose by malicious volunteers to discredit a site.
Projects requiring high engagement may ask citizens to define the needs and goals of the research itself, such as in e-democracy collaborative and co-created participatory projects (Bonney et al. Citation2009). A seminal project is the SuScit – Citizen Science for sustainability (http://www.urbansustainabilityexchange.org.uk/ISSUESOutputSuScit.html) that attempted to provide local communities, particularly socially and economically outsiders, such as old and young people, and those from ethnic minority communities, with a voice in the future of urban sustainability research.
2.2.7. Contextual and complementary information
Such projects ask volunteers to add complementary or contextual information to archived objects in order to enrich or fill gaps in collections. For example, the project 1001 Stories of Denmark (http://www.kulturarv.dk/1001fortaellinger/en_GB) invites citizens to contribute their own stories about objects in the history of Denmark by linking objects from contributing heritage institutions to times, places, and personal stories. A good review of contextual and complementary projects in the cultural heritage field can be found in Oomen and Arovo (Citation2011). These projects evaluate the quality of the contributions mainly depending on their intelligibility and completeness.
2.3. Ways of VGI creation
A further categorization regards the way the information is created by the volunteers. This aspect has a direct impact on the quality of the information, while a piece of information can be created implicitly or explicitly, automatically or manually.
2.3.1. Automatic and implicit
The projects requesting massive computer time generate information automatically by means of the software tools installed on the PCs of volunteers, who do not explicitly participate in the creation. The quality of this kind of information is automatically under control of the hardware and software equipment provided by the project.
2.3.2. Manual and implicit
When the volunteers are engaged in playing a game or perform some specific tasks manually, even if they do not have any scientific knowledge of the problem, they contributions are requested. An example can be found in the Old Weather project (http://www.oldweather.org/), where volunteers, who might not have any experience in climate modeling, play a game by taking part of the crew of an old vessel by making transcriptions of the original data logs. The reward consists in advancing their career on board depending on the number of transcriptions. These transcriptions help scientists in enriching their knowledge on old environmental phenomena and in better modeling the climate dynamics.
Some control on the created information is necessary to prevent spamming. Some projects evaluate the agreement of the volunteers in playing the same game in order to filter and remove spamming.
Another case of manual and implicit creation of information occurs when users act as unaware sources of information for public utility projects. Google Flu Trends (information available at http://www.google.org/flutrends/) is a good example: it uses aggregated Google search data to estimate current flu activity around the world in near-real time. Comparing the Web query counts with traditional flu surveillance systems, Google’s analysts found a close relationship between the number of people searching for flu-related topics and the number of people actually having flu symptoms. Thus, by aggregating these search queries, the model can estimate how much flu is circulating around the world, providing a complement to existing surveillance systems, which most focus on a single country or region (Ginsberg et al. Citation2009).
2.3.3. Manual and explicit
When the volunteer is aware of the return and objective of his/her actions, he or she is required to have some knowledge of the scientific problem and may need some training. In this case, the project may ask an auto-evaluation of the ability of the volunteer in performing the task. This is the case of the Galaxy Zoo project that asks participants to express with a score the confidence they have in classifying galaxies. Other projects, such as the Larvae Monitoring project (http://www.mlm.org), do not get rid of volunteered data that are affected by errors and inaccuracies. They do not amend or remove such data so as not to upset the contributors, since their primary concern is keeping volunteers engaged with the project.
Other projects try to control the quality of the information by requesting answers to a few simple questions, such as in the CreekWatch project (http://creekwatch.researchlabs.ibm.com/) that collects data on water quality in creeks and streams where the contributor is requested to answer closed questions such as ‘How much rubbish can you see?’.
2.3.4. Automatic and explicit
This is the case of most projects requiring observational measurements by means of sensors. The expertise required of the volunteers varies depending on the kind of measurements and sensors, spanning from the use of GPS devices that request small training, to sophisticated sensors. The quality of the created information depends on both the characteristics of the sensors, the ability of the volunteers in using them, and the characteristics of the sensing environment. Some projects try to ensure the quality of the measurements by employing experts as volunteers, by requiring skills and providing training courses – such as in CoCoRaHS project for collecting precipitation measurements (http://www.cocorahs.org/) – or by verifying the data, receiving them twice and performing cross-checking, such as in the Open Dinosaur Project. Some projects, requiring objects identification based on the BudBurst mobile application (http://neoninc.org/budburst/), help the information quality control by automatically geotagging data and photos captured with smartphones. This happens, for instance, in the ‘What’s invasive’ project (http://whatsinvasive.com/) that allows participants to map invasive species of plants in natural parks, and in the Floracaching project (Hsieh and Graham Citation2011) that involves its community in a social game to monitor plant phenology.
2.3.5. Mixed strategy
There are projects that are hybrid with respect to the way information is created; in fact, some pieces of information are automatically acquired by sensors, such as GPS coordinates, while others are manually created by volunteers. An example of both explicit and implicit creation of VGI is the Sickweather initiative (http://www.sickweather.com/). The algorithm used in Sickweather is able to track and map personal health information made publicly available through social media like Facebook and Twitter. Alternatively, citizens can report directly their symptoms and health conditions anonymously via the website of the project.
2.4. Need for VGI
Strictly speaking, VGI is intended as information relative to geographic objects, either natural entities, such as a mountain or a lake, or administrative or cultural entities, such as a city, a nation, a museum, etc. Among the most well known projects, we recall the Open Street Map project (http://www.openstreetmap.org/) and the OpenAddresses project (OA, described in Stark Citation2010), whose aim is to collect geo-coded addresses by volunteers in the central database of the Wikimapia project (http://wikimapia.org/), conceived to provide a crowdsourced geographic gazetteer, with the resulting datasets available to everybody at no charge. These above projects need geographically homogeneously distributed VGI with high spatial accuracy, and thus they can be qualified as highly needing VGI. Other famous VGI initiatives are Panoramio, Flickr, and Geograph (that can be consulted from http://www.panoramio.com/, http://www.flickr.com/map/, http://www.geograph.org/, respectively), aimed at collecting pictures and information about natural attractions on Earth.
Nevertheless, VGI in a wide sense comprises also projects in which the objects of interest are not strictly geographic features, but their geographic footprint is relevant, such as in most projects about objects identification (birds, insects, plants, or others). In such projects the spatial quality of VGI is not necessarily as accurate as for the VGI ones. A certain level of inaccuracy in locating objects of interests can be tolerated, while a greater accuracy is needed in classifying the detected objects. We can qualify such projects as with medium need for VGI.
Finally, we have the contributory projects with low need for VGI: if it is provided, it can add value to the information collected by the volunteer.
2.5. Characteristics of the volunteer
To conclude, we consider the categorization based on the type of the volunteers. There are several aspects that characterize and motivate volunteers: they can be common citizens motivated by the wish to participate in a user-centered need, for example, for water quality control in CreekWatch; young people who are attracted by the game interface of the project, as in Phylo (http://phylo.cs.mcgill.ca); amateurs and enthusiast motivated by the wish to contribute to science, such as in eBird; and experts in the field of the projects or organizations of volunteers, such as Greenpeace that participate in the Safecast project. Last but not least, they can be unaware volunteers, who created information for a personal purpose, distinct from that of the research, as in the Google Flu Trends project. The motivation and expertise of the volunteers also have a great impact on the quality of the created information.
Many different analysis focused on the characterization of users generating Web contents, the so-called producers (Bruns Citation2006), in terms of their experience and prevalent activities (Coleman et al. Citation2009), motivations (Goodchild Citation2007), and type of contribution (Anthony, Smith, and Williamson Citation2005; Priedhorsky et al. Citation2007; Goodchild Citation2009).
We use the categories proposed in Coleman et al. (Citation2009) to describe the background of the producers and revise them within the context of science-oriented initiatives. We consider six major types of volunteers; the first five are aware volunteers and are discussed in ascending order of experience and increasing complexity of their features and activities. They are the neophyte, the interested amateur, the expert amateur, the expert professional, and the expert authority. A further type of volunteer is the unaware volunteer, whose characteristics may be heterogeneous with respect to experience and engagement (Criscuolo et al. Citation2013).
2.5.1. Neophyte
The neophyte is a volunteer having no official background on the topic of the research. Nevertheless, he/she has interest, time, and willingness to contribute to the project. He/she can take on quite simple tasks, requiring either automatic or manual processes, provide timely feedback and enter comments related to the context (pictures, coordinates, direct experience of local phenomena, etc.). He/she usually acts individually and spontaneously, either motivated by altruism, curiosity, and competitive spirit or to get gratification from viewing his/her entries on a public, highly visible platform. Although neophytes generate contributions that are subject to errors and inaccuracies, committed to naivety or unfamiliarity, they are valuable because they provide original contents, which generally reflect a characteristic perception of the investigated phenomenon, by either a social or a professional category. They help in covering the research area with local data. If the neophyte keeps piqued his interest in participating in the scientific topic, he/she can decide to improve his/her experience, specialize his/her entries, and begin to coordinate with other contributors, by joining group actions or sharing experiences within a community.
2.5.2. Interested amateur
We can call interested amateurs those people who, after discovering their interest in a project or scientific domain, begin collecting information and experimenting, gaining some experience on the subject. Sometimes they benefit from a kind of training, offered by the proponents of the project. The contributions of these volunteers are often richer and more detailed, less tainted by defects of form, with respect to those of the neophyte, but still potentially subject to technical inaccuracies. The interested amateur, usually applied for elementary or automated tasks, often gets involved in more demanding operations and can start cooperating with other volunteers with whom he/she comes into contact or participate in actual campaigns of data collection. Such volunteers have a higher reliability than neophytes, and their most precious value is their constant engagement in the project over time.
2.5.3. Expert amateur and the expert professional
Unlike the previous ones, the expert amateur and the expert professional are very familiar with the scientific issue addressed, in which they are skilled since before joining to the call for contributions. The subject of the research could be a rewarded work for the professional, while it is just an interest to the amateur, cultivated apart from his/her technical and professional background. Volunteers belonging to both these categories can provide valuable contributions either in the form of original data and information and of comments, corrections, verifications, and evaluations of the contributions submitted by other volunteers. Their motivations may be the desire to share knowledge, pride in showing their expertise to a wide audience, thereby enhancing their reputation and receiving appreciation, desire to join a community, and the hope of contributing to social benefits. However, there are cases in which professional experts, can take advantage by intentionally submitting falsified information or can methodically enter incorrect contributions to create confusion and mistrust toward the project. For example, Cohen (Citation2008) refers malicious reports to the site iReport.com causing economic benefits to companies and Priedhorsky et al. (Citation2007) relate false entries in Wikipedia.
2.5.4. Expert authorities
Finally, some volunteers may be called expert authorities, by virtue of their studies and their extensive experience in the research topic. This background provides them with maximum credibility and enables them not only to provide significant content and feedback but also to increase or to bring down both the reputation of the project and of the individual contributors through their judgments. If not directly involved in managing the research project, these experts are motivated to participate primarily by the desire to contribute to activities on which they are placing special trust or by the intention to introduce a personal view in the research.
2.5.5. Unaware volunteer
This type of volunteers are distinguished from the previous ones for the main fact that he/she is unaware, or does not care, that the information he/she is creating on the Web will be used by others for scientific or other purposes than he/she intended for. These creators may be improperly named volunteers, since they do not intend to participate in a scientific plan and may have heterogeneous characteristics with respect to the expertise in creating information: this is the case of the pictures shared by Web albums, unknowingly documenting some natural elements or occurrences. In specific contexts, they can be useful for research or monitoring purposes, but the quality needs to comply with the requirements stated by the project manager. To use the information created by unaware volunteers for a distinct scientific purpose, one needs to apply an information-filtering approach: besides assessing the information quality, it also evaluates the information relevance to the project, which depends on the semantics of the information.
In summary, the characteristics of the volunteers are very influential in determining the quality of the information. Common citizens, highly motivated by the wish to participate in a user-centered need, and amateurs, motivated by the wish to contribute to science, may both provide high-quality information; expert authorities, with maximum credibility, can provide significant content and feedback to the project leaders but sometimes can bring down the reputation of both the project and the individual contributors through their judgments. Thus, control mechanisms of the reliability of the contributors are needed.
3. Improving VGI quality: ex ante and ex post strategies
It is unanimously recognized that the control on the quality of geographic information influences the reliability of spatial analysis outputs and related decision-making processes. The geographic data quality issue has become a sub-discipline of GI Sciences and geomatics (Eppler and Wittig Citation2000). A survey of 30 years of research on spatial data quality achievements can be found in Devillers and Jeansoulin (Citation2006). As far as geographic data quality, the ISO 19113:2002 and ISO 19114:2003 standards defined as consensual dimensions of geographic data quality the positional, temporal, and thematic accuracy, the logical consistency, the lineage and completeness of data. Even more important is the assessment of the quality of VGI, characterized by greater heterogeneity and inaccuracies than traditional geographic data produced by authoritative sources (Ostermann and Spinsanti Citation2011). Nevertheless, the assessment of VGI quality is a critical point that any scientific project, willing to exploit VGI, must face (Crowston and Wiggins Citation2011). The literature of VGI quality assessment is quite recent (Goodchild and Li Citation2012; Ostermann and Spinsanti Citation2011). Critical points that impact on VGI quality are the heterogeneity of expertise and commitment of the users, the media formats of the various social media platforms, which lead to a variety of data structures, the lack of syntactical control on the users’ contributions, and the redundancy of users’ generated contents. For large volumes of VGI, automated approaches are needed to control and assess the VGI quality by supporting retrieval and filtering tasks.
Furthermore, as far as the current technologies are concerned, one cannot analyze the VGI quality without taking into account the characteristics of the Web, since VGI projects essentially exploit this mean to transfer data from a contributor to an archive.
Due to the uncontrolled nature of the Web, further quality dimensions that deserve attention are those characterizing the trustworthiness, i.e., the authorship, authority, timeliness, and popularity (Batini, Palmonari, and Viscusi Citation2012; Herrera-Viedma et al. Citation2006).
In order to contribute to the debate, we adopted an analytical approach, and on the basis of the previous section 2, can be revisited, by identifying the level of VGI quality that can be predicted in each proposed category. Only the scientific field category has been taken apart, since the VGI quality in principle does not depend on the disciplinary sector. The results are presented in , which displays how, in many cases, the quality of information provided by VGI is unpredictable on the simple basis of the project categorization (white boxes). In general, both the expertise and skill of the contributors or the exploitation of automatic and objective ways to provide information cooperate in generating trust. Some exceptions still hold: for example, obtaining information by sensors is not always a guarantee, as they can be ill maintained or ill used; in some cases, expertise and skill can be misused in offering detailed but malicious contributions.
From these considerations, it appears that for a broader and reliable exploitation of VGI approach, it is important to design general strategies for quality improvement by helping the growth of expertise, encouraging self-evaluation, checking and filtering information, and preventing attacks.
In what follows we describe in more detail the approaches to improve VGI quality as adopted in various projects and distinguish them by considering the time of their application as related to the time of VGI item creation:
ex ante approaches, when the improvement actions are taken before VGI activity;
ex post approaches, when volunteer information is improved after collection.
An evaluation of the quality assessment methods was carried out in Wiggins et al. (Citation2011) where the authors analyzed the policy of data validation and quality assessment in around 300 Citizen Science projects. They found out that the most common way for data validation is ex post based on experts’ reviews by trusted individuals or moderators (more than 77% of the sample). This method is followed by the ex ante method based on the submission of photos (40% of the sample), which permits online checking by experts. Many projects (around 75%) apply multiple validation mechanisms, among which the most common one employs experts’ reviews and photos (23%) together.
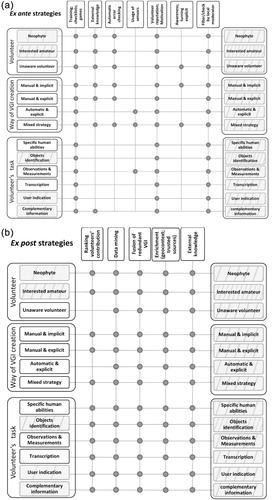
The descriptions of ex ante and ex post strategies (in Sections 3.1 and 3.2, respectively) are related to the classification sketched in , illustrating their effects on the expected VGI quality (see and ).
A couple of general comments can be added before describing the two approaches. Heterogeneous quality is recognized as a main characteristic of VGI (Haklay Citation2012). Goodchild (Citation2007) coined the new map ‘patchwork’ paradigm for VGI, in which the accuracy of every piece of the patchwork, and the frequency with which it is updated, can be assessed by local needs. Assuming this paradigm, an approach to the quality assessment can depend on the needs of a project and can vary within the project itself, across space or user. For example, OakMapper project separates laboratory-confirmed points, which are held to a higher degree of rating, from other points (Connors, Lei, and Kelly Citation2012). In this way, different quality expectations for each dataset and each user can be set and applied for different purposes.
Moreover, reinforcing the perceived value of VGI items is a way to improve their quality, which depends on both the clarity of how data match the geographic characteristics and the knowledge of how data have been collected. Thus, comparing VGI with theoretical characteristics of geographic data (Goodchild and Li Citation2012), such as geometric distribution of places in space, fractal dimension of coastlines, as well as providing metadata within VGI can be a way to improve its quality.
3.1. Strategies for ex ante VGI quality improvement
This type of approach has the objective of preventing the creation of low-quality VGI before it is created/collected. Sometimes it presents a potential added value, constituted by providing the volunteers of easy to access resources for a correct information creation, besides automatic mechanisms for controlling the data entry.
Many ex ante approaches use external knowledge such as metadata standards for interoperability, controlled vocabularies, geographic gazetteers and ontologies in the specific scientific domain, and even templates with automatic error-checking capabilities to make it easier for the adoption of better data creation practices; also online training courses, checklist configuration tools can be of aid (Crall et al. Citation2011).
Another ex ante strategy is to encourage the use of sensors to acquire data automatically in order to guarantee a standard quality. This is the case of GPS coordinate acquisition, which ensures higher granularity with respect to manual creation. Huang, Kanhere, and Hu (Citation2010) propose this approach to assess the quality of data acquired by participatory sensing applications; an experiment is carried out to measure the ambient noise level using mobile phones instrumented with a sound level meter program.
Also inquiring the volunteers about their own confidence (skill, motivations, and commitment) in performing the task is useful for the preliminary assessment of the reliability of VGI. Certifying volunteers with particular skills can provide accomplishment for volunteers, but also demonstrates their long-term commitment to a program, improving volunteer retention and assuring long-term quality. In fact, a critical aspect of the quality of VGI in Citizen Science is the low participation of volunteers with the consequent generation of incomplete and sparse information.
Categorizing the contributors with respect to their skills, motivations, and commitment can also be used to define the reputation of the information. It is interesting to consider the study of Crall et al. (Citation2011), in which the quality of VGI is characterized in comparison with projects carried out by professionals. The quality is here expressed in terms of thematic and spatial accuracy of information. Specifically, providers were required first to identify invasive plant species, then to map their distributions, and finally to estimate their abundance. It was found that volunteers perform almost as well as professionals in some areas. Authors also analyzed predictors of volunteer success by considering their age, education, experience, science, and attitudes in training-related skills, but these proved to be poor predictors of performance and could not be used as effective eligibility criteria.
Another approach is based on automatically assessing the volunteers’ reputation as depending on the comparison of their data to the rest of the submitted data. In some projects, the reputation of participants decreases if their data differ too much from the larger body of submissions to the system. This sometimes allows identifying malicious volunteers creating spamming. For example, the quality improvement in OpenAddress is a dynamic ex ante process: when a new address is entered or an existing one is changed, they are immediately checked against external references in Google Maps, Bing Maps, and Yahoo!. Since also these Open Web Map Services (OWMS) are considered as affected by inaccuracies, the constraint to validate an OpenAddress position is that its distance for the corresponding address in all OWMS should be smaller or equal to the quintile 95% threshold value. Ostermann and Spinsanti (Citation2011) also adopt a similar approach to assess the source reputation based on users’ classification. Nevertheless, this approach can sometimes backfire. In some VGI projects, in fact, the contribution of a single person – maybe an expert or a direct observer of a phenomenon under investigation – may be more significant than the whole contribution given by the crowd. This is especially true when dealing with, for example, interpreting specialized attributes or classifying certain unusual features.
Another interesting perspective, that is the use of games, is offered by a study carried out by the Citizen Sort initiative (http://www.citizensort.org/) that has the objective of helping information scientists to improve the skill of volunteers engaged with scientific classification tasks, by exploring how motivation, scientific interest, and gaming all interact. In the biological science the general public routinely collects and uploads photographs of different living things: a photograph of a plant or an animal, tagged with the date and location where it was observed, is valuable information if it also reports the scientific name of the species. However, many potential volunteers do not have the necessary knowledge to support this classification task. So the project developed several games and tools to let ordinary people classify various photos of living things.
Meaningful quantities of scientific data can be provided by attracting and retaining enough participants. Games have great potential as a motivator for participation, and as a tool for producing high-quality scientific data. So Citizen Sort lets people explore how different kinds of games and tools might make Citizen Science more enjoyable and analyze how different kinds of players, games, and tools might produce different quality levels of data in the biological sciences.
A further issue is faced in Wiggins et al. (Citation2011), who argued that to ensure VGI quality it may be necessary to take into account the scale of participation and expectations on the skills of the contributors. Many studies reported that only few contributors enter many VGI items, while the majority of contributors enter only one or a few items (Goodchild and Li Citation2012). Statistics makes it possible to track the contributions of each individual volunteer and then to assess his/her level of commitment and reliability that may provide an automatic way to set the trust of his/her entered items. Wikimapia project adopts this approach to identify advanced users with the role of moderators: volunteers with high commitments in specific geographic areas may be assumed as moderators for the VGI entered in the same region.
Ex ante strategies can be grouped in classes and related to the classification proposed in , in order to predict how they can help, moving from low/medium to medium/high expected quality of VGI.
shows strategies that are adopted in the different VGI projects’ typologies, listed in the top row. In the right column the expected effect on the quality of the application of one or more strategies are displayed (see the legend of for the meaning of rectangles’ fills). Bullets indicate the strategies that are applied to each class. Classes in the group ‘Need for VGI’ of have not been included since the only possible strategy, i.e., to lower the rate of VGI contributions, is a non-sense in this framework. Also classes that already offer a high expected quality are not considered in .
It can be observed that the usage of local moderators and rewarding/motivation of volunteers are strategies that can be applied to all classes; the latter can be exploited just once volunteers are made aware of their role. There is no class for which no strategy can be adopted; therefore, the expected VGI quality can always be improved.
3.2. Strategies for ex post VGI quality improvement
These approaches have the objective of cleansing and improving VGI quality once information is already created or collected.
Among ex post approaches, which do not require external knowledge, the application of automatic learning techniques and data mining are deemed useful to perform data validation by identifying outliers and removing them. These approaches work on group consistency and use the deviations from common consensus or from a geo-statistical range to identify outliers (Huang, Kanhere, and Hu Citation2010). Also the identification and fusion of redundant VGI, i.e., co-referent VGI or aliases, can be useful both to remove uncertainty and to confirm and improve the quality of VGI items (De Tré et al. Citation2010). This is the approach used by Citizen Science projects whose objective is managing emergencies. Finding many VGI items with consistent semantics, i.e., reporting annotations to the same event in the same positions or close proximity, increases the significance of these VGI items (Latonero and Shklovski Citation2010). This is the case of Tomnod (http://tomnod.com), a crowdmapping application aimed to impact early calculation and damage assessment immediately after a disaster. Tomnod’s volunteers are committed to pinpoint damaged buildings and interrupted roads on satellite maps, through a Web viewer. Their indications on the map are automatically processed by a statistical algorithm, which confers more trust to the most frequently pinpointed areas and calculates the probable coordinates of the damaged objects. As the algorithm associates a trust score to each volunteered contribution, a total trust score is applied to every contributor too, conferring credibility and skill on him/her. The trust on the both the data and the data providers plays a part in improving quality and in enhancing the map reliability.
A semi-automatic workflow has been designed at the European Commission Joint Research Centre to assess the fitness for purpose of VGI extracted from geo-social media (Craglia, Ostermann, and Spinsanti Citation2012). The process provides for the enrichment of the retrieved content with additional official geographic context information and uses spatio-temporal clustering to support the validation.
Among the ex post approaches using external data to confirm VGI, the most common ones are those cross-referencing VGI with other authoritative information from administrative and commercial datasets such as land cover, land use, etc. Al-Bakri and Fairbairn (Citation2010) conducted a study to assess the quality of the spatial accuracy of the OpenStreetMap French subset of information by comparing it with high-quality reference field survey datasets. Both positional and shape fidelity were evaluated. Nevertheless, the approaches based on comparison with reference data are nowadays difficult to trust, due to the fact that VGI may be even more accurate than the best available authoritative data (Goodchild and Li Citation2012).
Another way to improve VGI quality is the enrichment with information from trusted sources: an example is transforming implicit geographic information contained in annotation and figure captions, into explicit coordinates (Ostermann and Spinsanti Citation2011).
Foody (Citation2013) explored another approach: latent class analysis has been used to characterize the accuracy of data in crowdsourced projects and to rank their contributors. The derived characterization can help the end-user to identify and isolate poor contributors in order to enhance data quality.
Finally, given a critical mass of participants, VGI quality assessment can take on a wiki approach, where producers collaboratively identify and remove inaccurate information. This crowdsourced approach is founded on the idea that information is most likely to be corrected if a large number of producers have an opportunity to edit and review the available information. Nevertheless, in the case of VGI, this approach is not working very well as reported in the studies on OpenStreetMap data where it was found that users repeatedly fight to tag the features differently (Mooney and Corcoran Citation2012). A reason of the failure of this approach is the fact that the number of ‘eyes’ with sufficient local geographic – or cartographic – knowledge is very small to make the corrections feasible (Goodchild and Li Citation2012). Also, some reviewers may have political, historical, or cultural motivations for naming a particular town, region, or country differently than the term used by the authorities currently in power.
Also ex post strategies can be grouped and related to the classification proposed in , in order to predict how they can help moving from low/medium to expected high quality of VGI. shows which strategies are mainly adopted for the different classes listed in the columns (see the legend of for the meaning of the rectangles’ fills). Classes of that already offer the expected high quality are not considered in .
All strategies but ‘Ranking’ can be applied to all classes. Most strategies can be applied also to classes in the ‘Need for VGI’ group (), which has not been included in .
4. Improving VGI quality facing users’ needs
The previous section reported methods that can be adopted, also in combination, to raise the expected VGI quality in scientific applications. They do not depend on the quality expected by end users. Nevertheless, this is an important aspect of information quality, related to its pragmatic use, and thus to the intended purpose of the information itself.
Several tools can be defined and implemented in order to manipulate quality information stored in a structured way, in the form of indicators of the VGI quality, both manually created and automatically extracted from VGI analysis itself (Devillers et al. Citation2007). Such quality indicators, besides considering the quality dimensions of geographic information, as defined in the ISO 19113:2002 and ISO 19114:2003 standards, should comprise some specific indicators of the VGI quality also to represent the amount of conflicting, redundant, and completeness of information; the sources’ trust; the even distribution of the users’ contributions over the entire collection; and the lineage of reviewing processes (Oomen and Aroyo Citation2011).
In our recent work (Bordogna et al. Citation2014) we proposed an approach to allow meeting VGI quality with users’ expectations. It is based on linguistic multi-criteria decision-making and consists in assigning quality indicators to the VGI components and to store them in a database and selecting/rejecting them using quality thresholds. The approach is based on the evaluation of flexible queries expressed by the user in the database of quality indicators and consists of three subsequent phases: the first is the computation of distinct quality indicators, which may have distinct granularity and may take into account the several components of VGI items, such as the indicators of the precision, accuracy, and completeness of the geographic footprint, the indicator of correctness and completeness of the textual content, and the indicator of the reliability of the creator. Quality indicators are considered as metadata associated to each VGI item and are stored in the database. Quality indicators that can be computed for various kinds of information items have been proposed in Bordogna et al. (Citation2014).
The second phase consists in evaluating user-specified preferences on the previous quality indicators of VGI items. Preferences are specified in terms of minimum acceptable values of each quality indicator or by linguistic acceptance values such as low, medium, high, defined by fuzzy sets. A minimum acceptance value is the minimum value of an indicator that the user is keen to accept in order to consider the VGI items as bearing sufficient quality. If the minimum acceptance value is high for an indicator, this means that the user deems the indicator very influential in determining the overall quality of the VGI item. In fact, since she/he needs only items with high values of the quality indicator. Conversely, a low minimum acceptance value means that the indicator is not very influential in selecting the VGI items, since one can accept items having even low values of that quality indicator.
The last phase filters the VGI items that satisfy a minimum number of all the specified preferences. This is done by the user who specifies the minimum number of preferences that must be simultaneously satisfied by a VGI item in order to be deemed with sufficient overall quality. Notice that this decision-making approach can be applied either ex ante, while a volunteer is compiling a VGI item, or ex post.
5. Conclusions
This paper offers a review on the quality of VGI projects for scientific endeavors. It contributes to develop a common categorization and vocabulary for the nature of volunteered information and offers a proposal of a classification for collaborative projects using VGI contributions.
In particular, specific attention has been devoted to the characteristics that may affect the VGI quality, trying to find a connection between the proposed categorization and expected VGI quality (). The paper also provides a classification and a critical description of the strategies currently adopted to improve VGI quality. In fact, applications of different approaches for quality control and assessment, both ex ante and ex post, can be found in Citizen Science projects to improve information quality and we have shown that all types of VGI can adopt one or more methods to improve its expected quality ( and ). It is worth noticing that a promising and pragmatic perspective in VGI quality is related to assessing the quality in relation to users’ expectations, i.e., by trying to match the quality of provided information with the quality level preferred by each user for her/his particular purpose: the review also summarizes a method we proposed to face this challenge. In this approach, quality assessment is modeled as a decision-making process, driven by user specifications, and thus it can be flexibly applied to customize distinct needs of scientific projects, providing different solutions for quality improvement.
Acknowledgement
The authors thank the editors and the anonymous reviewers for their constructive feedback.
Funding
This work has been partially funded by the Italian Flagship Project RITMARE.
References
- Al-Bakri, Maythm, and David Fairbairn. 2010. “Assessing the Accuracy of ‘Crowdsourced’ Data and Its Integration with Official Spatial Data Sets.” In The Ninth International Symposium on Spatial Accuracy Assessment in Natural Resources and Environmental Sciences, 317–320. Leicester: University of Leicester.
- Anthony, Denise, Sean W. Smith, and Tim Williamson. 2005. Explaining Quality in Internet Collective Goods: Zealots and Good Samaritans in the Case of Wikipedia. Hanover: Dartmouth College.
- Batini, Carlo, Matteo Palmonari, and Gianluigi Viscusi. 2012. “The Many Faces of Information and Their Impact on Information Quality.” In Proceedings of the International Conference on Information Quality, 1 vol. edited by L. Berti-Equille, 339p. 16–17 November, Paris: MIT Information Quality (MITIQ) Program.
- Boisot, Max H. 1998. Knowledge Assets: Securing Competitive Advantage in the Information Economy: Securing Competitive Advantage in the Information Economy. New York: Oxford University Press.
- Bonney, Rick, Heidi Ballard, Rebecca Jordan, Ellen McCallie, Tina Phillips, Jennifer Shirk, and Candie Wilderman. 2009. Public Participation in Scientific Research: Defining the Field and Assessing Its Potential for Informal Science Education. Washington, DC: CAISE Inquiry Group Report, Center for Advancement of Informal Science Education.
- Bordogna, Gloria, Paola Carrara, Laura Criscuolo, Monica Pepe, and Anna Rampini. 2014. “A Linguistic Decision Making Approach to Assess the Quality of Volunteer Geographic Information for Citizen Science.” Information Sciences 258: 312–327. doi:10.1016/j.ins.2013.07.013.
- Bruns, Axel. 2006. “Toward Produsage: Futures for User-led Content Production.” In Cultural Attitudes towards Communication and Technology, edited by Charles Ess, Fay Sudweeks, and Herbert Hrachovec, 275– 284. Tartu: Murdoch University.
- Cohen, L. 2008. “The Rumor Mill That Won’t Stop Running.” International Herald Tribute [ Online].
- Coleman, David J., Yola Georgiadou, Jeff Labonte, Earth Observation, and Natural Resources Canada. 2009. “Volunteered Geographic Information: The Nature and Motivation of Producers.” International Journal of Spatial Data Infrastructures Research 4: 332–358. doi:10.2902/1725-0463.2009.04.art16.
- Connors, John Patrick, Shufei Lei, and Maggi Kelly. 2012. “Citizen Science in the Age of Neogeography: Utilizing Volunteered Geographic Information for Environmental Monitoring.” Annals of the Association of American Geographers 102: 1267–1289. doi:10.1080/00045608.2011.627058.
- Craglia, M., F. Ostermann, and L. Spinsanti. 2012. “Digital Earth from Vision to Practice: Making Sense of Citizen-Generated Content.” International Journal of Digital Earth 5: 398–416. doi:10.1080/17538947.2012.712273.
- Crall, Alycia W., Gregory J. Newman, Thomas J. Stohlgren, Kirstin A. Holfelder, Jim Graham, and Donald M. Waller. 2011. “Assessing Citizen Science Data Quality: An Invasive Species Case Study.” Conservation Letters 4: 433–442. doi:10.1111/j.1755-263X.2011.00196.x.
- Criscuolo, Laura, Monica Pepe, Roberto Seppi, Gloria Bordogna, Paola Carrara, and Francesco Zucca. 2013. “Alpine Glaciology: An Historical Collaboration between Volunteers and Scientists and the Challenge Presented by an Integrated Approach.” ISPRS International Journal of Geo-Information 2: 680–703. doi:10.3390/ijgi2030680.
- Crowston, Kevin, and Andrea Wiggins. 2011. “Design for Citizen Science.” In Proceedings of the Final Workshop Report NSF Grants , 31p. Syracuse, NY: Syracuse University School of Information Studies.
- De Tré, Guy, Antoon Bronselaer, Tom Matthé, Nico Van de Weghe, and Philippe De Maeyer. 2010. “Consistently Handling Geographical User Data Context-Dependent Detection of Co-located POIs.” Communications in Computer and Information Science, Springer 81 (1): 85–94.
- Devillers, R., Y. Bédard, R. Jeansoulin, and B. Moulin. 2007. “Towards Spatial Data Quality Information Analysis Tools for Experts Assessing the Fitness for Use of Spatial Data.” International Journal of Geographical Information Science 21 (3): 261–282. doi:10.1080/13658810600911879.
- Devillers, Rodolphe, Robert Jeansoulin, eds. 2006. Fundamentals of Spatial Data Quality. London: ISTE. http://onlinelibrary.wiley.com/doi/10.1002/9780470612156.fmatter/pdf.
- Eppler, Martin J., and Dörte Wittig. 2000. “Conceptualizing Information Quality: A Review of Information Quality Frameworks from the Last Ten Years.” In Proceedings of the 2000 Conference on Information Quality, edited by B. D. Klein and D. F. Rossin, 83–96. Cambridge, MA: MIT press.
- Foody, Giles M. 2013. “Rating Crowdsourced Annotations: Evaluating Contributions of Variable Quality and Completeness.” International Journal of Digital Earth 7 (8): 650–670. doi:10.1080/17538947.2013.839008.
- Ginsberg, Jeremy, Matthew H. Mohebbi, Rajan S. Patel, Lynnette Brammer, Mark S. Smolinski, and Larry Brilliant. 2009. “Detecting Influenza Epidemics Using Search Engine Query Data.” Nature 457: 1012–1014. doi:10.1038/nature07634.
- Goodchild, Michael. 2009. “NeoGeography and the Nature of Geographic Expertise.” Journal of Location Based Services 3 (2): 82–96. doi:10.1080/17489720902950374.
- Goodchild, Michael F. 2007. “Citizens as Voluntary Sensors: Spatial Data Infrastructure in the World of Web 2.0.” International Journal of Spatial Data Infrastructures Research 2: 24–32.
- Goodchild, Michael F., and Linna Li. 2012. “Assuring the Quality of Volunteered Geographic Information.” Spatial Statistics 1: 110–120. doi:10.1016/j.spasta.2012.03.002.
- Haklay, Muki. 2012. “Citizen Science and Volunteered Geographic Information – Overview and Typology of Participation.” In Volunteered Geographic Information, Public Participation, and Crowdsourced Production of Geographic Knowledge, edited by Daniel Z. Sui, Sarah Elwood, and Michael F. Goodchild, 105–122. Berlin: Springer.
- Hand, Eric. 2010. “Citizen Science: People Power.” Nature 466: 685–687. doi:10.1038/news.2010.106.
- Herrera-Viedma, Enrique, G. Pasi, Antonio G. Lopez-Herrera, and Carlos Porcel. 2006. “Evaluating the Information Quality of Web sites: A Methodology Based on Fuzzy Computing with Words.” Journal of the American Society for Information Science and Technology 57: 538–549. doi:10.1002/asi.20308.
- Hsieh, Nancy, and Eric Graham. 2011. Floracaching: Website Functionality. UCLA, Los Angeles, CA: Center for Embedded Networked Sensing. http://research.cens.ucla.edu/education/highschoolscholars/2011/docs/Floracaching.pdf.
- Huang, Kuan Lun, Salil S. Kanhere, and Wen Hu. 2010. “Are You Contributing Trustworthy Data? The Case for a Reputation System in Participatory Sensing.” In MSWIM ’10 Proceedings of the 13th ACM International Conference on Modeling, Analysis, and Simulation of Wireless and Mobile Systems, 14–22. New York: ACM.
- Kelling, Steve, Wesley M. Hochachka, Daniel Fink, Mirek Riedewald, Rich Caruana, Grant Ballard, and Giles Hooker. 2009. “Data-Intensive Science: A New Paradigm for Biodiversity Studies.” BioScience 59: 613–620. doi:10.1525/bio.2009.59.7.12.
- Latonero, Mark, and Irina Shklovski. 2010. “‘ Respectfully Yours in Safety and Service’: Emergency Management & Social Media Evangelism.” In Proceedings of the 7th International ISCRAM Conference, edited by S. French, B. Tomaszewsk, and C. Zobel, 1–10. Seattle, WA: ISCRAM.
- Mooney, Peter, and Padraig Corcoran. 2012. “Characteristics of Heavily Edited Objects in OpenStreetMap.” Future Internet 4 (4): 285–305. doi:10.3390/fi4010285.
- Oomen, Johan, and Lora Aroyo. 2011. “Crowdsourcing in the Cultural Heritage Domain : Opportunities and Challenges.” In Proceedings of the 5th International Conference on Communities and Technologies, edited by, M. Foth, J. Kjeldskov, and J. Paay, 138–149. ACM.
- Ostermann, F. O., and Laura Spinsanti. 2011. “A Conceptual Workflow for Automatically Assessing the Quality of Volunteered Geographic Information for Crisis Management.” In Proceedings of the 14th AGILE International Conference on Geographic Information Science, edited by S. Geertman, W. Reinhardt, and F. Toppen, 6. Heidelberg: Springer Verlag. http://itcnt05.itc.nl/agile_old/Conference/2011-utrecht/contents/pdf/shortpapers/sp_122.pdf.
- Priedhorsky, Reid, Jilin Chen, Shyong (Tony) K. Lam, Katherine Panciera, Loren Terveen, and John Riedl. 2007. “Creating, Destroying, and Restoring Value in Wikipedia.” In Proceedings of the 2007 International ACM Conference on Conference on Supporting Group Work – GROUP ’07, edited by T. Gross and K. Inkpen, 259. New York: ACM Press.
- Stark, Hans-Jörg. 2010. Quality Assurance of Crowdsourced Geocoded Address-Data within OpenAddresses: Concepts and Implementation. Salzburg University.
- Wiggins, Andrea, Greg Newman, Robert D. Stevenson, and Kevin Crowston. 2011. “Mechanisms for Data Quality and Validation in Citizen Science.” In 2011 IEEE Seventh International Conference on E-Science Workshops, 14–19. Stockholm: IEEE. doi:10.1109/eScienceW.2011.27.