
ABSTRACT
Novel sensor technologies are rapidly emerging. They enable a monitoring and modelling of our environment in a level of detail that was not possible a few years ago. However, while the raw data produced by these sensors are useful to get a first overview, it usually needs to be post-processed and integrated with other data or models in different applications. In this paper, we present an approach for integrating several geoprocessing components in the TaMIS water dam monitoring system developed with the Wupperverband, a regional waterbody authority in Germany. The approach relies upon the OGC Web Processing Service and is tightly coupled with Sensor Observation Service instances running at the Wupperverband. Besides implementing the standardized XML-based interface, lightweight REST APIs have been developed to ease the integration with thin Web clients and other Web-based components. Using this standards-based approach, new processing facilities can be easily integrated and coupled with different observation data sources.
1. Introduction
River dams are critical infrastructure. As part of a risk landscape that is constantly changing due to climatic changes and human impacts, dam systems require continuous monitoring with various observations. Although safety monitoring systems are available at these structures, there remains a residual risk of failure. Potential damages associated with dams usually stem from the failure of the structure due to overtopping, seepage water flow, and deformation. A critical dam failure may claim lives and cause massive material damage. To further minimize the residual risk, measures from different sources must be combined and analysed to extract maximum information.
The research project TaMISFootnote1 utilizes new sensor and processing technologies to improve monitoring of water dams. Within the project a novel Web-based monitoring system is developed. To semi-automatically extract information of the measures and optimize safety monitoring at a dam building, standardized observation hosting Web services are coupled with standardized spatio-temporal processing Web services instances within the TaMIS system. Sensors are ranging from differential GPS, monitoring the dam structure deformation, weather and gauge sensors to watch hydrological behaviour and seepage sensors to control washing away dam material.
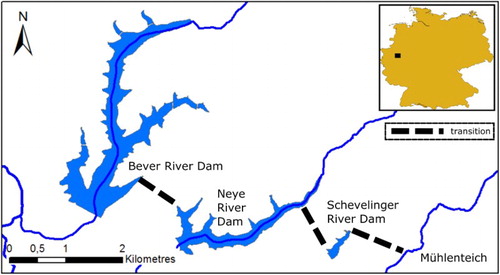
The study area of the TaMIS project is the Bever-Block reservoir system shown in . It is located in the catchment area of the river Wupper, a tributary of the river Rhine in Western Germany. The Wupperverband (Wupper Association) is responsible for water volume management and water quality within the 813 km2 catchment of the river Wupper. Natural and man-made water bodies in the Wupper catchment area form a complex water network. One of the more closely linked network clusters is the reservoir system Bever-Block which allows for controlled flood discharge among four water bodies through a transition system.
Figure 1. Map of the reservoir system Bever-Block, managed by the Wupperverband. The four water bodies are interlinked through a transition system.
Simple, timely, and location-independent access to both, sensor measurements and geodata, constitutes an important tool for the monitoring of associated complex systems and evaluating natural hazards. For this purpose, the Wupperverband has set up a Web-based system (http://fluggs.wupperverband.de), that enables visualization of timely and location-independent data from sensors located throughout the watershed based on Sensor Web standards (Spies and Förster Citation2005). The TaMIS project has the goal to simplify the complex regime of measurements at the Bever-Block by developing an integrated dam monitoring and information system. The system therefore integrates external data including hydrological, geological, and meteorological data with measurement data gathered at the Bever-Block and provides a Web-based graphical user interface, the TaMIS control centre, to visualize and analyse the data.
A bunch of analysis tools including statistical methods as well as a complex run-off model are developed for a better understanding of processes at the dam building including seepage behaviour. One of the core challenges of this system is to integrate the different analysis facilities and to allow to easily add new sensor data sources. This is also one of the core challenges for realizing the Digital Earth, a multi-resolution, three-dimensional representation of the planet (Gore Citation1998), since the growing amount of geographic information requires sophisticated processing and analysis models for turning information into insight and intelligent action (Craglia et al. Citation2008). The approach described in this paper addresses the issue of integrating analysis tools with observation infrastructures like the Global Earth Observation System of Systems (GEOSS), the core observation infrastructure for realizing the Digital Earth, using open standards defined by the Open Geospatial Consortium (OGC).
The approach may serve as best practice for similar scenarios when a flexible Web-based geoprocessing of observations is needed. The standardized Web-based Sensor Observation Service (SOS), defined by the OGC, is already well-established and routinely used by the Wupperverband to retrieve environmental observations. However, an immediate Web-based processing of timeseries and observations by means of Web Processing Services (WPS) is still lacking a common and flexible approach. The core contributions described in this paper are thus the following:
A systematic approach to couple Sensor Observation and WPS,
WPS for regression, interpolation and a run-off simulation model that can be applied to data from SOS instances and can publish their results to SOS instances,
Lightweight REST APIs that simplify the client development and facilitate an easier integration with other Web-based components.
The remainder of the paper is structured as follows: At first, background about the OGC Sensor Web Enablement initiative and the WPS are provided (Section 2). The TaMIS architecture is described in Section 3. In Section 4, the different approaches for coupling SOS and WPS are introduced. We then describe the different WPS process profiles for the analysis facilities (Section 5), followed by a description of the REST APIs (Section 6). Section 7 describes the TaMIS Control Centre. Section 8 discusses the approach, followed by conclusions and next steps in Section 9.
2. Sensor web & online geoprocessing
To standardize Web-based discovery, access and tasking of different kinds of environmental sensors and to ease their integration in spatial data infrastructures, the OGC has introduced the Sensor Web Enablement initiative (Botts et al. Citation2007; Bröring et al. Citation2011). The SOS is the most widely used Sensor Web standard and defines a Web Service interface for managing observation data and sensor metadata (Tamayo et al. Citation2011; Bröring, Stasch, and Echterhoff Citation2012). It provides information about the observations offered in its service capabilities, for example, spatio-temporal extent, and offers additional operations for sensor metadata (DescribeSensor) and observation retrieval (GetObservation). New sensors and observations can be inserted using a transactional interface. For modelling and encoding the data, the SOS relies upon the Observation & Measurements (O&M) standard that defines common models and encodings for observation data (Cox Citation2007, Citation2011) and the Sensor Model Language (SensorML) standard for sensor metadata (Botts and Robin Citation2014).
While most of the OGC standards focus on data models and interfaces for exchanging spatial information, the OGC WPS (Müller and Pross Citation2015) is somewhat different, as it specifies a common interface for online geoprocessing facilitating an integration of processing facilities in spatial data infrastructures. In this context, we follow the definition of Hofer (Citation2015), where online geoprocessing refers to the manipulation of geospatial input data to generate novel output data in the Web. It may involve simple operations like buffering or intersections, but also complex environmental models. The core operations of WPS consist of operations to obtain service metadata (GetCapabilities), to retrieve process metadata (DescribeProcess) and to run processes (Execute).
In our previous work, we have already presented WPSs consuming observations offered by SOSs, for example, for spatio-temporal aggregation of air quality observations (Stasch et al. Citation2012) or for interpolation of precipitation observations (Schaeffler et al. Citation2010). The Intamap project developed a generic interpolation service based on the WPS standard (Pebesma et al. Citation2011). However, all these approaches are coupling SOSs and WPSs differently and a common systematic approach for coupling both service types is still missing.
3. TaMIS geoprocessing architecture
An overview on the general geoprocessing architecture developed in the TaMIS project is given in . The TaMIS Control Center is an integrated Web portal providing different views for monitoring the dam system including a 3D scene, a 2D-map view, and a time series viewer for different (sensor) data sources. It also allows executing the different processing modules. The core interface for integrating the different analysis modules is an OGC WPS. By means of the WPS, the different processing modules can be integrated using the same interface and may also be reused by external applications. The two statistical models that have been implemented in our approach are a multiple linear regression and a spatial interpolation. In addition, the TALSIM-NG model (Ostrowski, Lohr, and Leichtfuß Citation2000), a complex run-off model, has been integrated. The coupling of SOS and WPS is described in more detail in Section 4 and the process profiles for the different analysis modules encapsulated by the WPS are described in Section 5.
Figure 2. Overview of the TaMIS Geoprocessing Architecture.
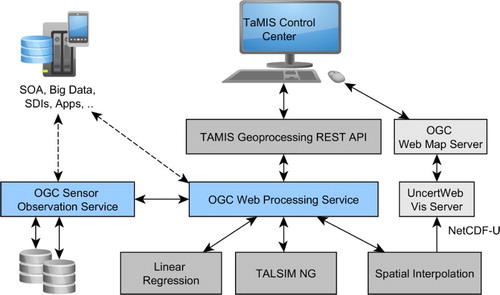
Since the TaMIS Control Center is implemented as a thin Web client, the TaMIS Geoprocessing REST API has been implemented on top of the OGC Web Processing Service. It runs as a proxy and simplifies the implementation of the thin client and the amount of data that needs to be exchanged between the client and the processing server. The API is described in more detail in Section 6, followed by a description of the client in Section 7. The interpolation yields spatial fields that are provided as spatial coverages and cannot easily be visualized by thin Web clients. For this purpose, the Vis Server, a component that has been developed previously in the UncertWeb project (Bastin et al. Citation2013), has been reused. It allows to retrieve coverage data encoded in GeoTIFF or NetCDF, to define the rendering styles using Styled-Layered Descriptors (Lupp Citation2007), and to publish the rendered coverages as standardized Web Map Server (WMS) (de la Beaujardiere Citation2006).
4. Coupling SOS and WPS
Since one of the primary purposes of the SOS is to integrate sensor measurements in spatial data infrastructures and the purpose of the WPS is to integrate processing facilities in such infrastructures, it is a natural subsequent step to couple both components to generate higher level information. As briefly sketched in Section 2, a common approach to couple SOS and WPS is still missing, though there has been previous work. In general, three architectures exist that may be implemented, as illustrated in . These are explained in the following subsections. The architectures can also be used with transactional SOS (SOS-T) for inserting process outputs in SOS to persist the outputs. This option has also been realized in the TaMIS project for the linear regression and interpolation processes.
Figure 3. Options for Coupling OGC SOS and WPS. (a) Loose-coupling, (b) tight-coupling, and (c) one-component.
4.1. Loose-coupling
As illustrated in (a), SOS and WPS may be loosely coupled. In this architecture, WPS and SOS are implemented as independent components and the integration of SOS and WPS is managed and implemented on client side. Hence, the client needs to implement all operations to communicate with SOS and WPS. The client requests the observations from a SOS using the GetObservation operation before passing them to the WPS server using the Execute operation.
An advantage of this approach is the independence of the SOS and the WPS. This benefit is at the expense of an increased communication load, as the observations need first to be transferred to the client from the SOS and are then passed to the WPS. The solution also puts more complexity on client implementations as it needs to independently communicate with both services.
4.2. Tight-coupling
The approach of a tight-coupling of SOS and WPS is shown in (b). In this case, the WPS and the SOS are still separated components, but the WPS is able to directly interact with the SOS and thus to retrieve the observations from the SOS without further involvement of the client.
An advantage of this approach is the decreased communication need, since the observations only need to be transferred to the WPS and not to the client. The complexity of the client is reduced, since it only needs to be able to create observation request, but does no longer need to handle SOS responses, which is now done by the WPS. If there are large amounts of observations that need to be processed, a potential disadvantage may still be the communication between SOS and WPS, since the observations still need to be transferred to the WPS (i.e. for a distributed system connected through the Web).
4.3. One-component
The third option to couple SOS and WPS is the implementation of a single component that implements both, the SOS and the WPS interface (see (c)). In this case, the component offers all operations of SOS and WPS and there is no need to transfer the observations between SOS and WPS, as this implementation can utilize the same internal data source.
This approach has the advantage to further reduce the communication overhead, since there is no communication need between SOS and WPS. However, the approach is also less flexible: the processes offered cannot be applied to observations offered in other observation services. Hence, a dynamic coupling of SOS and WPS is not possible in contrast to the previous approaches.
In the TaMIS project, the second option (Section 4.2) is implemented maintaining a high degree of flexibility and easing reuse of the processes offered in the WPS while simultaneously reducing the communication overhead and client complexity.
5. TaMIS WPS process profiles
The process definition in the WPS standard is intentionally kept generic meaning that functionality as well as inputs and outputs of processes are not restricted and can be of any type. In order to enable a higher degree of interoperability, these inputs and outputs are further specified for specific geoprocessing functionality in so-called process profiles (Müller Citation2015). The analysis modules that have been integrated in TaMIS via WPS interfaces are two statistical models implemented in R (R Core Team Citation2016), a multiple linear regression and a spatial interpolation, and a complex run-off model provided as executable binaries by a commercial vendor. The following subsections describe the WPS process profiles developed for these modules.
5.1. Linear regression profiles
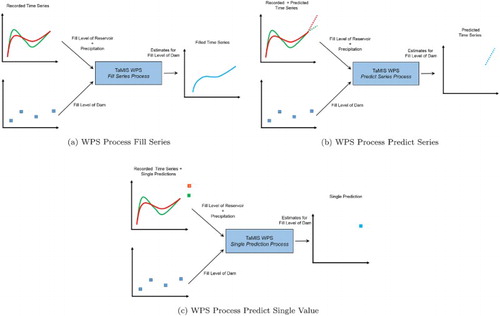
As illustrated in , the multiple linear regression serves three purposes in the TaMIS system: (i) Filling a coarse target time series through a regression of finer input time series ((a)), (ii) providing predictions in the future based on previously (potentially by external services) predicted input time series ((b)), and (iii) providing predictions in the future based on single pairs of input data ((c)). Hence, we defined three different process profiles as shown in . All three processes are used to assess the dam's water level response to rainfall and to the fill level of the water reservoir, since the dam's water level is currently only measured bi-weekly by manual measurements.
Figure 4. Illustration of the TaMIS process profiles implemented using multiple linear regression. (a) WPS Process fill-series, (b) WPS Process predict series, and (c) WPS Process predict single value.
If sufficient data is provided, the multiple linear regression model is fitted on the fly, while the process also provides a set of pre-computed general models for calls providing too scarce data. Along with the predicted values, diagnostic plots and a simplified indicator based on the adjusted are provided by the WPS to assess the quality of fit of the model or how well the data matches the general pre-computed model.
The process receives queries that point to data of the explanatory variables in the underlying SOS as well as to data of the target variable. The queries are either actual SOS requests or based on the Series REST API (https://github.com/52North/series-rest-api) provided with the 52° North SOS. If only a single prediction for a single pair of explanatory variables is desired, these can be passed as additional input, while the primary input is still used to fit a multiple linear regression model. The data retrieval and insertion of predictions is done via the R package sos4R (Nüst, Stasch, and Pebesma Citation2011). For each process profile, an R script has been implemented that is deployed using WPS4R (Hinz et al. Citation2013). It is hence easy to adopt the models to other use cases and richer models.
5.2. Spatial interpolation profile
The spatial interpolation process is used in the TaMIS project to interpolate the water level in the dam in order to assess potential seepage along the dam. The process is set up to accept spatio-temporal data and treat the temporal slices as independent copies of the spatial field. If enough data are provided, a variogram model of a predefined class is fitted and used in a time slice wise ordinary kriging of the data (Pebesma Citation2004). If the data are limited and no model can be estimated, the simpler inverse distance weighted (IDW) interpolation is carried out. The data are handled by the R packages sp (Pebesma and Bivand Citation2005) and spacetime (Pebesma Citation2012) while the interpolation relies on the R package gstat (Pebesma Citation2004). In our application, the variogram model class (e.g. spherical, linear or exponential) is predefined. An automated selection of variogram models is, for example, implemented in the R package automap (Hiemstra et al. Citation2008) and could as well be included in the interpolation workflow. Generally, an automated approach has a higher demand for data given the complexity of the model as no expert knowledge provided by the user can support the model estimation.
The process receives a query that points to the data used as input for the interpolation (either a SOS-request or via the REST binding). The target grid is the second input of this WPS and allows for a masking, as only those grid cells are interpolated that have initially non-missing values. The interpolated grid is returned as a series of interpolated snapshots for the different moments in time of the input data (using a NetCDF and GeoTIFF encoding). Additionally, the WPS provides diagnostic plots such as the plot of the empirical and theoretical variogram used during the interpolation. To display the results as an interactive map layer in thin Web clients, the UncertWeb Vis server is utilized that renders the interpolated images and provides a WMS layer for each timestamp visualizing the interpolated water level.
5.3. Precipitation run-off model profile
To be able to predict the water level in the dam, predictions of the reservoir's fill level are needed that can be fed into the regression model introduced above. The TalsimNG model, a river basin model that integrates reservoir maintenance serves this purpose (Ostrowski, Lohr, and Leichtfuß Citation2000). The model is set up for the Bever reservoir and uses time series data containing discharge, volume and inflow of the Bever-block to estimate the fill level of the water reservoir.
To execute the TalsimNG model from the TaMIS Control Center and to couple its outputs with the regression model, a WPS process has been specified and implemented. TalsimNG's input and output timeseries are encoded in a format introduced by the Delft-Flood Early Warning System (Deltares Citation2016). To foster interoperability with other systems, the Observations and Measurements (O&M) encoding (Cox 2011) is used as input format of the WPS process. The output of TalsimNG is also in the timeseries format and will be transformed to O&M for the WPS process output. The transformation of the inputs and outputs is handled by so-called parsers/generators, that are part of the 52° North WPS framework. The input time series are written to local files on the server. These files are read by the model and then processed. The output file produced by the model is picked up by the WPS process, transformed to O&M and finally returned to the client.
6. Geoprocessing REST API
The default binding specified in the WPS specification relies on the definition of service operations and XML encodings for the message and data exchange. While this approach provides advantages for integrating processes in existing service-oriented architectures and spatial data infrastructures, the encoding and parsing of large XML documents imposes challenges for Web clients (Peng, Cao, and Xu Citation2011). REST APIs provide a slim interface by focussing on the exchange of resource representations encoded in JSON using the HTTP base operations (GET, PUT, POST, DELETE). REST as introduced by Fielding (Citation2000) is an architectural style defined by a number of constraints. As such, it does neither require HTTP as communication protocol nor JSON as default exchange format. However, from our experience the vast majority of current implementations relies on HTTP and JSON. Though the WPS 2.0 standard targets the development of REST-based WPS, an explicit specification of a REST binding is still missing. Since the TaMIS Control Center is implemented as a browser-based Web application, we have defined a slim REST binding for the WPS interface in order to simplify the client development and encourage the usage in other Web clients beyond the project.
shows the underlying resource model of the Geoprocessing REST API. It is based on the resources defined in the WPS specification and on a first proposal for a RESTful WPS (Foerster, Brühl, and Schäffer Citation2011). All resource representations can be retrieved using the HTTP GET operation. The Capabilities resource is encoded in JSON and provided at the root URL of the API. It lists common metadata like provider information or the available processes. As the list of the available processes, the ProcessCollection, is modelled as an independent resource, it is also accessible at a dedicated endpoint and only lists the processes with its id, label, description, and the url containing a link to the full process description. Clients can resolve the url to navigate to a single Process representation. shows a Process representation encoded in JSON, that corresponds to a process description in the WPS specification. Compared to a XML process description, the JSON document is significantly shorter and reduces the client complexity, since JSON is the default serialization of JavaScript objects.
Figure 5. UML diagram of the process model for the Geoprocessing REST API.
Listing 1. Process description encoded in JSON (Note: Some elements have been removed in the JSON examples for better readability)
A Job resource represents an actual execution of a process with specific inputs and outputs. In order to create a new Job, a new Job representation specifying inputs and outputs encoded in JSON, as shown in , needs to be sent to the JobCollection endpoint using the HTTP POST operation.
Listing 2. Job resource encoded in JSON with input and output definition that needs to be posted to the API to create a new job.
The standard execution mode of the API is asynchronous: Thus, a response is immediately returned after posting a new Job resource, even though the actual execution of the Job has not finished. The response consists of a HTTP status code 201 (created) and a HTTP location header pointing to the Job. The Job representation contains information about the status of the job execution, as shown in .
Listing 3. Representation of a running Job encoded in JSON
If the process is finished, links to the outputs are generated and added in the Job representation (). It is also possible to execute a process synchronously, meaning that the response is returned after the process has finished working. For this, a URL parameter sync-execute=true needs to be appended to the execute-URL. The outputs of a Job are provided by reference (see Müller and Pross Citation2015, Section 6.6).
Listing 4. Representation of a Job that is finished encoded in JSON
7. The TaMIS Control Center
The TaMIS Control Center is the central access point for the dam manager. shows a screenshot of the landing page of the TaMIS Control Center. The Web client visualizes measurements that are relevant for dam safety monitoring. Herewith, a dam manager gathers a clear picture of the current situation at the dam. The client is based upon AngularJS, one of a few JavaScript frameworks to build modular Web applications. The geoprocessing module allows for interaction with the geoprocessing services explained above. The current version of the prototype is accessible at http://fluggs.wupperverband.de/tamis-demo (only German language supported).
Figure 6. Screenshot of the TaMIS Control Center landing page. The different WPS processes can be selected in the navigation bar in Alle Apps at the top.
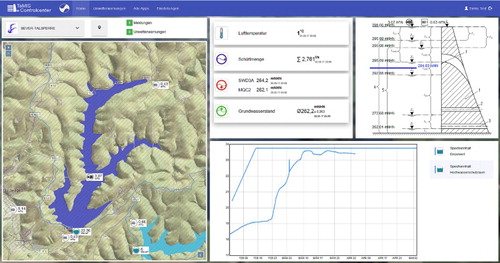
Utilizing the spatial interpolation profile, a user is able to compute the water level coverage at the dam structure's air side. Comparing the coverage over a certain time period can lead to a better understanding of the processes in the dam. Once a user executes the process, the client constantly requests the corresponding WPS's status until the computation results are available. In this particular case the result is a set of maps each showing the situation of the water level coverage in the dam at a certain point in time. This helps to identify unexpected patterns in the dam building; for example, reduced water level might indicate a potential increased seepage behaviour at a certain location.
The Web client's WPS prediction module supports the water management process at the dam. It allows for forecasting the fill level in the reservoir over a short time period. The client component serves as a what-if analysis tool, for example, answering the following question: If the reservoir has an average income of 0.2 m3/s and the outflow is set to 0.6 m3/s what will be the fill level after two days?
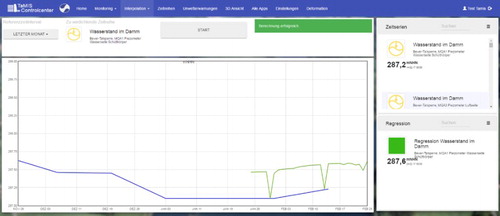
The user has to specify three input variables for the model. A first input is the time span (e.g. two days) the prediction should be computed for. The second is the estimated water income for the defined time span. The water outflow is the third input that is required by the user. The remaining input variables are contained in the client configuration and transparent to a user for a better usability experience. In order to compare multiple prediction results, the Web client allows for specification of a maximum and minimum value for both, estimated water income and outflow. Herewith on execute, one process for each minimum–maximum income–outcome tuple is started and monitored by the client, resulting in four parallel processes. The results are expected to be time series describing the fill level's behaviour over the forecasted time period. The outcomes of the latter prediction process can be used as inputs in a further prediction client module to forecast the water level in the dam that is dependent on the precipitation and the fill level in the dam. shows a screenshot of the Web interface for running the regression model and generating predictions. The predicted time series is shown in the time series graph as an additional time series.
Figure 7. User interface for executing the fill level prediction.
8. Discussion
The benefits of using open standards for online geoprocessing are increased interoperability and re-usability of the offered services, see for example Hofer (Citation2015) or Zhao, Foerster, and Yue (Citation2012). This allows for flexible reuse of both, observation data sources as well as geoprocessing tools. In the TaMIS project, the water level information has been available in SOS beforeFootnote2 and is used in several external clients. Furthermore, water level measurements from federal agencies are also provided using SOSFootnote3 and can thus be easily integrated with the regional water level measurements. Other software, for example, the WPS ArcMap client (Pross et al. Citation2016), can access the functionalities via the WPS interface. Additional analysis functionality supporting the WPS interface can be easily integrated resulting in improved extensibility. Finally, using WPS interfaces also comes with the general advantage of distributed services in service-oriented architectures: The implementation of the actual processing is hidden behind the interface. It may be deployed on a simple Web server, as done in the TaMIS project, or in a grid or cloud infrastructure like demonstrated in Baranski (Citation2008).
The current OGC WPS specification requires a profile for each process implementation in order to restrict the inputs and outputs and to describe the functionality offered. This will result in a large number of WPS process profiles leading to the question how these profiles could be administrated and found by users interested in implementing or using a process profile. We hence think that a crucial next step is to provide a profile repository where new profiles are registered with existing implementations. Furthermore, the approach for defining hierarchical profiles as introduced by Müller (Citation2015) may also ease discovery and reduce complexity. So far, the profiles presented are implementation profiles. Adding generic abstract profiles, for example, for regression analysis, may further ease discovery and reuse of profiles. Besides describing the functionality and restricting the inputs and outputs, the next level would provide semantic descriptions in these profiles (Hofer et al. Citation2017) in order to infer the meaningful application of geoprocessing functionality (Stasch et al. Citation2014; Scheider and Tomko Citation2016).
As illustrated above, SOS and WPS can be coupled in different ways. In the TaMIS system the SOS and WPS are tightly coupled, meaning that the WPS can directly access the SOS data source to retrieve process inputs and store process outputs. This reduces the client's complexity and communication need. However, another interesting approach is to provide a WPS interface for an existing SOS instance (one-component approach in Section 4). This would be the best option, if processing facilities should only be offered for a particular SOS or in case of very large time series data in order to avoid the data transfer from SOS to WPS. So far, the most often utilized option is the loose-coupling approach that comes with several communication and performance bottlenecks. We hence recommend to develop best practices for other use cases in hydrology and other domains that demonstrate and evaluate tight-coupling and one-component approaches to the processing of observation data by means of OGC SOS and WPS.
While the XML bindings specified for SOS and WPS provide advantages when integrating observation data or processing functionality in existing service-oriented architectures or spatial data infrastructures, supporting XML-based service interfaces in Web clients is a challenging task, especially if these are implemented as JavaScript clients. For this purpose, REST APIs providing JSON encodings for the resource representations are much more useful. We hence defined a REST binding for the WPS that eases the integration with Web clients, as shown for the TaMIS control center. This REST binding may serve as input for defining an official REST binding for the WPS standard at OGC. The REST binding was implemented as a proxy component on top of the WPS, allowing to be applied to other WPS for adding a REST binding to them, but also allowing to reuse the WPS with clients that only support the POST-XML-binding of WPS. Similarly, the outputs are written to standard SOS, but on top of this, the 52° North Sensor Web REST API has been used to ease client integration. Currently, an official REST binding for SOS is not yet available. The Sensor Things API relies on REST, but has a distinct focus on Internet-of-Things (IoT) applications (Liang, Huang, and Khalafbeigi Citation2016). A proposal for a JSON encoding of O&M is available as a discussion paper (Cox and Taylor Citation2015). The approach implemented in the TaMIS project may also serve as a basis for defining a SOS REST binding.
The implemented R scripts in the use-case serve as a first illustration only. No attempts have been made to develop an elaborated statistical model that captures the variety of processes acting on a dam. However, improving the model and capsuling it in an R script would be sufficient to easily include it in the TaMIS Control Center and to provide it to further applications in the Web, since the system utilizes WPS4R for publishing R scripts as WPS processes (Hinz et al. Citation2013). Generally, no limitations apply as long as no user decisions have to be taken during the evaluation of the R scripts. However, choices could be realized in a cascade of processing services, where the user can potentially interact between steps. Furthermore, the statistical models implemented have not yet been evaluated regarding quality and uncertainty of their outputs, which we consider as future work.
9. Conclusions and future work
The TaMIS system demonstrates how standards for sensor data access and geoprocessing ease the integration of different sensor data sources with different geoprocessing technologies. In particular, the OGC SOS and WPS implementation specifications were used and evaluated. Different profiles for applying linear regression analysis, spatial interpolations, and a complex precipitation run-off model on time series provided in SOSs have been specified. By means of the OGC WPS, these different analysis facilities can be easily integrated using the same standardized interface. Optionally, the results of the linear regression analysis can also be persisted in SOSs using the transactional interface. A REST API on top of the WPS eases integration in Web clients and reduces the communication overhead.
The next steps are on the one hand improving the models deployed in the TaMIS project, that is, the regression and interpolation models, and evaluating the quality and uncertainty of the predictions. On the other hand, we plan to propose the REST binding as an official extension to the WPS standard and to continue working towards a profile registry. Since dam monitoring is a critical task, further work will be done on security and on applying methods and tools for fault-tolerance. Finally, so far the WPS interface was used for a technical integration and semantics have not yet been dealt with in the use case presented. We hence also consider to add semantics to the process description in order to enable guidance for users and automate processing workflows.
Disclosure statement
No potential conflict of interest was reported by the authors.
Additional information
Funding
Notes
1. http://tamis.kn.e-technik.tu-dortmund.de/ Note: Some information is only available in German language.
Related Research Data
References
- Baranski, Bastian. 2008. “Grid Computing Enabled Web Processing Service.” In Proceedings of the 6th Geographic Information Days, Vol. 32 of Ifgi Prints, edited by Mohamed Bishr, Edzer Pebesma, and Thomas Bartoschek, 243–256. Berlin: AKA Verlag.
- Bastin, Lucy, Dan Cornford, Richard Jones, Gerard B. M. Heuvelink, Edzer Pebesma, Christoph Stasch, Stefano Nativi, Paolo Mazzetti, and Matthew Williams. 2013. “Managing Uncertainty in Integrated Environmental Modelling: The UncertWeb Framework.” Environmental Modelling & Software 39: 116–134. Thematic Issue on the Future of Integrated Modeling Science and Technology. http://www.sciencedirect.com/science/article/pii/S1364815212000564. doi: 10.1016/j.envsoft.2012.02.008
- Botts, Mike, George Percivall, Carl Reed, and John Davidson, eds. 2007. OGC Sensor Web Enablement: Overview And High Level Architecture. OGC 07-165. Open Geospatial Consortium Inc. Accessed March 20, 2011. http://portal.opengeospatial.org/files/?artifact_id=25562.
- Botts, Mike, and Alexandre Robin, eds. 2014. OGC SensorML: Model and XML Encoding Standard. OGC 12-000. Open Geospatial Consortium Inc. Accessed November 10, 2016. http://portal.opengeospatial.org/files/?artifact_id=21273.
- Bröring, Arne, Johannes Echterhoff, Simon Jirka, Ingo Simonis, Thomas Everding, Christoph Stasch, Steve Liang, and Rob Lemmens. 2011. “New Generation Sensor Web Enablement.” Sensors 11 (3): 2652–2699. http://www.mdpi.com/1424-8220/11/3/2652/. doi: 10.3390/s110302652
- Bröring, Arne, Christoph Stasch, and Johannes Echterhoff, eds. 2012. OGC Sensor Observation Service Interface Standard. OGC 12-006. Open Geospatial Consortium Inc. Accessed December 12, 2012. https://portal.opengeospatial.org/files/?artifact_id=47599.
- Cox, Simon, ed. 2007. Observation and Measurements – Part 1 – Observation Schema. OGC 07-022r1. Open Geospatial Consortium Inc. Accessed March 22, 2011. http://portal.opengeospatial.org/files/?artifact_id=22466.
- Cox, Simon, ed. 2011. Observations and Measurements – XML Implementation. OGC 10-025r1. Open Geospatial Consortium Inc. Accessed March 22, 2011. http://portal.opengeospatial.org/files/?artifact_id=22466.
- Cox, Simon J. D., and Peter Taylor, eds. 2015. OGC Observations and Measurements – JSON implementation. OGC 15-100r1. Open Geospatial Consortium Inc. Accessed February 27, 2017. https://portal.opengeospatial.org/files/6491047599.
- Craglia, Max, Michael F. Goodchild, Alessandro Annoni, Gilberto Camara, Michael Gould, Werner Kuhn, and David Mark, et al. 2008. “Next-Generation Digital Earth: A Position Paper from the Vespucci Initiative for the Advancement of Geographic Information Science.” International Journal of Spatial Data Infrastructures Research 3: 146–167. http://ijsdir.jrc.ec.europa.eu/index.php/ijsdir/article/view/119/99.
- de la Beaujardiere, J., ed. 2006. OpenGIS Web Map Server Implementation Specification. OGC 06-042. Open Geospatial Consortium Inc. Accessed November 10, 2016. http://portal.opengeospatial.org/files/?artifact_id=21273.
- Deltares. 2016. Delft - Flood Early Warning System. Accessed November 10, 2016. https://oss.deltares.nl/web/delft-fews/.
- Fielding, Roy Thomas. 2000. “Architectural Styles and the Design of Network-based Software Architectures.” PhD thesis, University of California, Irvine.
- Foerster, Theodor, Andre Brühl, and Bastian Schäffer. 2011. “RESTful Web Processing Service.” Paper presented at the Proceedings 14th AGILE international conference on Geographic Information Science, Utrecht, Netherlands, 8.
- Gore, Al. 1998. “The Digital Earth – Understanding Our Planet in the 21st Century.” Australian Surveyor 43 (2): 89–91. doi:10.1080/00050326.1998.10441850
- Hiemstra, Paul H., Edzer J. Pebesma, Chris J. W. Twenhöfel, and Gerard B. M. Heuvelink. 2008. “Real-time Automatic Interpolation of Ambient Gamma Dose Rates from the Dutch Radioactivity Monitoring Network.” Computers & Geosciences 38: 1711–1721. doi:10.1016/j.cageo.2008.10.011.
- Hinz, Matthias, Daniel Nüst, Benjamin Proß and Edzer Pebesma. 2013. “Spatial Statistics on the Geospatial Web.” The 16th AGILE International Conference on Geographic Information Science, Leuven, Belgium. Accessed 23 April 2017. https://agile-online.org/Conference_Paper/CDs/agile_2013/Short_Papers/SP_S3.1_Hinz.pdf.
- Hofer, Barbara. 2015. “Uses of Online Geoprocessing Technology in Analyses and Case Studies: A Systematic Analysis of Literature.” International Journal of Digital Earth 8 (11): 901–917. doi:10.1080/17538947.2014.962632.
- Hofer, Barbara, Stephan Mäs, Johannes Brauner, and Lars Bernard. 2017. “Towards a Knowledge Base to Support Geoprocessing Workflow Development.” International Journal of Geographical Information Science 31: 694–716. doi:10.1080/13658816.2016.1227441.
- Liang, Steve, Chih-Yuan Huang, and Tania Khalafbeigi, eds. 2016. OGC SensorThings API Part 1: Sensing. OGC 15-078r1. Open Geospatial Consortium Inc. Accessed February 27, 2017. http://docs.opengeospatial.org/is/15-078r6/15-078r6.html.
- Lupp, M., ed. 2007. Styled Layer Descriptor Profile of the Web Map Service Implementation Specification. OGC 05-078r4. Open Geospatial Consortium Inc. Accessed March 22, 2011. http://portal.opengeospatial.org/files/?artifact_id=22466.
- Müller, Matthias. 2015. “Hierarchical Profiling of Geoprocessing Services.” Computers & Geosciences 82: 68–77. http://www.sciencedirect.com/science/article/pii/S0098300415001296. doi: 10.1016/j.cageo.2015.05.017
- Müller, Matthias, and Benjamin Pross. 2015. “OGC WPS 2.0 Interface Standard.” OGC Implementation Standard.
- Nüst, Daniel, Christoph Stasch, and Edzer Pebesma. 2011. “Connecting R to the Sensor Web.” In Advancing Geoinformation Science for a Changing World, 227–246. Berlin: Springer.
- Ostrowski, M., H. Lohr, and A. Leichtfuß. 2000. “Simulation Model TALSIM.” Paper presented at the decision support systems, international workshop. Vol. 6.
- Pebesma, Edzer. 2012. “Spacetime: Spatio-temporal Data in r.” Journal of Statistical Software 51 (7): 1–30. doi: 10.18637/jss.v051.i07
- Pebesma, Edzer, Dan Cornford, Gregoire Dubois, Gerard B. M. Heuvelink, Dionisis Hristopulos, Jürgen Pilz, Ulrich Stoehlker, Gary Morin, and Jon O. Skoien. 2011. “INTAMAP: The Design and Implementation of an Interoperable Automated Interpolation Web Service.” Computers & Geosciences 37 (3): 343–352. doi: 10.1016/j.cageo.2010.03.019
- Pebesma, Edzer J. 2004. “Multivariable Geostatistics in S: The GSTAT Package.” Computers & Geosciences 30 (7): 683–691. doi: 10.1016/j.cageo.2004.03.012
- Pebesma, Edzer J., and Roger S. Bivand. 2005. “Classes and Methods for Spatial Data in R.” R News 5 (2): 9–13. http://CRAN.R-project.org/doc/Rnews/.
- Peng, Dunlu, Lidong Cao, and Wenjie Xu. 2011. “Using JSON for Data Exchanging in Web Service Applications.” Journal of Computational Information Systems 7 (16): 5883–5890.
- Pross, Benjamin, Christoph Stasch, Albert Remke, Satish Sankaran, and Martin Hogeweg. 2016. “Sharing Geoprocessing Tools via the Web.” Accessed December 7, 2016. http://www.esri.com/∼/media/Files/Pdfs/news/arcuser/1016/sharing-geoprocessing-tools-via-the-web.pdf.
- R Core Team. 2016. R: A Language and Environment for Statistical Computing. Vienna: R Foundation for Statistical Computing. https://www.R-project.org/.
- Schaeffler, Ulrich, Daniel Moraru, Christian Heier, Karl-Heinz Spies, and Matthäus Schilcher. 2010. “Interpolation of Precipitation Sensor Measurements Using OGC Web Services.” In Proceedings of EnviroInfo 2010, edited by Klaus Greve and Armin B. Cremers, 549–555. Aachen: Shaker.
- Scheider, Simon, and Martin Tomko. 2016. “Knowing Whether Spatio-Temporal Analysis Procedures Are Applicable to Datasets.” In Formal Ontology in Information Systems, edited by Roberta Ferrario and Werner Kuhn, 67–80. Amsterdam: IOS Press.
- Spies, K. H., and M. Förster. 2005. “Der Nutzen einer Geodateninfrastruktur fr ein modernes Flussgebietsmanagement am Beispiel der Wupper.” Geodateninfrastruktur, Grundlagen und Anwendungen, 170–175.
- Stasch, Christoph, Theodor Foerster, Christian Autermann, and Edzer Pebesma. 2012. “Spatio-Temporal Aggregation of European Air Quality Observations in the Sensor Web.” Computers & Geosciences 47: 111–118. doi: 10.1016/j.cageo.2011.11.008
- Stasch, Christoph, Simon Scheider, Edzer Pebesma, and Werner Kuhn. 2014. “Meaningful Spatial Prediction and Aggregation.” Environmental Modelling & Software 51: 149–165. http://www.sciencedirect.com/science/article/pii/S1364815213001977. doi: 10.1016/j.envsoft.2013.09.006
- Tamayo, Alain, Pablo Viciano, Carlos Granell, and Joaquín Huerta. 2011. Empirical Study of Sensor Observation Services Server Instances, 185–209. Berlin: Springer Berlin Heidelberg. doi:10.1007/978-3-642-19789-5_10.
- Zhao, Peisheng, Theodor Foerster, and Peng Yue. 2012. “The Geoprocessing Web.” Computers & Geosciences 47: 3–12. Towards a Geoprocessing Web. http://www.sciencedirect.com/science/article/pii/S0098300412001446. doi: 10.1016/j.cageo.2012.04.021