
 ?Mathematical formulae have been encoded as MathML and are displayed in this HTML version using MathJax in order to improve their display. Uncheck the box to turn MathJax off. This feature requires Javascript. Click on a formula to zoom.
ABSTRACT
Broadly, this paper is about designing memorable 3D geovisualizations for spatial knowledge acquisition during (virtual) navigation. Navigation is a fundamentally important task, and even though most people navigate every day, many find it difficult in unfamiliar environments. When people get lost in an unfamiliar environment, or are unable to remember a route that they took, they might feel anxiety, disappointment and frustration; and in real world, such incidents can be costly, and at times, life-threatening. Therefore, in this paper, we study the design decisions in terms of visual realism in a city model, propose a visualization design optimized for route learning, implement and empirically evaluate this design. The evaluation features a navigational route learning task, where we measure short- and long-term recall accuracy of 42 participants with varying spatial abilities and memory capacity. Our findings provide unique empirical evidence on how design choices affect memory in route learning with geovirtual environments, contributing toward empirically verified design guidelines for digital cities.
1. Introduction
A virtual reality (VR) idea has fascinated people for decades, and early instances of VR were created in 1960s (Sutherland Citation1965). Because a virtual world can be used as a ‘spatial lab’, VR also found an audience in geography (e.g. Fisher and Unwin Citation2001). A peak in the excitement for potential contributions of an all-encompassing geographical VR to education and exploration led to the proposition of a Digital Earth (Gore Citation1998). The term virtual environments (VE) extends the VR concept into a visualization environment that can also feature simulated or fictional worlds. VEs in geography (geovirtual environments or GeoVEs) were suggested as a research priority in GIScience nearly two decades ago (MacEachren et al. Citation1999; MacEachren and Kraak Citation2001; Slocum et al. Citation2001), because they, in Slocum et al.’s (Citation2001, 62) words, ‘fundamentally change our traditional way of acquiring spatial knowledge’. In the past two decades, impressive progress has been made in technology, promising ‘better’ GeoVEs. However, we still know very little on how the visualization design in a GeoVE affects spatial knowledge acquisition. This paper contributes toward a better understanding of how (and how much) various elements of design, especially levels of realism, contribute to the recall effectiveness of GeoVEs as learning environments.
2. Related work
Below we provide a review of the related work on: (i) cognitive processes during navigation involving memory (ii) visualization design considerations and (iii) the individual differences in cognitive abilities relevant to (real or virtual) navigation tasks.
2.1. Cognitive processes related to navigation: the indispensable role of memory
Spatial cognition research on navigation largely reports on attention (i.e. what do people notice), and information encoding (i.e. what kind of mental notes they take) during navigation. In such studies, an important factor for route learning appears to be the perspective from which people experience the route. It has been proposed that an egocentric perspective during learning leads to the so-called route knowledge, that is, a ‘procedure’ of necessary movements to reach a point (Gillner and Mallot Citation1998), whereas an allocentric perspective leads to a ‘global’ understanding of the surroundings, termed survey knowledge (Lobben Citation2004). This position is debated, however, irrespective of its validity or whether it is survey or route knowledge, memory plays key role in all stages of spatial learning related to navigational tasks.
Memory is a multifaceted cognitive process. First of all, different memory types are involved in acquiring spatial knowledge. It is not straightforward to assign route- or survey-knowledge acquisition into one of the common memory systems (e.g. implicit/explicit) (Montello et al. Citation2004). Nonetheless, classifications have been proposed depending on the type of information one must recall. One such classification of memory types, relevant to this paper, refers to visual, spatial and visuospatial information. Although the visual and spatial memories are tightly coupled in some tasks (Klauer and Zhao Citation2004), we adopt the position that there are distinct memory systems that encode/store and decode/retrieve visual and spatial information (Della Sala et al. Citation1999); and the two often ‘cooperate’ (i.e. visuospatial). Notably, during the decoding, there are subtle differences in the processes, for example, the terms recall and recognition are distinguished (Freund, Brelsford, and Atkinson Citation1969). We use the term ‘recall’ for the memory tasks used in this paper for the sake of simplicity.
Memory systems are also classified based on duration, most commonly as short- and long-term. An event is stored in the short-term memory almost instantly, arguably for a few seconds (Peterson and Peterson Citation1959). Short-term memory, especially the ‘few-seconds’ definition, is often used interchangeably with the term working memory, although there are arguments for distinguishing the two. The most common argument is that the working memory does not store the information at all, while short-term memory stores it for a short time (Cowan Citation2008). The capacity of the working memory is limited to four to seven objects (Miller Citation1956; Cowan Citation2001), and the amount of detail stored regarding these objects is quite limited (Luck and Hollingworth Citation2008). Short-term memories are transient, whereas long-term memories are often reinforced with rehearsal, and once transferred to the ‘long-term storage’, they are assumed to have an infinite duration (Luck and Hollingworth Citation2008). We use the term short-term memory for recall rates several minutes after the experience (different than what is considered working memory), and long-term memory for knowledge decoding roughly after an hour or longer.
2.2. Visualization design considerations for route learning in VEs
Realistic and abstract geovisualizations are both used as learning aids in various contexts, and are important in route learning (Çöltekin et al. Citation2017). Realistic VEs are popular in testing navigational tasks, as they allow for a safe environment and more experimental control than the real world studies (Loomis and Blascovich Citation1999; Dünser et al. Citation2006; Bülthoff, Campos, and Meilinger Citation2008). In such contexts, it has been consistently shown with other types of geovisualizations that the visualization type and design affect performance with a variety of spatial tasks (Bleisch and Dykes Citation2014; Roth et al. Citation2017). Even subtle differences in visual variables (Garlandini and Fabrikant Citation2009), such as color (Brychtová and Çöltekin Citation2017), shading (Bernabé Poveda, Angel, and Çöltekin Citation2015; Biland and Çöltekin Citation2017), symbology type (Brügger, Fabrikant, and Çöltekin Citation2016) or levels of realism (Wilkening and Fabrikant Citation2011) can affect how well people execute various spatial tasks. While there are some considerations in comparing 2D and 3D (Cockburn and McKenzie Citation2002; Çöltekin, Lokka, and Zahner Citation2016), studies on how to design a GeoVE to make route learning more effective are scarce.
A key decision regarding visualization design appears to be about the amount of information, that is, too much information can increase cognitive load and impair performance with spatial tasks (Smallman and John Citation2005; Plesa and Cartwright Citation2008; Hegarty, Smallman, and Stull Citation2012; Dong and Liao Citation2016; Liao et al. Citation2016). VEs are often designed as photorealistically as possible, with the objective to replicate the real world and increase immersion (even though immersion does not necessarily require photorealism, see McMahan Citation2003). In this paper, we ask if ‘too much information’ can impair performance in spatial tasks, is photorealism a threat to GeoVEs’ effective use in certain contexts? At this point, we do not have clear guidelines on how much realism should be included in GeoVEs.
Abstract visualizations (ideally) remove task-irrelevant information, and guide users’ attention to the relevant information for a specific task (Scheiter et al. Citation2009), and have been shown to be more effective than realistic visualizations in some spatial tasks (Hegarty, Canham, and Fabrikant Citation2010; Wilkening and Fabrikant Citation2011). In support of abstraction, Sanchez and Branaghan (Citation2009) demonstrated that adding more detail on a display affects map reading negatively, and impairs recall success in a route learning task. Conversely, a highly realistic visualization might have higher ecological validity than an abstract alternative, given that a VE simulates the real world (Kattenbeck Citation2015). Besides, a realistic VE includes readily recognizable elements, which might support memory (Christou and Bülthoff Citation1999; Meijer, Geudeke, and van den Broek Citation2009; Borkin et al. Citation2013). The realistic looking visual elements that people can name might be better retained in memory compared to more abstract shapes and structures, because of the so-called dual channel assumption; that is, people utilize two cognitive channels (e.g. verbal and visual) simultaneously (Mayer and Moreno Citation2003).
Some efforts to manage the level of detail (LOD) in VEs focus on presenting features with different LODs; using ‘more detail’ selectively as highlighting mechanisms, for example, in focus + context visualizations (Betrancourt Citation2005; Semmo et al. Citation2012; Peters et al. Citation2017), and using additional objects as landmarks (Parush and Berman Citation2004). Other efforts focus on the technical aspects of defining and creating LOD (e.g. https://www.citygml.org/), or managing LOD by removing perceptually irrelevant details (e.g. Bektaş and Çöltekin Citation2011).
Besides the amount, the semantic quality of the information (what is shown) can influence route learning performance in a VE. For example, landmarks play a significant role in spatial knowledge acquisition (Richter and Winter Citation2014). Landmark is a difficult term to define, however, structural, visual and semantic saliency are important characteristics for landmarks (Raubal and Winter Citation2002; Klippel and Winter Citation2005). For structural salience, the impact of location appears to be important (e.g. Röser et al. Citation2012). Röser et al. (Citation2012) found that the landmarks at the decision points (intersections) are the most important, especially those at the direction of the turn. Visual salience is also important in the context of navigational learning, as attention is critical in memory and learning (Itti, Koch, and Niebur Citation1998). Besides landmarks, Lynch (Citation1960) identifies paths (routes) to be ‘predominant elements in [the observer’s] image’ (Lynch Citation1960, 47), and Claramunt and Winter (Citation2007) posit that street networks are cognitively (semantically) salient. We believe that for a memorable GeoVE, all three aspects of saliency (visual/structural/semantic) must be considered.
An interesting additional aspect in visual realism studies is that seemingly people’s intuitive preferences do not always match their performance with realistic visualizations. Two theories have been proposed in relation to this mismatch between performance and preference: Smallman and John’s (Citation2005) naive realism theory suggests an unfounded preference toward realism, which was later followed by naive cartography in which the effect was reproduced for enhanced displays with animations and 3D (Hegarty et al. Citation2009). These theories provide an interesting insight into how our visualization-related choices could be misguided, and should be considered in studies such as ours.
2.3. Individual and group differences
People differ in learning with visualizations based on various abilities, age, expertise and other factors in their background (Slocum et al. Citation2001). For example, Huk (Citation2006) demonstrates that people with higher spatial abilities (high-spatial) benefit more from 3D in learning than people with lower spatial abilities (low-spatial). Spatial abilities that are most relevant in navigational tasks are proposed to be: (mentally) visualizing objects, relating objects, mental rotation, path integration and spatial updating (Richter and Winter Citation2014). Standardized psychometric tests (Ekstrom et al. Citation1976) can predict people’s effectiveness in using visualizations (Hegarty and Waller Citation2004). Spatial abilities, as measured by standardized tests, can have a significant influence on people’s performance also in navigation tasks (Schinazi et al. Citation2013). It is interesting to note that the spatial abilities might play a role even in naive realism. In Smallman and Cook’s (Citation2011) study, all participants preferred the realistic displays before the experiment, but only high-spatial participants adjusted their preference to abstract displays after; suggesting that low-spatial participants struggle assessing self-performance.
Various other factors in a user’s background, such as experience, age (Salthouse Citation2006) or gender (Parush and Berman Citation2004) might also affect route learning performance. In the scope of this paper, we analyze how spatial abilities and memory capacity interact with route learning performance, and counterbalance for other factors that might affect performance in route learning.
3. Hypotheses
Based on the previous work cited above, we propose a VE that is designed with specific amount and type of information presented in key locations, that is, we use photo-textures only for selected parts of the VE. These parts are thus ‘highlighted’ and should act as anchoring points or landmarks. With our proposed virtual world (MixedVE), route recall should be easier than with a RealisticVE, or an AbstractVE with no textures. We specifically hypothesize that:
Participants’ visual, spatial and visuospatial recall performance will be best with the MixedVE, irrespective of their spatial abilities, both in the short- and long-term
Participant’s overall recall performance with the RealisticVE will be better than with the AbstractVE, as the RealisticVE provides more visual cues
High-spatial participants will overall perform better with the RealisticVE, and specifically with tasks that are more demanding on the memory than the low-spatial participants.
4. Experimental design
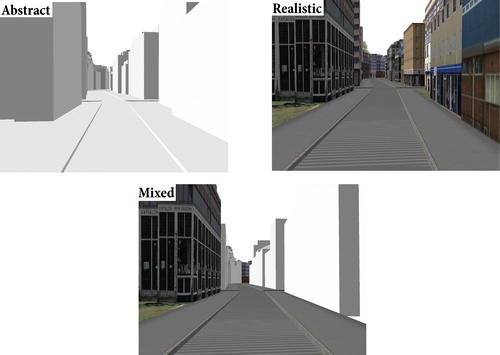
In a mixed factorial design (3 × 2×4), we tested the three levels of realism as our independent variables: (i) the AbstractVE with no photo-textures (baseline), (ii) the RealisticVE (fully photorealistic) and (iii) the MixedVE designed based on previous knowledge on levels of realism and landmark theories () (Lokka and Çöltekin Citation2016, Citation2017). Throughout the manuscript, we call these VEs visualization types. Four different task types (Visual, Spatial, Visuospatial and Map/perspective switch), and individual differences based on two criteria (spatial ability, memory capacity) are considered as potentially moderating factors. Note that we study the recall rates (i) right after the route learning task (short-term memory: Stage1), (ii) about an hour later (long-term memory: Stage2) and (iii) a week later (long-term memory: Stage3). Thus, we examine if (potential) differences in memory performance with the three VEs would persist.
Figure 1. Screenshots illustrating the three VEs (not to scale).
As dependent variables, we report on recall accuracy for all visualization types and task types, and participants’ visualization preferences before and after the experiment.
4.1. Participants
Forty-two participants (M = 27 years, 23 women) voluntarily took part in the experiment based on informed consent. The age range was kept to 20–30, because aging affects memory (Park et al. Citation2002). All participants were university students (undergraduate to PhD) in different degree programs and were recruited through individual contact. We measured their spatial abilities using a Mental Rotation Task (MRT, Vandenberg and Kuse Citation1978), and visuospatial memory capacities using a Visuospatial Memory Test (VSM, Ekstrom et al. Citation1976).
4.2. Materials
4.2.1. Apparatus
We performed the experiment in controlled lab, where we back-projected the VEs as videos on a large screen (230 × 140 cm), which was 2.2 m away from the participant (). We used an off-the-shelf experimental software to deliver all visualizations and tasks.
Figure 2. Experimental setup (left-top), the two routes (left-bottom) and the procedure (right).
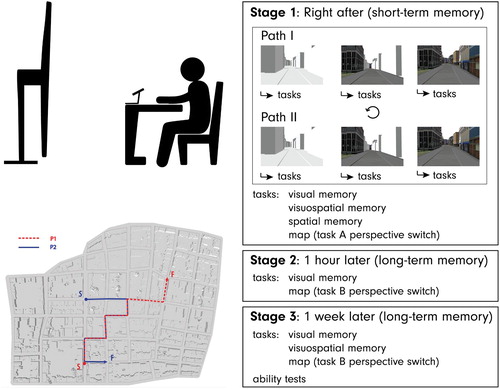
Stimuli. All VEs represented the same fictitious city, which was created using procedural modeling. We kept the lighting conditions constant, the buildings similar in size and in architectural style, trees and intersections with comparable visual and spatial characteristics. From each VE, we created fly-bys of two pre-selected routes as videos. All videos were shown only once at the same eye-level, the same scale, extent and speed, simulating a drive (duration: 100 s, speed: 30 km/h). The AbstractVE was rendered in grayscale without photo-textures (, top-left). The MixedVE had photo-textures on selected buildings at the turn points toward the direction of the turn, and the road network was photo-textured to highlight the spatial structure (, bottom). The contents of the photo-textures were counterbalanced with regards to visual saliency (i.e. using visual-saliency algorithms by Itti et al. Citation1998) and memorability (e.g. Borkin et al. Citation2013; Lokka and Çöltekin Citation2017) in the MixedVE. The RealisticVE was fully photo-textured (, top-right).
We prepared two routes; each consisted of seven intersections (three turns toward the left, three turns toward the right and one continuing straight, as presented in ).
4.3. Tasks
The participants were instructed to memorize a route from a starting to an ending point as they watched the videos in a wayfinding scenario. For each visualization type, they responded to a set of questions (in Stages 1, 2 and 3) which we categorize into four task types:
Visual memory (VM) tasks: Based on six screenshots from each VE (three correct, three false), participants’ task was to identify whether they had seen the image or not. They answered using a 6-point Likert scale ranging from ‘definitely-seen’ to ‘definitely-not-seen’. This task type was used in all experimental stages.
Spatial memory (SM) tasks: In this set, participants were asked to identify the direction they were facing at the end of the route (starting orientation was given), and the number of turns they took during the virtual drive. These two questions were asked only in Stage 1. They were left out from Stages 2 and 3, as it would be impossible to distinguish from which visualization type they recalled the information after having watched all videos.
Visuospatial memory (VS) tasks: Participants marked which direction they turned at all seven intersections one-by-one, based on screenshots, which appeared in the same order and perspective as in the VEs. Additionally, they were asked to identify the start- and end-points of their route from four options (only one was correct). These questions were asked in Stages 1 and 3. We excluded the VS tasks in Stage 2 because of time limits.
MapTask (MT)/perspective switch: This task type requires a perspective switch (from egocentric to allocentric), and can be seen as a special instance of the VS tasks, they are predominantly spatial, but some visual cues were also provided (‘aerial’ view screenshots from each VE). Participants were to first identify (Stage 1, MapTaskA), then actively reproduce (Stages 2–3, MapTaskB) the route based on a top-down 2D view. In Stage 1, four options were provided with one correct answer (MapTaskA), and in Stages 2–3, participants drew sketches (start- and end-points were marked) on paper (MapTaskB).
4.4. Procedure
Upon arrival, we welcomed the participants, and they read and signed the consent form. Right after, participants stated their preference between the three VEs (shown as screenshots) for a hypothetical route learning task. Then the main experiment began. Participants watched the three VEs for the two pre-selected routes (thus, six videos) in a randomized order. After each video, they answered a set of questions with all four task types. After the first three videos and associated questions, participants took a small break (to counter learning and fatigue). After viewing all six videos and solving associated tasks, Stage 1 was completed. Stage 2 followed with two task types (Visual & MapTaskB) regarding all six videos shown in Stage 1 and stated their preference again between the three visualizations. The duration of the experiment was on average 1 h:30 m for Stages 1–2. Participants came back 6–8 days later for Stage 3, responded to a demographic questionnaire, and continued with three task types (Visual, Visuospatial and MapTaskB), after which we conducted the MRT and VSM tests. Stage 3 lasted approximately 1 h. An overview of the procedure is shown in .
5. Results
Below, we provide participants’ overall recall accuracy with the VEs, followed by how different task types interact with recall accuracy. Then, we examine how participants’ spatial abilities (based on the MRT) and memory capacity (based on the VSM) interact with their recall accuracy with each VE and task type. We then demonstrate the long-term recall rates based on a comparison between the three stages for comparable tasks. Furthermore, we report on participants’ preferences regarding the tested visualization types before and after the experiment.
The recall accuracy was calculated as the proportion of correct answers to all answers. For the MapTaskB, we counted the errors in number of turns, the number of left/right turns, the sequence and the direction for the start- and end-points. Statistical analyses were conducted using R with α = .05. We report associated p-values <.05 as statistically significant, and mark the p-values that fall between [.1–.5] as statistical trends. We include estimations of effect size (), for which .01 is considered small, .06 medium, and .14 and above, large (Ellis Citation2010).
5.1. Short-term memory: Stage 1
demonstrates that for the short-term memory tasks, participants’ recall accuracy is highest with the MixedVE. The MixedVE improves recall accuracy by roughly 12.1% in comparison to the AbstractVE, and 7.7% in comparison to the RealisticVE. Both differences are statistically significant with a large effect size (, ‘overall’). We also see that the participants’ overall recall accuracy is higher with the RealisticVE than with the AbstractVE.
Figure 3. Overall recall accuracy for each VE. Error bars show ±SEM. ***p < .001, *p < 05.
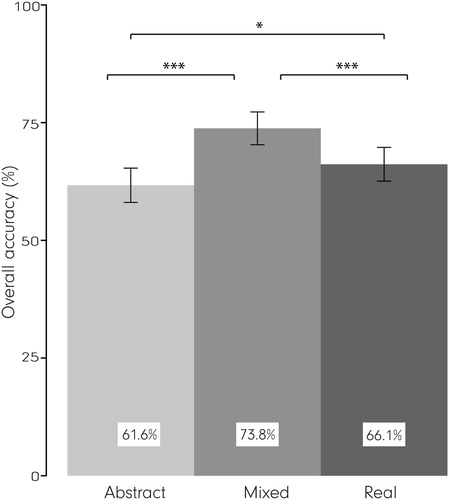
Table 1. Mean recall accuracies, ANOVA (F, p, ηp2, and pairwise comparisons (for statistically significant results).
At the task level (), we see that the overall recall improvement provided by the MixedVE is pertinent for all task types except for the Spatial tasks.
Figure 4. Interactions between visualization types and task types for recall accuracy rates. Error bars show ±SEM. ***p < .001, **p < .01, *p < 05.
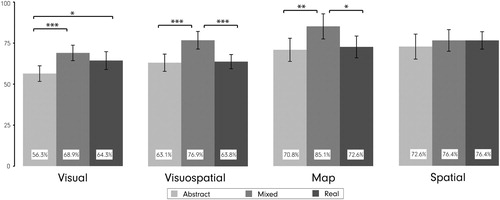
Pairwise comparisons reveal statistically significant differences between the VEs except with the Spatial tasks (). We see that with all Visual or Visuospatial task types (including the MapTask), participants’ recall accuracy is higher with the MixedVE than with the AbstractVE, and in most of them, they also perform better with the MixedVE than with the RealisticVE. For predominantly Visual tasks, participants’ recall accuracy with the RealisticVE and the MixedVE is not statistically significant.
5.1.1. Individual differences in short-term memory
Based on participants’ scores in the MRT (median = 20) and VSM (median = 22) tests, we created high-/low-ability groups using a median split (excluding the median). We call the MRT-based groups low-MRT (n = 19) and high-MRT (n = 18), whereas we call the VSM-based groups low-VSM (n = 20) and high-VSM (n = 19) from this point forward. shows that there are differences in the recall accuracy of the participants both based on their MRT scores [in favor of the high-MRT with the Realistic VE (t(36.97) = –2.51, p < .05*, r = .38)] and based on their VSM scores [in favor of the high-VSM for the MixedVE (t(32.89) = –2.18, p < .05*, r = .35), and the RealisticVE (t(34.53) = –2.44, p < .05*, r = .38)].
Figure 5. Overall recall accuracy for each visualization type based on MRT- and VSM-split groups. Error bars show ±SEM. ***p < .001, **p < .01, *p < 05.
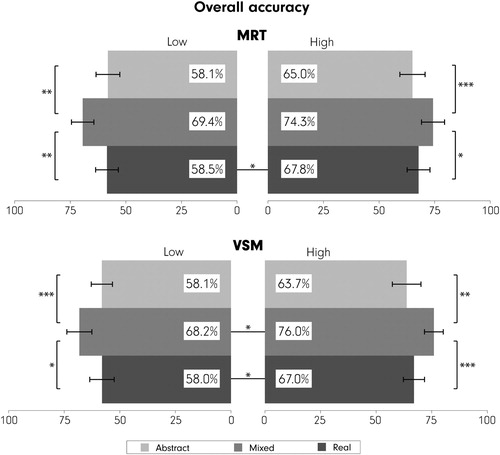
At the task level, and (below) reveal that, for both the MRT and VSM-based groups, irrespective of the abilities, the MixedVE leads to higher recall accuracy than the other two visualization types in most tasks. Specifically, we see that the MixedVE offers an advantage over the AbstractVE for both the low and the high-MRT groups for the Visual tasks; but not over the RealisticVE. RealisticVE also allows for higher recall accuracy than the AbstractVE for the high-MRT group, but not for the low-MRT group. VSM-split largely confirms these findings for the Visual tasks, except that a high-VSM does not suggest an advantage with the RealisticVE over the AbstractVE. For Visual tasks, the high-VSM group exhibits a higher recall accuracy than the low-VSM group only with the MixedVE (t(33.52) = –2.38, p < .05*, r = .38). For the visuospatial tasks, the low-MRT group benefits from the MixedVE more than the Abstract and the RealisticVEs, but for the high-MRT group, visualization type does not make a difference. We also see that the high-MRT group has a higher recall accuracy than the low-MRT group with the Abstract (t(35.48) = –2.99, p < .01**, r = .45) and Realistic (t(34.27) = –2.68, p < .05*, r = .42) VEs, but this difference disappears for the MixedVE. For the same task category, we see that both high- and low-VSM groups benefit from the MixedVE, more than both the Abstract and RealisticVEs. For Visuospatial tasks, we see no differences between the Abstract and RealisticVEs, although the high-VSM group appears to have an advantage with the RealisticVE (t(34.96) = –2.53, p < .05*, r = .39), but not for the Abstract or MixedVEs. For the MapTask, MixedVE helps the low-MRT group, and in contrast, the high-VSM group in comparison to the AbstractVE, but we see no differences between the MixedVE and the RealisticVE. However, high-VSM group has a higher recall accuracy than the low-VSM group with the RealisticVE (t(33.90) = –2.29, p < .05*, r = .37). For the Spatial tasks, we observe no difference between visualization types in any of the tested conditions.
Figure 6. Interactions between the visualization types and task types for the low/high-MRT and low/high-VSM groups’ recall accuracy rates. Error bars ±SEM. ***p < .001, **p < .01, *p < .05.
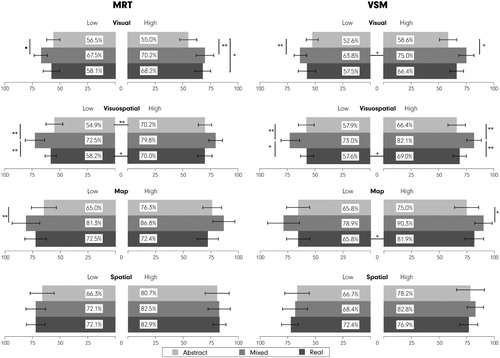
Table 2. ANOVAs (F, p, ηp2 and pairwise comparisons of mean recall accuracies for high/low-MRT and high/low-VSM groups per visualization and task types.
5.2. Long-term memory: comparing recall accuracy in all three stages
Below, we present mean recall accuracies for comparable visualization and task types in all stages (). We see that the MixedVE continues to facilitate higher recall accuracies than other two VEs in most comparisons also in the long-term. The observed differences (MixedVE vs. others) are statistically significant with moderate or large effect sizes. Between the AbstractVE and RealisticVE, we see only one difference at Stage 2, but the p-value only indicates a trend (p = .0511), and the effect size is small ( = .037).
Table 3. Mean recall accuracies in all stages, ANOVA (F, p, ηp2, and pairwise comparisons for statistically significant results.
In , we demonstrate the interactions between the task and visualization types over the three stages in terms of decline in the recall accuracy. We see an overall decline for all task/visualization types, except that for Visual and MapTasks, AbstractVE does not exhibit a decline in recall performance.
Table 4. Mean recall accuracies in all stages for comparable tasks in each VE. ANOVA (F, p, ηp2, and pairwise comparisons.
5.2.1. Individual differences
We identified no statistically significant differences (p > .05) amongst the three visualization conditions for Stages 2–3, when we group our participants based on their MRT–VSM abilities.
5.3. Visualization preferences
Visualization preferences of the participants before and after they worked with the VEs are shown in . We see that before the experiment, majority of the participants preferred the RealisticVE (88%), 12% the MixedVE, whereas none preferred the AbstractVE. After the experiment, majority changed their preference to the MixedVE (69%), 31% remained with the RealisticVE, and still none preferred the AbstractVE. Those who changed their preferences all did so from the RealisticVE to MixedVE (there were no instances of the opposite).
Table 5. Participants’ preferences for the visualization types before and after the experiment.
To identify whether individual differences changed the preference behavior similarly as in Smallman and Cook’s (Citation2011) naive realism studies, we checked the preferences of high/low-MRT and high/low-VSM groups before and after the experiment (). Unlike in the original naive realism studies, our analyses revealed the same pattern for all groups, irrespective of their spatial abilities or memory capacity.
Table 6. High/low-MRT and high/low-VSM groups’ preferences for the visualization types before and after the experiment.
6. Discussion
Based on previous empirical evidence found in relevant literature, we designed the MixedVE with a texture-highlighting approach, and evaluated it in a three-stage user study. In designing the MixedVE, we made significant adjustments to visual realism levels to lighten cognitive load (Smallman and John Citation2005; Smallman and Cook Citation2011), carefully selected the location of the textured buildings to boost memory by placing them at intersections (Röser et al. Citation2012), and counterbalanced the contents of the textures for saliency (Itti et al. Citation1998) and memorability (Borkin et al. Citation2013). In addition to design, individual differences can have an impact in learning performance from visualizations as well as in navigational tasks (e.g. Montello et al. Citation2004; Huk Citation2006; Schinazi et al. Citation2013). Thus, we conducted an analysis of the individual differences in route-recall accuracy based on two measurements: spatial ability (MRT) and visuospatial memory capacity (VSM). Our results provide unique and new insights, and we discuss their implications below.
Our findings overall confirm our main hypothesis that the MixedVE facilitates better route recall than the AbstractVE and RealisticVEs (). At the task level (), we see that the effectiveness of the MixedVE in route recall is pertinent to all task types except the Spatial tasks. The two tasks we classified ‘Spatial’ were about orientation (which cardinal direction were you facing at the end of the route), and the number of turns participants’ took in the virtual drive. The mean recall accuracy in Spatial tasks is identical for the MixedVE and RealisticVE (76.4%), while it is slightly lower with the AbstractVE (72.6%). These numbers are relatively high in the context of the experiment, but not particularly higher or lower than in the other tasks, thus an experimental artifact (such as ceiling or floor effect) does not explain why visualization type did not matter for this task. It might be best explained by the fact that this task essentially requires no visual cues. For the tasks that require the use of visuospatial memory (Visuospatial, MapTask), selectively provided visual cues in the MixedVE improve recall accuracy (by ∼10%) compared to both the AbstractVE and RealisticVEs. This pattern is somewhat different for Visual tasks, where we see that the recall accuracy with the RealisticVE competes with the MixedVE, while both VEs with visual cues (Mixed/Realistic) lead to better recall accuracy than the AbstractVE. The fact that the RealisticVE overall facilitates visual memory better than the AbstractVE is not surprising, but it is noteworthy that it does not impair the performance in this task type, suggesting that the cognitive load is not ‘categorically’ too high with fully realistic displays, but it is rather task-specific.
After studying whether our proposed MixedVE is effective for route learning (overall recall accuracy shows that it is), and for what (analyses at the task level shows it offers benefits mostly in Visuospatial and Visual tasks), we ask whom it might benefit most. We expected that participants with high memory capacity (high-VSM) would not be affected as badly from the cognitive load induced by the RealisticVE, especially for the Visual tasks; whereas participants with higher spatial abilities (high-MRT) would do well with tasks with spatial components in them (Spatial, Visuospatial, Map) irrespective of the visualization type. In turn, low-MRT/VSM participants would potentially benefit more from the modifications offered by the MixedVE in all conditions. Overall, our findings show that the MixedVE helps all participants (), irrespective of their spatial abilities or memory capacities (the RealisticVE and AbstractVEs lead to no differences in performance across MRT/VSM groups). The high-MRT participants overall had a higher recall accuracy than the low-MRT participants with the RealisticVE (9.3% difference). This might mean that high-MRT participants are able to bypass the cognitive overload introduced by the RealisticVE better than the low-MRT, but AbstractVE is also hard for the high-MRT. Memory capacity (VSM-split) did not matter for the recall accuracy with the AbstractVE either, but we see that the high-VSM benefit more than the low-VSM from the MixedVE (by 7.8%) and the RealisticVE (by 9%). The VSM (memory capacity) matters clearly for tasks that are of visual/visuospatial nature. Overall, these findings confirm that having a larger capacity for spatial abilities or memory gives participants advantages in some conditions (Wolbers and Hegarty Citation2010), but the MixedVE improves everyone’s route learning performance.
An in-depth analysis of the interactions between individual differences, visualization and task types reveal that, except in Spatial tasks, MixedVE offers benefits in most tested conditions against the AbstractVE, and in some against the RealisticVE, irrespective of spatial abilities or memory capacity (). For the Spatial tasks, varying visual realism seems to be irrelevant also irrespective of spatial abilities or memory capacity. For the other tasks (Visual/Visuospatial/Map), most notably, descriptive statistics suggest in all cases MixedVE improves performance. Some of the differences are not statistically significant, however, note that we split the participants into groups of n ≅ 20 based on their MRT/VSM scores (thus the sample size might hinder identifying some differences that are there). Statistically significant differences suggest that MixedVE improves route learning performance for the low-MRT participants in majority of the cases, whereas it helps the high-MRT participants only with the Visual tasks. Reviewing the VSM-based results, we see that MixedVE improves route learning performance more often for the high-VSM participants, but also for the low-VSM participants in two task types. Also interestingly, RealisticVE does not appear to impair performance severely (i.e. not statistically significantly) in many cases when compared to other visualization types, but when we compare the groups of high- vs. low-MRT/VSM, we see that in three cases, the high-ability group outperforms the low-ability group with the RealisticVE (high-MRT in Visuospatial, high-VSM in Visuospatial and MapTasks). In these cases, there are no group differences for the MixedVE, which suggests that the MixedVE brings the performance of the lower-ability participants on par with the higher-ability participants. These findings are consistent with our expectations based on previous work and the results are desirable, given that we often want to create designs that work for all.
Since we were set out to test learning, we examined if the MixedVE’s benefits would persist over time. It is clear that we gradually forget what we learn (Luck and Hollingworth Citation2008). Our findings also indicate a steady decline in recall accuracy in Stages 2–3 for the MixedVE and the RealisticVE. The AbstractVE appears to have constant recall levels across all stages for the Visual and Map tasks: for the Visual tasks this is not a surprise, given that the visual cues are important for this task type, and without the visual cues the task is too hard from the beginning (∼50% recall accuracy is close to ‘chance’). For the Map tasks, the reasons might be more complex: the decline for the AbstractVE is not statistically significant for the Map task (), possibly because participants predominantly need to perform a perspective switch and the visual cues may not be as critical. However, the MixedVE continues to facilitate better recall accuracies than the other VEs also in the long-term (). Interestingly, the differences between spatial abilities and memory capacity in Stage1 disappear over time; suggesting that higher cognitive abilities help in short-term tasks, but do not necessarily assist in long-term recall of learned routes.
Our analysis of participants’ visualization preferences () shows that the RealisticVE is popular at first, but after working with the VEs, majority prefers the MixedVE. This finding contradicts Smallman and Cook’s (Citation2011) observation that (especially the low-spatial) participants do not seem to realize which visualization assists them. Our participant’s ‘zero interest’ in the AbstractVE and initially strong preference toward the RealisticVE supports that realism is generally more attractive, but similarly to some previous work (e.g. Brügger et al. Citation2016), they are able to detect what assists them once they worked with the visualizations, irrespective of their cognitive abilities.
7. Conclusions
For our proposed ‘MixedVE’, we adjusted the levels of visual realism, and deliberately selected the location of photo-textures to serve as memorable landmarks. Our rigorous evaluation demonstrates that the design principles we adopted in creating the MixedVE indeed facilitate route learning better than an AbstractVE and a RealisticVE. This observation remained overall true when we scrutinized the possible moderating factors (task types and cognitive abilities). MixedVE consistently led to comparatively higher recall accuracies (and never impaired performance); benefiting all participants irrespective of their cognitive abilities, both in short- and long-term.
Our overall aim is contributing toward empirically verified design guidelines for creating memorable GeoVEs, specifically to assist people to better memorize routes. We believe our findings will be relevant to VR content creators, GIScience and spatial cognition researchers, and has the potential to improve the navigation experience in real world if used as a training device. While in this paper our main interest was in the design and use of the VEs; in future experiments, further group differences (e.g. effects of age) can be examined, and real world navigation performance of individuals can be studied after training them with the MixedVE in comparison to a group trained with the RealisticVE, to confirm MixedVE’s utility and usefulness as a ‘memory training device’.
Acknowledgements
We would like to thank our participants for their valuable time and our reviewers for their valuable input.
Disclosure statement
No potential conflict of interest was reported by the authors.
ORCID
Ismini E. Lokka http://orcid.org/0000-0001-7970-1106
Arzu Çöltekin http://orcid.org/0000-0002-3178-3509
Additional information
Funding
Related Research Data
References
- Bektaş, Kenan, and Arzu Çöltekin. 2011. “An Approach to Modeling Spatial Perception for Geovisualization.” Procedia – Social and Behavioral Sciences 21 (January): 53–62. doi:10.1016/j.sbspro.2011.07.027.
- Bernabé Poveda, Miguel Angel, and Arzu Çöltekin. 2015. “Prevalence of the Terrain Reversal Effect in Satellite Imagery.” International Journal of Digital Earth, 8 (8): 640–655. http://www.tandfonline.com/doi/abs/10.1080/17538947.2014.942714?journalCode=tjde20 doi: 10.1080/17538947.2014.942714
- Betrancourt, Mireille. 2005. “The Animation and Interactivity Principles in Multimedia Learning.” In The Cambridge Handbook of Multimedia Learning, edited by R. Mayer, 287–296. Cambridge: Cambridge University Press. https://www.cambridge.org/core/books/cambridge-handbook-of-multimedia-learning/65ED189F0FD10F10A51ADAFF9AE14400.
- Biland, Julien, and Arzu Çöltekin. 2017. “An Empirical Assessment of the Impact of the Light Direction on the Relief Inversion Effect in Shaded Relief Maps: NNW Is Better Than NW.” Cartography and Geographic Information Science 44 (4): 358–372. http://www.tandfonline.com/doi/abs/10.1080/15230406.2016.1185647.
- Bleisch, Susanne, and Jason Dykes. 2014. “Quantitative Data Graphics in 3D Desktop-based Virtual Environments – An Evaluation.” International Journal of Digital Earth, 8 (8): 623–639. http://www.tandfonline.com/doi/abs/10.1080/17538947.2014.927536.
- Borkin, Michelle A., Azalea A. Vo, Zoya Bylinskii, Phillip Isola, Shashank Sunkavalli, Aude Oliva, and Hanspeter Pfister. 2013. “What Makes a Visualization Memorable.” IEEE Transactions on Visualization and Computer Graphics 19: 2306–2315. doi:10.1109/TVCG.2013.234.
- Brügger, Annina, Sara Irina Fabrikant, and Arzu Çöltekin. 2016. “An Empirical Evaluation of Three Elevation Change Symbolization Methods Along Routes in Bicycle Maps.” Cartography and Geographic Information Science, 1–16. doi:10.1080/15230406.2016.1193766.
- Brychtová, Alžběta, and Arzu Çöltekin. 2017. “The Effect of Spatial Distance on the Discriminability of Colors in Maps.” Cartography and Geographic Information Science 44 (3): 229–245. doi:10.1080/15230406.2016.1140074.
- Bülthoff, Heinrich H., Jennifer L. Campos, and Tobias Meilinger. 2008. “Virtual Reality as a Valuable Research Tool for Investigating Different Aspects of Spatial Cognition.” In International Conference on Spatial Cognition, 1–3. Berlin: Springer.
- Christou, Chris G., and Heinrich H. Bülthoff. 1999. “View Dependence in Scene Recognition After Active Learning.” Memory & Cognition 27 (6): 996–1007. doi:10.3758/BF03201230.
- Claramunt, Christophe, and Stephan Winter. 2007. “Structural Salience of Elements of the City.” Environment and Planning B: Planning and Design 34 (6): 1030–1050. doi:10.1068/b32099.
- Cockburn, Andy, and Bruce McKenzie. 2002. “Evaluating the Effectiveness of Spatial Memory and 3D Physical and Virtual Environments.” In Proceedings of the SIGCHI Conference on Human Factors in Computing Systems, 203–2103. Minneapolis, MN: ACM.
- Çöltekin, Arzu, Rebecca Francelet, Kai-Florian Richter, John Thoresen, and Sara Irina Fabrikant. 2017. “The Effect of Visual Realism, Spatial Abilities, and Competition on Performance in Map-based Route Learning in Men.” Cartography and Geographic Information Science. Advance online publication. doi:10.1080/15230406.2017.1344569.
- Çöltekin, Arzu, Ismini E. Lokka, and Martin Zahner. 2016. “On the Usability and Usefulness of 3D (Geo)Visualizations – A Focus on Virtual Reality Environments.” In International Archives of Photogrammetry, Remote Sensing and Spatial Information Sciences, Commission, 387–392. Prague: ISPRS. http://www.int-arch-photogramm-remote-sens-spatial-inf-sci.net/XLI-B2/387/2016/.
- Cowan, Nelson. 2001. “The Magical Number 4 in Short Term Memory: A Reconsideration of Mental Storage Capacity.” Behavioral and Brain Sciences 24: 87–114. doi:10.1017/S0140525X01003922.
- Cowan, Nelson. 2008. “What Are the Differences Between Long-term, Short-term, and Working Memory?” Progress in Brain Research 169: 323–338. doi: 10.1016/S0079-6123(07)00020-9
- Della Sala, Sergio, Colin Gray, Alan Baddeley, Nadia Allamano, and Lindsey Wilson. 1999. “Pattern Span: A Tool for Unwelding Visuo-spatial Memory.” Neuropsychologia 37 (10): 1189–1199. doi:10.1016/S0028-3932(98)00159-6.
- Dong, Weihua, and Hua Liao. 2016. “Eye Tracking to Explore the Impacts of Photorealistic 3D Representations in Pedestrian Navigation Performance.” International Archives of the Photogrammetry, Remote Sensing and Spatial Information Sciences 41:641–645. doi: 10.5194/isprsarchives-XLI-B2-641-2016
- Dünser, Andreas, Karin Steinbügl, Hannes Kaufmann, and Judith Glück. 2006. “Virtual and Augmented Reality as Spatial Ability Training Tools.” In Proceedings of the 7th ACM SIGCHI New Zealand Chapter’s International Conference on Computer–Human Interaction: Design Centered HCI, 125–132. Christchurch: ACM.
- Ekstrom, Ruth B., John W. French, Harry H. Harman, and D. Dermen. 1976. Manual for Kit of Factor-Referenced Cognitive Tests. Princeton, NJ: Educational Testing Service.
- Ellis, Paul D. 2010. The Essential Guide to Effect Sizes: Statistical Power, Meta-Analysis, and the Interpretation of Research Results. New York: Cambridge University Press.
- Fisher, Peter, and David Unwin. 2001. Virtual Reality in Geography. London: CRC Press.
- Freund, Richard D., John W. Brelsford Jr., and Richard C. Atkinson. 1969. “Recognition vs. Recall: Storage or Retrieval Differences?” The Quarterly Journal of Experimental Psychology 21 (3): 214–224. doi: 10.1080/14640746908400216
- Garlandini, Simone, and Sara Irina Fabrikant. 2009. “Evaluating the Effectiveness and Efficiency of Visual Variables for Geographic Information Visualization.” In International Conference on Spatial Information Theory, 195–211. Berlin: Springer.
- Gillner, Sabine, and Hanspeter A. Mallot. 1998. “Navigation and Acquisition of Spatial Knowledge in a Virtual Maze.” Journal of Cognitive Neuroscience 10 (4): 445–463. doi:10.1162/089892998562861.
- Gore, Al. 1998. “The Digital Earth: Understanding Our Planet in the 21st Century.” Australian Surveyor 43 (2): 89–91. doi:10.1080/00050348.1998.10558728.
- Hegarty, Mary, Matt S. Canham, and Sara I. Fabrikant. 2010. “Thinking About the Weather: How Display Salience and Knowledge Affect Performance in a Graphic Inference Task.” Journal of Experimental Psychology. Learning, Memory, and Cognition 36 (1): 37–53. doi:10.1037/a0017683.
- Hegarty, Mary, Harvey S. Smallman, and Andrew T. Stull. 2012. “Choosing and Using Geospatial Displays : Effects of Design on Performance and Metacognition.” Journal of Experimental Psychology: Applied 18 (1): 1–17.
- Hegarty, Mary, Harvey S. Smallman, Andrew T. Stull, and Matt S. Canham. 2009. “Naïve Cartography: How Intuitions About Display Configuration Can Hurt Performance.” Cartographica: The International Journal for Geographic Information and Geovisualization 44 (3): 171–186. doi:10.3138/carto.44.3.171.
- Hegarty, Mary, and David Waller. 2004. “A Dissociation Between Mental Rotation and Perspective-taking Spatial Abilities.” Intelligence 32 (2): 175–191. doi:10.1016/j.intell.2003.12.001.
- Huk, Thomas. 2006. “Who Benefits from Learning with 3D Models? The Case of Spatial Ability.” Journal of Computer Assisted Learning 22 (6): 392–404. doi:10.1111/j.1365-2729.2006.00180.x.
- Itti, Laurent, Christof Koch, and Ernst Niebur. 1998. “A Model of Saliency-based Visual Attention for Rapid Scene Analysis.” IEEE Transactions on Pattern Analysis and Machine Intelligence 20 (11): 1254–1259. doi:10.1109/34.730558.
- Kattenbeck, Markus. 2015. “Empirically Measuring Salience of Objects for Use in Pedestrian Navigation.” In Proceedings of the 23rd SIGSPATIAL International Conference on Advances in Geographic Information Systems. Seattle, WA: ACM.
- Klauer, Karl Christoph, and Zengmei Zhao. 2004. “Double Dissociations in Visual and Spatial Short-Term Memory.” Journal of Experimental Psychology: General 133 (3): 355–381. doi:10.1037/0096-3445.133.3.355.
- Klippel, Alexander, and Stephan Winter. 2005. “Structural Salience of Landmarks for Route Directions.” In International Conference on Spatial Information Theory, 347–362. Berlin: Springer.
- Liao, Hua, Weihua Dong, Chen Peng, and Huiping Liu. 2016. “Exploring Differences of Visual Attention in Pedestrian Navigation When Using 2D Maps and 3D Geo-browsers.” Cartography and Geographic Information Science 0 (0): 1–17. doi:10.1080/15230406.2016.1174886.
- Lobben, Amy K. 2004. “Tasks, Strategies, and Cognitive Processes Associated with Navigational Map Reading: A Review Perspective.” The Professional Geographer 56 (2): 270–281.
- Lokka, Ismini, and Arzu Çöltekin. 2016. “Simulating Navigation with Virtual 3D Geovisualizations – A Focus on Memory Related Factors.” International Archives of the Photogrammetry, Remote Sensing and Spatial Information Sciences – ISPRS Archives 41: 671–673. doi: 10.5194/isprsarchives-XLI-B2-671-2016
- Lokka, Ismini E., and Arzu Çöltekin. 2017. “Remembering What We See : Designing Virtual Environments to Improve Visuo-spatial Recall for Navigation Tasks.” In Proceedings of the 27th International Cartographic Conference, 387–392. Prague: ISPRS. http://www.int-arch-photogramm-remote-sens-spatial-inf-sci.net/XLI-B2/387/2016/.
- Loomis, Jack M., and James J. Blascovich. 1999. “Immersive Virtual Environment Technology as a Basic Research Tool in Psychology.” Behavior Research Methods, Instruments, & Computers 31 (4): 557–564. doi:10.3758/BF03200735.
- Luck, Steven J., and A. Hollingworth. 2008. Visual Memory. New York, NY: Oxford University Press.
- Lynch, Kevin. 1960. The Image of the City. Vol. 11. Cambridge, MA: MIT Press.
- MacEachren, Alan M., Robert Edsall, Daniel Haug, Ryan Baxter, George Otto, Raymon Masters, Sven Fuhrmann, and Liujian Qian. 1999. “Virtual Environments for Geographic Visualization: Potential and Challenges.” In Proceedings of the 1999 Workshop on New Paradigms in Information Visualization and Manipulation in Conjunction with the Eighth ACM Internation Conference on Information and Knowledge Management, 35–40. Kansas City, MO: ACM.
- MacEachren, Alan M., and Menno-Jan Kraak. 2001. “Research Challenges in Geovisualization.” Cartography and Geographic Information Science 28 (1): 3–12. doi:10.1559/152304001782173970.
- Mayer, Richard E., and Roxana Moreno. 2003. “Nine Ways to Reduce Cognitive Load in Multimedia Learning.” Educational Psychologist 38 (1): 43–52. doi:10.1207/S15326985EP3801_6.
- McMahan, A. 2003. “Immersion, Engagement, and Presence.” The Video Game Theory Reader 67: 86.
- Meijer, Frank, Branko L. Geudeke, and Egon L. van den Broek. 2009. “Navigating Through Virtual Environments: Visual Realism Improves Spatial Cognition.” Cyberpsychology & Behavior 12 (5): 517–521. doi:10.1089/cpb.2009.0053.
- Miller, George A. 1956. “The Magical Number Seven, Plus or Minus Two: Some Limits on Our Capacity for Processing Information.” Psychological Review 63 (2): 81–97. doi:10.1037/h0043158.
- Montello, Daniel R., David Waller, Mary Hegarty, and Richardson E. Anthony. 2004. “Spatial Memory of Real Environments, Virtual Environments, and Maps.” In Human Spatial Memory: Remembering Where, edited by G. L. Allen and D. Haun, 251–285. Mahwah, NJ: Lawrence Erlbaum Associates.
- Park, Denise C., Gary Lautenschlager, Trey Hedden, Natalie S. Davidson, Anderson D. Smith, and Pamela K. Smith. 2002. “Models of Visuospatial and Verbal Memory Across the Adult Life Span.” Psychology and Aging 17 (2): 299–320. doi:10.1037/0882-7974.17.2.299.
- Parush, Avi, and Dafna Berman. 2004. “Navigation and Orientation in 3D User Interfaces: The Impact of Navigation Aids and Landmarks.” International Journal of Human–Computer Studies 61 (3): 375–395. doi:10.1016/j.ijhcs.2003.12.018.
- Peters, Stefan, Mathias Jahnke, Christian E Murphy, Liqiu Meng, and Alias Abdul-Rahman. 2017. “Cartographic Enrichment of 3D City Models – State of the Art and Research Perspectives.” In Advances in 3D Geoinformation, 207–230. Cham: Springer International.
- Peterson, Lloyd, and Margaret Jean Peterson. 1959. “Short-Term Retention of Individual Verbal Items.” Journal of Experimental Psychology 58 (3): 193–198. doi:10.1037/h0049234.
- Plesa, Malisa Ana, and William Cartwright. 2008. “Evaluating the Effectiveness of Non-Realistic 3D Maps for Navigation with Mobile Devices.” In Map-based Mobile Services, edited by L. Meng, A. Zipf, and S. Winter, 80–104. Berlin: Springer.
- Raubal, Martin, and Stephan Winter. 2002. “Enriching Wayfinding Instructions with Local Landmarks.” Proceedings of the Second International Conference on Geographic Information Science 2478 (1): 243–259. doi: 10.1007/3-540-45799-2_17
- Richter, Kai-Florian, and Stephan Winter. 2014. Landmarks. Cham: Springer.
- Röser, Florian, Kai Hamburger, Antje Krumnack, and Markus Knauff. 2012. “The Structural Salience of Landmarks: Results from an On-line Study and a Virtual Environment Experiment.” Journal of Spatial Science 57 (1): 37–50. doi:10.1080/14498596.2012.686362.
- Roth, Robert E., Arzu Coltekin, Luciene Delazari, Homero Fonseca Filho, Amy Griffin, Andreas Hall, Jari Korpi, et al. 2017. “User Studies in Cartography : Opportunities for Empirical Research on Interactive Maps and Visualizations.” International Journal of Cartography, 1–29. doi:10.1080/23729333.2017.1288534.
- Salthouse, Timothy A. 2006. Theoretical Perspectives on Cognitive Aging. Hillsdale, NJ: Psychology Press.
- Sanchez, Christopher A., and Russell J. Branaghan. 2009. “The Interaction of Map Resolution and Spatial Abilities on Map Learning.” International Journal of Human Computer Studies 67 (5): 475–481. doi:10.1016/j.ijhcs.2008.12.003.
- Scheiter, Katharina, Peter Gerjets, Thomas Huk, Birgit Imhof, and Yvonne Kammerer. 2009. “The Effects of Realism in Learning with Dynamic Visualizations.” Learning and Instruction 19 (6): 481–494. doi:10.1016/j.learninstruc.2008.08.001.
- Schinazi, Victor R., Daniele Nardi, Nora S. Newcombe, Thomas F. Shipley, and Russell A. Epstein. 2013. “Hippocampal Size Predicts Rapid Learning of a Cognitive Map in Humans.” Hippocampus 23 (6): 515–528. doi:10.1002/hipo.22111.
- Semmo, Amir, Matthias Trapp, Jan Eric Kyprianidis, and Jürgen Döllner. 2012. “Interactive Visualization of Generalized Virtual 3D City Models Using Level-of-abstraction Transitions.” Eurographics Conference on Visualization 31: 885–894.
- Slocum, Terry A., Connie Blok, Bin Jiang, Alexandra Koussoulakou, Daniel R. Montello, Sven Fuhrmann, and Nicholas R. Hedley. 2001. “Cognitive and Usability Issues in Geovisualization.” Cartography and Geographic Information Science 28 (1): 61–75. doi:10.1559/152304001782173998.
- Smallman, Harvey S., and Maia B. Cook. 2011. “Naive Realism: Folk Fallacies in the Design and Use of Visual Displays.” Topics in Cognitive Science 3 (3): 579–608. doi:10.1111/j.1756-8765.2010.01114.x.
- Smallman, Harvey S., and Mark S. John. 2005. “Naïve Realism: Limits of Realism as a Display Principle.” Proceedings of the Human Factors and Ergonomics Society Annual Meeting 49 (17): 1564–1568. doi:10.1177/154193120504901714.
- Sutherland, Ivan E. 1965. “The Ultimate Display.” In Multimedia: From Wagner to Virtual, edited by R. Packer and K. Jordan, 252–256. New York, NY: W.W. Norton & Company.
- Vandenberg, Steven G., and Allan R. Kuse. 1978. “Mental Rotations, a Group Test of Three-dimensional Spatial Visualization.” Perceptual and Motor Skills 47 (2): 599–604. doi:10.2466/pms.1978.47.2.599.
- Wilkening, Jan, and Sara Irina Fabrikant. 2011. “How Do Decision Time and Realism Affect Map-Based Decision Making?” In International Conference on Spatial Information Theory, 1–19. Berlin: Springer.
- Wolbers, Thomas, and Mary Hegarty. 2010. “What Determines Our Navigational Abilities?” Trends in Cognitive Sciences 14 (3): 138–146. doi: 10.1016/j.tics.2010.01.001