
ABSTRACT
Geohazard research requires extensive spatiotemporal understanding based on an adequate multi-scale representation of modelling results. The most commonly applied representation basis for collected data is still the one of a 2D plane, typically a map. Digital maps of spatial data can be visualised and processed by using Geographic Information Systems. It is far less common to use 3D geomodels for the analysis and visualisation of spatial data. For the visualisation of both spatial and temporal hazard components, there are no standardised tools. We claim that a full geohazard assessment is only possible inside a new type of geoscientific and technological environment that is at the same time multi-dimensional, spatiotemporal, integrated, fully interactive (tele-)immersive, and collaborative. Surface and subsurface processes are interacting at various scales that are difficult to be overviewed at once. Virtual Reality (VR) technology could provide an attractive solution to overcome the multi-dimensional and spatiotemporal obstacles. The review of geoscientific applications using VR technology developed by multiple teams around the world shows that some solutions have already been developed many years ago, but widespread use was not possible. This is clearly changing now and soon we will see if VR can contribute to a better understanding of geo-processes.
1. Introduction
Among all geosciences, geohazard research is probably the one that presents the highest challenge with respect to spatiotemporal perception requirements. According to Andrienko et al. (Citation2010) ‘everyone is a spatiotemporal analyst’ and this is particularly true for geohazard scientists. Geological hazards can involve highly dynamic processes, such as rock failure, wave propagation, or eruptions, changing groundwater pressures, extremely slow creep, shearing, subsidence, or uplift movements, which occur at micro-scale or affect large portions of the Earth, entire tectonic plates.
While exploring related hazards within a combined model is still well beyond state-of-the-art, recent technological and conceptual advances should help reach this goal in near future. As stated by Lin et al. (Citation2015) by citing Goodchild (Citation2009, Citation2010) ‘an important research priority in geographic analysis has emerged as researchers shift from identifying static snapshots to exploring dynamic phenomena.’ At present, most single hazard components can be assessed – at least empirically – and many underlying processes can also be reliably simulated and some can be coupled, but representing them in an adequate multi-scale space–time frame is limited by existing modelling capabilities. Below, we provide a general overview of what is possible today in geohazard analysis. It should be noticed that many of those tools were actually designed for other purposes related to geography-geomorphology, construction, geotechnical engineering, or mining. The geohazard scientist just adopted them for his applications. The most commonly applied representation basis for collected data is still the one of a 2D plane – typically a map if the Earth surface is the main target or a cross-section if elements have to be shown over various depths. Digital maps can be visualised and processed by using Geographic Information Systems (GIS). A series of elements can be added to these maps. Each type of overlaid elements forms a ‘layer.’ The number of superposable layers is not limited. Cross-sections cannot be represented by the same mapping tools. 2D data varying over depth and modelling results obtained for cross-sections can be directly visualised by the simulation software. A series of numerical modelling tools also handle 3D data distributions, generally with limited extent. Both, the GIS and the modelling software can also propose 3D views of the respective 2D targets, or of 3D in- and outputs if implemented in the modelling software. From the preceding it could be understood that the main difference between GIS and numerical modelling software is the orientation of the plane on which geographic-geological elements are represented. Actually, the main difference relies in the type of analysis performed with those tools as well as in the temporal component. Usual GIS software only allows for statistical analyses applied to data which include limited discrete, if any, time information (e.g. seismic hazard maps for different return periods, multi-temporal landslide inventories, or volcanic eruption maps). Numerical simulation tools can produce quasi continuous time-dependent outputs (using a time-step adapted to the type of process analysed) for sections or 3D models. However, those outputs are generally strongly limited in time and space (due to limited available computation or storage capacities and/or due to limited data availability).
As GIS data generally only contain spatial (possibly with limited discrete temporal) components, they can cover much wider areas than the modelling in- and outputs. The highly changing spatial scales of maps and models to be represented is one of the reasons why most handling software are unable to visualise and process the ‘other’ type of data and outputs with the adapted spatial/temporal resolution/extent (e.g. GIS cannot efficiently show data over varying depths, whereas modelling software generally does not include mapping tools). A compromise is proposed by a third type of modelling techniques that can be grouped together under the general term of 3D visualisation tools or, more specifically, of 3D geomodellers. This software can represent in the same time large maps and much smaller cross-sections or 3D numerical models representing simulation outputs. The geological modelling (or simply geomodelling) software is generally not used to create the data, but it helps representing in- and outputs in the 3D space. In addition, this software allows for some pre-processing of information needed for the numerical models and for the development of 3D volumes on the basis of points, lines or surface data distributed within a 3D space. As volumes are the core part of 3D geomodels, geomodelling tools must be able to visualise efficiently the 3D space. Therefore, their 3D visualisation capabilities generally exceed by far those of GIS or original numerical modelling tools. Geomodels also allow for 3D spatial and temporal analyses (if the required data are included in the model). Some workflows related to local geohazard studies involving also geomodels are presented in Section 4 (case studies).
Geomodels are only used by a limited number of geoscientists (typically geo-engineers), first, because geomodelling is time-consuming and, second, because the software is relative expensive for most applications, while probably all (or almost all) geoscientists, including geohazard experts, use the freely available Google Earth® (GE) software. This software provides some pseudo-3D view that is much more efficient than the one proposed by common GIS tools but it does not really exceed the basic capabilities of the latter as all elements are distributed over or above the Earth surface – just as in the GIS maps. Additionally, cross-sections can be visualised in GE (or at least in the extended version Google Earth Pro®), but only above the Earth surface – not at their original location at depth. Spatiotemporal or even simple spatial analyses are not possible in GE. The success of GE is therefore not related to its analytical capabilities but to the simple use, the representation of data on a pseudo-3D globe with a textured surface (representing remote imagery), and, as indicated above, to the very effective visualisation of the Earth Surface at various scales.
This overview finally might suggest that we already possess the ‘ideal’ software system combining GIS, numerical and geological modelling tools supplemented by GE, which covers all aspects of what is required to complete spatiotemporal geohazard analyses. So, what is left?
2. The concept of the 4D geospace
To better understand the requirements of geohazard research and how a 4D geospace could help assess geohazards better, we first provide a kind of definition of geohazard assessment and a description of the 4D geospace that is more than a concept.
Geohazard assessment involves the collection of information about the possible sources of geological hazards (e.g. active faults, volcanic structures, ground morphology) for a site or a region as well as their integration within a model that can be used for simulations of dynamic geological processes. Additionally, some calculations have to be performed allowing us to estimate the probability of occurrence in time and space of those potentially hazardous processes. The 4D geospace that we started to develop is supposed to integrate multiple information about geohazard sources and related models as well as the simulation and probabilistic calculation results, thus establishing closer links between modelling inputs and outputs, which can be better controlled. The 4D geospace is a virtual environment based on a combination of numerical calculation and data visualisation tools. Typically, input data processing and simulations are run outside the visualisation environment – as real-time processing and simulations require long computation times. Most singular tools to do this research exist but, at present, they are only weakly integrated. Extensive ad hoc processing is necessary. Multi-scale views need to be prepared successively. Incompatibilities of data in- and outputs are often observed by changing the software; some outputs can only partly be read by the post-processing or visualisation tools. And, if it turns out that some calculations have to be redone, often the whole in- and outputs need to be re-integrated after re-processing.
The important spatiotemporal dimension of geohazard research has also been introduced above. Several authors tried to provide solutions to simultaneously represent data in time and space (Li and Kraak Citation2008; Bach et al. Citation2014) such as the space–time cube which can be considered as a conceptual representation of data that contain both spatial and temporal information. As Bach et al. (Citation2014) states, ‘the space–time cube does not necessarily have to appear explicitly in the final visualisation nor does it need to be implemented in the system used to generate this visualisation.’ On the one hand, the multiple and very flexible definition of the space–time cube, considering it more as a concept rather than as a real ‘projection space’ makes it also applicable to geohazard research; on the other hand, we believe that this concept is too loose to really be able to improve geohazard engineering (beyond the present state-of-the-art). Also, we do not know any application of this concept in this field.
The interactive aspect is probably the best developed component in existing GIS and geomodelling tools (including GE), which highly facilitates working with spatial data – while numerical modelling software only recently included wider user-data interaction possibilities. Certainly, some improvements could still be done to enhance interaction with data, but as this is more a technical rather than a conceptual or scientific issue, we prefer focusing on the two final aspects of the 4D geospace: (tele-) immersion and collaboration.
We are certainly not the first to highlight these presently missing or underdeveloped components in geo-research. Almost 20 years ago, Lascara et al. (Citation1999) have proposed that ‘scientists, educators, students and managers must have the ability to collaboratively view, analyse and interact with the data in a way that is understandable, repeatable and intuitive.’ Also, the idea of a 4D geospace that we develop here has already been proposed and even tested more than 15 years ago (MacEachren, Brewer, and Steiner Citation2001). However, at that time software were generally not capable of creating an exhaustive 4D geospace.
One of the longest lasting systematically improved systems targeting multi-dimensional dynamic geographic analysis, enhanced collaboration between geoscientists and interaction with elements to be analysed is the ‘Virtual Geographic Environment’ (VGE, see Lin, Chen, and Lu Citation2013; Lin et al. Citation2013). The VGE concept has been developed over many years in order to enhance collaboration between geoscientists using the same or similar data sets. Yet, in real life we note that integrated collaboration is still extremely underdeveloped, also as relatively few geoscientists contribute to the development of such virtual environments that should allow for a more fluid data flow and sharing of results. This way of inefficient collaboration in most geo-institutes is surprising if one considers that a few ‘collaborative virtual environments (CVEs)’ or ‘collaboratories’ have already been set up many years ago (MacEachren, Brewer, and Steiner Citation2001, Citation2006; Lin et al. Citation2013). Their approach to collaborative visualisation and analysis of geodata combines mapping elements, cognitive aspects, interaction, cooperative work and semiotics. They had started ‘to address the full range of space–time collaborative situations that can involve group work in the same or different places and at the same or different times.’ MacEachren, Brewer, and Steiner (Citation2001) also refer to the ‘perhaps best-tested collaborative system mediated by visual displays … of that time,’ the Upper Atmospheric Research Collaboratory/Space Physics and Aeronomy Research Collaboratory project by Olson and Olson (Citation2000). MacEachren, Brewer, and Steiner (Citation2001) explain that ‘the collaboratory allows users to organise their data streams into hundreds of individualised displays – 3D visual renderings and virtual reality rooms – that are then shared (both synchronously and asynchronously) with other collaborators.’ More recently Jurik et al. (Citation2016) developed the idea of the virtual worlds (VWs) providing the ‘possibility to dynamically modify content and multi-user cooperation when solving tasks regardless to physical presence. They can be used for sharing and elaborating information via virtual images or avatars.’
Manifold applications of CVEs are listed by Xu et al. (Citation2011). CVEs can support geographic research and education, help simulate student fieldworks and urban planning; CVEs can also provide platforms for training and decision-making related to emergency actions (Sharma et al. Citation2017).
Former versions of those VGEs did not specifically involve immersive visualisation. Therefore, we think that the former opinion considering ‘VR technology as a solution in search of a problem’ (Machover and Tice Citation1994) is probably not true anymore. Virtual reality (VR) is nowadays used in many scientific disciplines, also in medicine, yet, its applications in geosciences and specifically in geohazard research are rare – probably because VR technology requires extensive computer skills and has once been prohibitively expensive. Until recently most geoscientists (not working for resource exploitation industries) could simply not afford using VR tools. Though, Kellogg et al. (Citation2008) clearly state that ‘an immersive visualisation system is ideal for Earth scientists’ as it allows them to better approach the complex multi-scale geo-processes that often change rapidly in time and space. Their main argument in favour of an immersive geo-visualisation is that it
allows scientists to use their full visual capacity, helping them to identify previously unrecognized processes and interactions in complex systems. … Reaping the full intellectual benefits of immersive VR as a tool for scientific analysis requires building on the method’s strengths, that is, using both 3D perception and interaction with observed or simulated data. (Kellogg et al. Citation2008)
Notwithstanding the obvious potential benefits of VGEs in geohazard research we only know very few applications in this geoscientific field (one by Zhu et al. Citation2016, is presented below). On the one hand, the applications presented do not generally include the dynamic components that are so important in geohazard research (even though they should, according to the conceptual basis defined by Lin et al. Citation2013). So, we are not sure that they would fully fit geohazard research requirements. On the other hand, recently developed systems have implemented the formerly expensive technology of immersive visualisation that has previously been considered as pure luxury by geohazard engineers. Now, the relatively low price of VR technology (compared to the situation before the massive release of affordable mobile systems; see paragraph below) allows most geoscientists to really use the advantages of 3D perception and interaction – also in geohazard engineering. In particular, it will ‘allow users to explore inaccessible past or future environments or distant present environments, not only through their static objects but through processes that mirror their real dynamics’ (Lin et al. Citation2015).
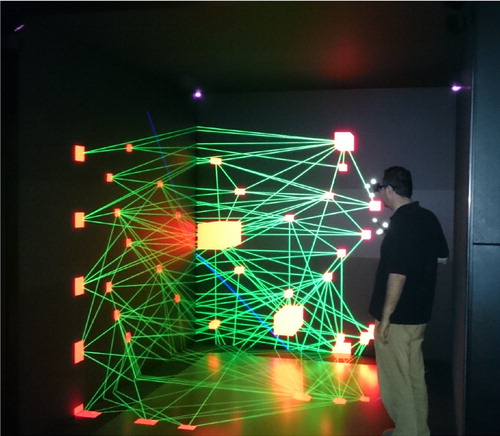
The described use of VR to visualise ‘geographic’ (or any ‘geo’) space–time environments is complemented by a series of (far-less-frequent) applications in (also non-geographic) information visualisation. Garcia-Hernandez et al. (Citation2016) state that 3D visualisation can provide more insight about multi-variable data analysis. They list some applications in the field of aerospace (one example shown in ), which could be easily extended to other scientific disciplines, including geosciences. In order to take into account the use of VR in data–graph visualisation, we initially used the more general term ‘multi-dimensional’ rather than ‘multi-scale’ (which would suggest purely ‘geographic’ scales).
Figure 1. Non planar graph displayed on a CAVE allowing for immersive visualisation of data (from Garcia-Hernandez et al. Citation2016).Note: CAVE, computer aided virtual environment.
3. Technological aspects
The aforementioned widespread availability and affordability of VR hardware enables new applications in many fields. In geosciences, those applications range from visualisations of crystal structures to the representation of the entire globe; for spatial sciences, the virtual environments could be extended to the solar or other planetary systems. Such environments require multi-scale visualisation platforms bridging several orders of magnitude in space (and, possibly, also in time).
In parallel with its improved availability, the installation and use of the VR hardware and software has also been simplified over the past decade. Nowadays game engines such as Unity (by Creighton Citation2010) or Unreal (by Sanders Citation2016) can freely be used for non-commercial purposes. Although their use remains complex, their present degree of integration and documentation make this technology much more accessible than it has been in the past. This has been developed in such a way that programming skills are not required any more for certain smaller projects.
Thanks to these tools also users without prior coding experience are now able to create and assemble visualisations. Most of these software components have already integrated the new VR hardware. Thus, the challenge related to the use of VR in science and technology has now shifted from the question of how we can use VR technology to visualise scientific targets to the one of how we can interact with them in VR, collaboratively!
Using modern game engines, the visualisation developer becomes responsible for providing insightful, comprehensive visualisation solutions to represent the often very complex and varied data sets. However, several rules have to be respected when visualising your contents in VR. The scene must be designed in such a way that it allows the user to move through rather than around, and this it within the limits of the tracking space within which the viewer has to use the (motion-) controllers input to specify where he or she wants to go. So the developer has to come up with an intuitive way of implementing a mechanic that changes the viewers’ location without triggering motion sickness. Sending contradictory signals to the viewers’ brain should be kept as low as possible. For instance, a simple translation animation is already conflicting because the sense of vision is sending motion signals to the brain while the labial arcs of the inner ear are telling the brain that it’s stationary. Furthermore, instantaneous teleportation can completely destroy the mind map that a viewer builds up in a virtual scene. Therefore, on the one hand, for virtual environments that are bigger than the viewer (e.g. landscapes and geological models as shown in ) we chose to implement a simple fly through where the viewer points a motion controller towards the place where he wants to move to. On the other hand, for smaller objects that have to be largely increased in size to be adapted to the room space, such as crystal structures (see ), we use direct object manipulation and natural movement for interaction and navigation.
To represent the landscape in geomodels we use the (possibly textured) digital elevation model (DEM) surface. The entire geomodel also includes subsurface geological and seismotectonic information (e.g. geological cross-sections, fault structures, earthquake hypocentres), and geophysical profiles (e.g. seismic or electrical tomography, various logs) that have generally been processed by adapted software (see Cerfontaine, Mreyen, and Havenith Citation2016, for more detail). Most of those data also require georeferencing with a 3D geomodelling software before being imported in the virtual scene. The basic data for georeferencing are generally provided by geodetic measurements completed in connection with the field surveys.
It should be noted that geological modelling will probably become available in VR as similar solutions already exist for various applications such as Google Tilt Brush and the Unreal Engine.
4. Case histories and studies involving VR-supported visualisation
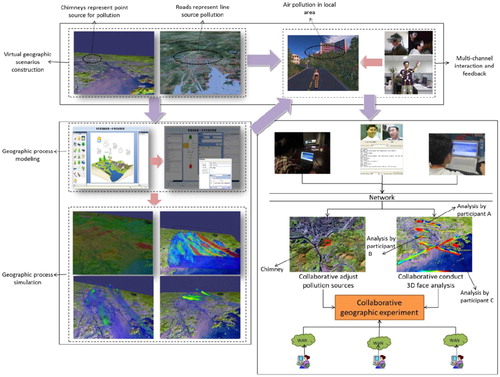
In the introduction we indicated that applications of VR in geosciences are likely to be the most useful where 4D spatiotemporal analyses are required for research – which makes geohazard assessment a prime target for VR applications as spatial and temporal components are equally important for related research (other geoscientific disciplines are typically either more ‘spatial’ or ‘temporal’; for instance ‘time’ is the predominant element in the field of palaeontology whereas for structural geology spatial aspects are far more important). The use of VR can be extended to other domains to visualise any information in a 3–4D environment (including non-geographic data as shown, in ). However, here, we will focus on the potential use of VR to visualise 3D geodata, possibly varying in time. A complex system of data visualisation and analysis of air pollution data within a VGE is presented by Lin et al. (Citation2013, see ). This type of use of VR technology does, however, not explicitly refer to the need for full (tele-) immersion and seems to be essentially based on visualisation with a desktop/screen.
Figure 2. Application of VGE to air pollution analysis (Lin et al. Citation2013).
A well-known immersive environment used for geodata (including geohazard-related information) visualisation and analysis is located in UC Davis: the KeckCAVES (Kellogg et al. Citation2008). An application of the KeckCAVES to geohazard studies is presented in Cowgill et al. (Citation2012) through the description of a post-disaster virtual field trip in Haiti that could highlight key seismotectonic elements related to the 2010 earthquake.
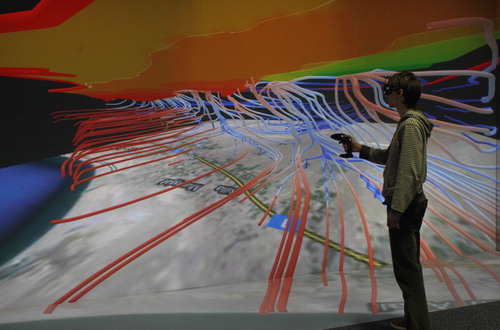
In Europe, the British Geological Survey is one of the main organisations making widespread use of VR technology for applied research and education in the field of geosciences (see e.g. http://www.bgs.ac.uk/research/environmentalModelling/3dVisualisation.html). Other groups include the TESSIN VISLab (Helmoltz Centre of Environmental Research, Leibzig, Germany), a VR laboratory using both a back projection-based system as well as head-mounted devices where geodata are analysed in an immersive virtual environment. Multiple examples of 3D stereo-visualisation of climatic, geological and hydrogeological data are presented by Bilke et al. (Citation2014); one application related to a hydrogeological study is presented in .
Figure 3. Analysis of groundwater flow patterns in combination with groundwater surface drawdown due to pumping activities for determining subsurface water vulnerabilities utilising the stereoscopic mode of the VISLab (modified from Bilke et al. Citation2014).
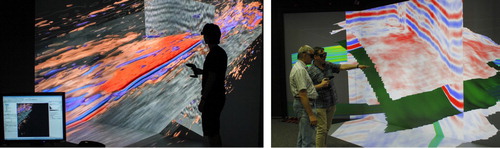
Bilke et al. (Citation2014) also highlight the particular use of immersive visualisation to better analyse 3D geophysical data (see examples in ).
Figure 4. Left and right: analysis of seismic data in an immersive 3D environment (modified from Bilke et al. Citation2014).
Finally, we present some applications of VR to natural hazard analyses, including a few examples of virtual geohazard environments created by our group.
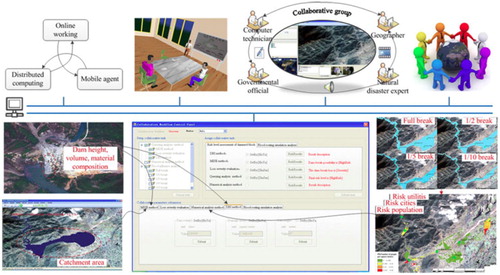
The case study is related to a dam break risk analysis presented by Zhu et al. (Citation2016) who performed this assessment using a VGE (workflow and output examples are shown in ). They highlight another advantage of today’s collaborative VGEs, i.e. the fact that cloud computing can be implemented in those systems to improve distribution and execution of investigated models ‘so that multidisciplinary experts can focus on analysis tasks rather than on the integration and deployment of models in the computing environment.’ However, in their paper they do not specifically refer to the use of any immersive visualisation despite the fact that VR technology should be an integrated part of collaborative/distributed VGEs ().
Figure 5. Workflow of dam break risk assessment completed within a collaborative VGE (from Zhu et al. Citation2016).
Second, Ondercin (Citation2016) explored the potential of game engines to simulate rock falls within a virtual environment. The author outlines a particular interest of real-time simulations enabled by game engines, which is related to the fact that
aside from the application of mobile approaches in the field, like the use of tablets and smartphones, there is also the possibility of integrating technologies like augmented reality (AR) and virtual reality (VR) into the model. This would permit features such as subsurface mapping data or rockfall modelling results to be visualised on top of the slope in a fully interactive and visual environment more familiar to a geologist or geological engineer.
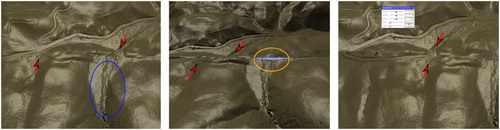
The third example presents some advancements based on a novel terrain deformation algorithm developed by Westerteiger (Citation2014) to improve 3D terrain visualisation and allow for interactive modification of the terrain model. In particular, Westerteiger (Citation2014) demonstrates that the developed tools combined with VR technology enable a ‘more informed interpretation of fault reconstruction hypotheses’ (see example in ).
Figure 6. Interactive reconstruction of initial model (right part) before (multiple) fault rupture, starting with the present model to the left and an intermediate model in the middle (from Westerteiger, Citation2014).
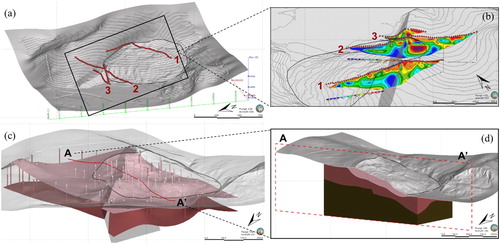
Most of our local geohazard-related studies now also include the preparation of data for visualisation in VR. This preparation follows the scheme described above, based on the creation/adaptation of a surface model (DEM), possibly textured with remote imagery, introduction of geophysical-geological profiles, logs, interpolated underground surfaces (e.g. geological layers, faults), and volumes. Typically, point data, logs, surfaces, and volumes are first processed in a geomodelling software. The example shown in presents a landslide site along the seismically active Hockai Fault Zone (HFZ) in East Belgium. An integrated 3D geomodel made with Leapfrog® visualises the study site in terms of its surface and subsurface structures on the basis of the collected data. The inputs of this model include the DEM based on high-resolution light detection and ranging (LiDAR) surface data (possibly textured by georeferenced orthorectified remote imagery), subsurface geophysical data: microseismic ambient noise measurements (H/V – see logs in (c)), seismic refraction (P-waves) tomography and surface wave analysis results (not shown here), as well as electrical resistivity tomography (ERT, shown in (b)). The landslide developed in a softer conglomerate unit (upper part in reddish-brownish layer shown in (c,d) that could be outlined through its seismic resonance characteristics (H/V results). For the interpretation of related complex inputs (high-resolution terrain and subsurface data, geophysical profiles) and outputs (modelled surfaces and volumes), we use 3D stereo-visualisation using a headset system allowing for full immersion in a virtual environment.
Figure 7. 3D geomodel of a landslide (grey polygon in all figures) and fault scarp site in East Belgium (created with the Leapfrog® software) showing: (a) view to the SE of the shaded LiDAR DEM with location of ERT profile lines (ERT n°3 crosses the fault scarp, ERT n°1 is in the central upper part of the landslide); (b) view to the NE of semi-transparent DEM with ERT profiles across landslide (front) and fault scarp (behind); fault at depth is shaded in grey; (c) view to SE of modelled DEM and subsurface layers, inferred from H/V thickness estimates (colons); (d) view to SE of combined shaded DEM and subsurface layer volumes cut along section AA’ also shown in (c).
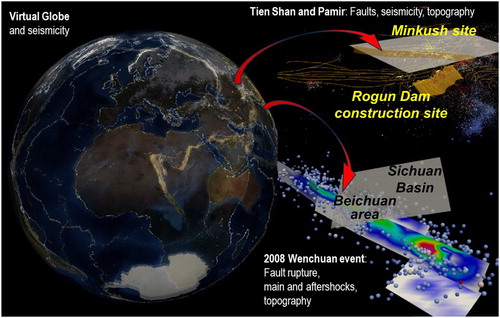
For the seismically active Tien Shan Mountains in Central Asia we had created a full GIS geohazard database (Havenith et al. Citation2015) that we have now transformed into a 3D geodatabase. A general view presenting surface model, earthquake, fault and landslide data is shown in the upper right part of . Similar views (see example in lower right part of ) were also created for the Wenchuan Earthquake region, using fault geometry and rupture mechanics data from the open KAUST Repository (http://repository.kaust.edu.sa/kaust/) as well as the earthquake catalogue including the main shock (red sphere) and about 400 aftershocks (bluish and white spheres). It is planned now to combine all separate 3D geodatabases in one single ‘Virtual Globe.’ The general Earth geometry using low-resolution surface data as well as the worldwide United States Geological Survey catalogue (here for M > 4.5, 1900–December 2016) have already been implemented in this ‘Virtual Globe’ (see left part of ). However, detailed regional data have not yet been combined in this globe model due to limitations related to data storage and simultaneous visualisation.
Figure 8. Left part: ‘Virtual Globe’ with implemented low-resolution surface data and recent seismicity (light dots representing M >4.5 events between 1900 and December 2016). Upper right part: regional view of the 3D Tien Shan geohazard database, made with Paraview®, showing the surface (grey-shaded DEM with resolution of 500 m), and two major seismically active fault surfaces (grey-shaded), all known major fault lines (lines), mapped landslides (dots) and earthquake hypocentres coloured according to depth (from 10 km up to more than 100 km depth). Approximate location of Rogun Dam construction site and Minkush site shown (detailed models presented below). Lower right part: view to the East of Longmenshan fault system (from KAUST Repository) activated during the 2008 Wenchuan earthquake, with main shock (dark sphere in lower right part) and about 400 aftershocks (changing size according to increasing magnitude), with part of grey-shaded SRTM 100 m DEM of the region.
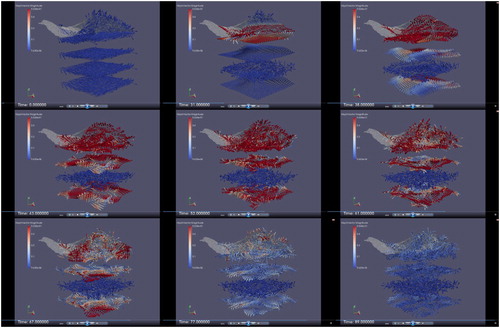
For smaller sub-areas inside the Tien Shan region, and sites of particular interest (two are marked in the upper right part of ) we also developed detailed 3D models, generally as basis for dynamic slope stability calculations or local seismic hazard analyses. Related 3D geodata visualisation examples include the results of a survey completed near the Rogun Dam construction site in Tajikistan ( and ). For this site also simulations of rock falls were completed in 2D with the Universal Distinct Element Code (UDEC, ITASCA) software. Final results are included as section in the virtual model (see (d)). For a few sites, including the one of Minkush in Kyrgyzstan, we developed 3D dynamic models (computed with Flac3D, ITASCA) with animations of seismic wave propagation that can be represented in VR as multiple views of coloured seismic wave amplitudes on the surface and at various depths, for successive time steps (in ).
Figure 9. 3D geomodels and numerical simulation results for slopes investigated near the Rogun Dam construction site in Tajikistan. (a) General view of geomodel with textured surface (using Pleiades images) and simplified Rogun Dam model. (b) Surface represented by contour lines allowing for viewing subsurface elements of 3D geomodel, including geological sections (large), modelling section (large), geophysical profiles (small), approximate location of Ionakhsh Fault (see location). (c) Modelling section showing rock falls simulated with UDEC for M∼6.7–6.9 scenario earthquake near site. (d) Simulation results shown in virtual environment.
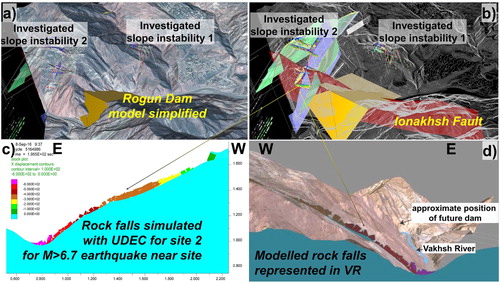
Figure 10. Rogun site in VR. (a) Researcher visiting the site in VR. (b) General semi-transparent surface view showing subsurface profiles. (c) Illuminating collected subsurface data near the Rogun site inside the virtual environment. (d) Visualisation of geophysical (SRT) profile edited (placed at correct location) in VR (modified from Cerfontaine, Mreyen, and Havenith Citation2016).
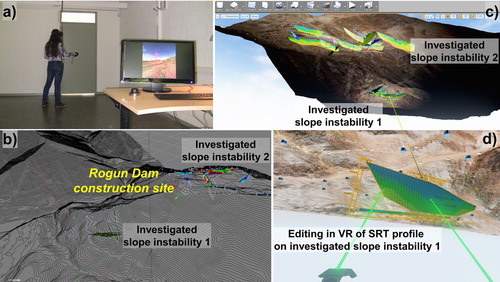
Figure 11. Seismic wave propagation across a 3D model, here shown (with Paraview®) in parallel for successive time steps, but which can also be visualised in our laboratory as animation in VR.
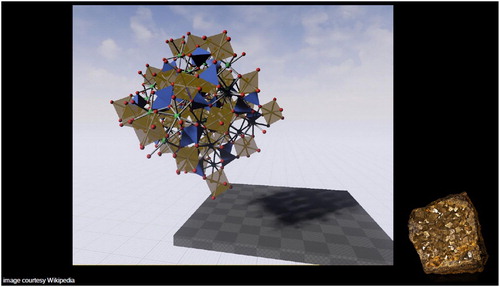
Most of those models are also used now in geohazard and other geoscience lectures in our university. For such educational purposes we additionally developed virtual ‘mineralogical’ environments at nanometre scale that help students better apprehend complexities related to crystal structures, while diving into it (see crystal structure of an Andradite mineral represented in a virtual space in ).
Figure 12. Example of crystal structure, here shown for the Andradite mineral (shown in lower right corner, image courtesy Wikipedia).
5. Discussion: need for real-time solutions and the role of uncertainty
Our recent experience with application of VR in multiple geoscience lectures confirms what other groups had already showed before, i.e. that VR clearly helps approach multiple geo-problems, in particular those involving complex geometries. In this regard, it should be noted that immersive visualisation of simple or coupled processes, changing over time is far less common. Also we developed only a few applications based on animated seismic wave propagation or successive appearance of natural events (using the occurrence time information), such as earthquake hypocentres that can successively flash up in a 3D database according to the event date. Therefore, today we are not able to really outline the benefits of VR in visualising geo-processes changing in time, and we can only assume that VR allows for an improved spatiotemporal perception of geohazard problems. The more obvious advantages offered by VR for the visualisation of ‘geo-spaces’ are supported by the recent emergence of Google Earth VR®. Most students and also other users in our lab confirm that this Google Earth VR® is clearly a new experience, barely comparable with common GE. However, not all users can really benefit from the VR experience as some are more susceptible to the aforementioned motion sickness. About 1 user out of 10 presents this problem and for him/her VR may then turn out to be a useless or even uncomfortable visualisation technology, whereas others would like to stay inside the virtual environment well beyond the recommended maximum time period of 20 min. As indicated above, solutions to the motion sickness problems are related to the frame rate and to the type of moving within the space.
The elevated hardware demands to maintain the necessary minimum frame rate for rendering in VR require intensive tasks outside the virtual environment. Therefore, data processing and simulations are run with the corresponding software on the respective computer system. Depending on the available resources and also on the software capabilities this can be parallelised to speed up the process. Data integration could be completed within the VR system to enable real-time rendering and interactivity. Real-time modelling is a major challenge for a VR environment where relatively short presentation times are commonplace. We have not tried a cloud-based approach that streams already processed data, such as in GE, also because it would not impact the pre-processing of measurement data where human intervention is necessary. This would anyway increase the system complexity without solving the fundamental problem that we cannot precompute every possible simulation to later stream it to the VR system. Some solutions might be provided by the game industry targeting fast solutions for complex problems. Indeed, the development of VR technology has always been connected with entertainment, which also contributed to the widespread availability of VR hardware at a relatively low price. The same is also true from the software perspective where the contribution of modern game engines such as Unreal and Unity facilitates the rendering of 3D content and the transition to immersive visualisation through powerful real-time capabilities and a good degree of VR hardware integration.
Thus, we believe that real-time processing will contribute to the impact of 4D geospaces, but all-embracing answers to the problem are distant – even if cloud computing is taken into consideration. Therefore, intermediate solutions have to be found.
Those technical aspects should not make us forget that also scientific issues have to be solved. In particular, it is important that the visualised virtual environments appear as ‘real’ or ‘plausible’ as possible and not as ‘not natural’ or as a ‘game space.’ Otherwise, ‘the participant could leave the experience with the impression that the hazard event is really not of much concern’ (after Mitchell Citation1997). The fact to appear as a game may, however, also have a positive character as it can help participants to be more engaged in the virtual environment (Romano, Brna, and Self Citation1998), especially if collaboration is possible in VR. But, anyway, the game must represent a plausible reality of hazard experience involving many different elements. This alone is a major challenge as for a realistic representation, those elements – such as surfaces or volumes (Earth surface and subsurface) – require extensive data information. And, even if all data are available, their representation in a dynamically changing scene is often not possible with the required resolution. In this regard, we should also note that data availability problems are often connected with limited data sharing. On the one hand, one could expect that this problem will be partly solved in near future as research data are now more and more extensively exchanged through online platforms. On the other hand, one should not forget that many types and huge quantities of existing information, especially about the subsurface, are withheld by the industry. Getting access to those data would highly enrich geomodels for many regions of the world.
A scientific analysis, be it in 2D or in VR, is not possible without representing the reliability of the data, and, thus, related uncertainties. Intuitively, all people know that predicting geohazards is subjected to uncertainties. Sword-Daniels et al. (Citation2016) highlight the necessity of considering this uncertainty in connection with natural hazard assessment, considering that ‘the non-linear and dynamic nature of many complex social and environmental systems leaves uncertainty irreducible in many cases.’ Thus, any user and, in particular, any responsible scientist, engineer, or risk manager, entering a VW where those uncertainties do not exist would at the end mistrust what has been represented – because it has been shown as a fact (while it is not in reality!). In this regard, Sword-Daniels et al. (Citation2016) further wrote ‘rather than trying to reduce uncertainty and risk by oversimplifying a situation (wilful ignorance), we argue that accepting uncertainty as complex and non-linear promotes innovative ways of thinking, and opens up new approaches for addressing uncertain situations.’ Total uncertainty is typically subdivided into epistemic and aleatory uncertainty, each of which can be represented in a different way. Epistemic (‘we do not really know’) uncertainties are best presented by ‘shading’ elements affected by those, or by making them partly transparent according to the degree of missing knowledge. Aleatory uncertainty is best visualised through the variability of possible data outputs. For graphs, such variability is shown through the standard deviation curves, as well as maximum and minimum possible models. Comparably, in a 3D geohazard space, the variability of geohazard models (scenarios) has to be shown to represent related aleatory uncertainties. It is likely that VR technology could help visualise this variability of multiple possible ‘realities’ (through multiple parallel visualised models, changing scenarios with depth – distance models are less, front models are more likely), but according to our knowledge, presently, there are no holistic solutions to do this. Brodlie, Osorio, and Lopes (Citation2012) stated with respect to uncertainty visualisation that ‘there remain significant research challenges ahead. While incorporation of uncertainty into 1D and 2D visualisation, both as a scalar and a vector, is relatively straightforward, there are difficult perceptual issues in adding an indication of uncertainty in 3D.’
Finally, we can say that a 4D geospace should be able to manage uncertainties affecting inputs and outputs, but at present there are no ad hoc solutions available and further research is necessary to do so. Related studies have to accompany the development of the basic characteristics of the 4D geospace described below.
6. Conclusions
The six essential qualities of the 4D geospace – which are not specific for geohazard assessment, but will certainly enhance it – can be described as:
Multi-dimensional: the space is 3D and so the processing and modelling should be done in 3D as well, especially in geosciences; X, Y, Z must not necessarily refer to the ‘geometrical space,’ multiple dimensions can also refer to multiple disciplines or multiple parameters to be represented.
Spatiotemporal: the three ‘geometric dimensions’ are the first elements that make up a virtual immersive space; the time-component is often less considered; however, in many geoscientific disciplines, including those related to geohazard assessment, the time component is as important as the three dimensions of space.
Integrated: elements to be represented in the 4D geospace generally have been produced by multiple different geoscientific (or even other) types of researches and applications. An ideal virtual environment allows us to combine them in one single 4D geospace, with clearly defined (spatiotemporal, causal) links established between those elements. Those links should also take into account the possible uncertainties affecting inputs and outputs as discussed above.
Fully interactive: any involved investigator or viewer should have the possibility to interact with the elements represented in the 4D geospace, or at least be able to mark or hide them, possibly proposing changes that can be visible for other investigators (who may be present in the same time in the geospace) or not. Interactive modelling would be an ideal solution, but is at present unrealistic due to the long processing/computation times required for many model types.
(Tele-)immersive: all types of analyses can be done in non-immersive (2D or 3D) environments; however, it has to be tested if an immersive analysis (and which type) may not engage the investigator, viewer, more intensively in finding solutions, than an non-immersive approach. The actual location of the participant would not be important as tele-immersive systems would allow for full immersion in the 4D geospace, also at distance.
Collaborative: the preceding points essentially require technical solutions. The goal of improving those solutions is the improved collaboration between multi-disciplinary teams. So, this last quality would be an all-embracing consequence rather than an additional characteristic, as also suggested by Lin, Chen, and Lu (Citation2013). For geohazard research, achieving this goal could represent a revolution as multi-disciplinarity is essential for establishing reliable spatiotemporal models able to predict dynamic processes that may occur anytime and anywhere with a certain probability. Such models typically require inputs and re-evaluation by more than one single person!
So, are we close to reach the technical solutions and create a 4D geospace that could help assess geohazards better? On the one hand, what has clearly improved over the past years is the increased accessibility of VR technology thanks to the wider and much cheaper use of head mounted devices (HMD) compared to the computer aided virtual environments (CAVEs). One the other hand, we still think as Mitchell (Citation1997) that ‘a workable virtual hazard environment that meets the goal of prompting users to undertake mitigation steps is distant.’
Obstacles outlined above first include insufficient possibilities for interaction and collaboration in VR. Thus, present software developed in connection with the HMD hardware does not automatically allow for editing or collaboration in the virtual space, whereas CAVEs partly do (yet, for a limited number of users and not ‘tele-immersively’). Another important underdeveloped aspect is related to model integration. This aspect could really prove the added value of VR compared to 2D virtual environments, especially in the field of geohazard assessment where extensive combination of data analysed by multiple geoscientific and other scientific or engineering disciplines is required. As stated by Voinov and Shugart (Citation2013)
one of the major incentives for integrated modelling is the promise to link models from different disciplinary fields. However we need to admit that so far there are not that many success stories here. … More user and stakeholder involvement could be essential to improve communication between disciplines and to ensure that model complexity is kept under control and that new emergent properties are recognized in the integrated, or in this case perhaps, integral models. Integrating stakeholder and modeller input in a process of integral modelling may be still a more realistic approach in such cases.
Therefore, we should concentrate on further developing integrated models and thus focus on the key targets cited by Breunig and Zlatanova (Citation2011) including
spatio-temporal data models, temporal geometry and topology operations in geo- database systems, spatio-temporal integrity checking of geometry and topology, and spatio-temporal similarity search (pattern comparison of 3D objects). To model 3D changes over time to simulate geological processes, changes in both geometry (expansion) and topology (discretisation) must be considered. Despite the progress observed in many fields, we still lack the ultimate 3D model that will allow us to integrate different representations and models from different domains.
And even if we manage to develop fully integrated 3D geohazard models combining outputs from multiple disciplines and adapted for immersive analysis, we need to check if they really allow for an improved understanding. As Romano, Brna, and Self (Citation1998) wrote
an immersive virtual environment (VE) usually requires a considerable investment. Therefore it would be interesting to determine if a simple desktop VE could be used to achieve a sense of presence sufficient to provide trainees with an experience of the same cognitive value as one in the real world without the need to construct a full immersive VE with all its associated costs.
Thus, the final usability of VR in any scientific research has to be analysed in a critical way, respectively, for each discipline and for multi-disciplinary approaches.
Disclosure statement
No potential conflict of interest was reported by the authors.
References
- Andrienko, G., N. Andrienko, U. Demsar, D. Dransch, J. Dykes, S. I. Fabrikant, M. Jern, M. J. Kraak, H. Schumann, and C. Tominski. 2010. “Space, Time and Visual Analytics.” International Journal of Geographical Information Science 24 (10): 1577–1600. doi:10.1080/13658816.2010.508043.
- Bach, B., P. Dragicevic, D. Archambault, and S. Carpendale. 2014. “A Review of Temporal Data Visualizations Based on Space-Time Cube Operations.” In Eurographics Conference on Visualization (EuroVis), edited by R. Borgo, R. Maciejewski, and I. Viola, 1–19. Swansea, UK.
- Bilke, L., T. Fischer, C. Helbig, C. Krawczyk, T. Nagel, D. Naumov, S. Paulick, et al. 2014. “TESSIN VISLab—Laboratory for Scientific Visualization.” Environmental Earth Sciences 72 (10): 3881–3899. doi:10.1007/s12665-014-3785-5.
- Breunig, M., and S. Zlatanova. 2011. “3D Geo-Database Research: Retrospective and Future Directions.” Computers & Geosciences 37 (7): 791–803. doi:10.1016/j.cageo.2010.04.016.
- Brodlie, K., R. A. Osorio, and A. Lopes. 2012. “A Review of Uncertainty in Data Visualization.” In Expanding the Frontiers of Visual Analytics and Visualization, edited by J. Dill, R. Earnshaw, D. Kasik, J. Vince, and P. Chung Wong, 81–109. London: Springer Verlag.
- Cerfontaine, P., A. S. Mreyen, and H.-B. Havenith. 2016. “Immersive Visualization of Geophysical Data.” In International Conference on 3D Imaging (IC3D), IEEE, 1–6.
- Cowgill, E. S., T. Bernardin, M. E. Oskin, C. J. Bowles, M. B. Yikilmaz, O. Kreylos, A. J. Elliott, et al. 2012. “Interactive Terrain Visualization Enables Virtual Field Work During Rapid Scientific Response to the 2010 Haiti Earthquake.” Geosphere 8 (4): 787–804. doi:10.1130/GES00687.1.
- Creighton, R. H. 2010. Unity 3D Game Development by Example: A Seat-of-Your-Pants Manual for Building fun, Groovy Little Games Quickly. Birmingham: Packt.
- Garcia-Hernandez, R. J., C. Anthes, M. Wiedemann, and D. Kranzlmüller. 2016. “Perspectives for Using Virtual Reality to Extend Visual Data Mining in Information Visualization.” In Aerospace Conference, IEEE, 1–11.
- Goodchild, M. F. 2009. “Geographic Information Systems and Science: Today and Tomorrow.” Annals of GIS 15: 3–9. doi:10.1080/19475680903250715.
- Goodchild, M. F. 2010. “Twenty Years of Progress: GIScience in 2010.” Journal of Spatial Information Science 1: 3–20.
- Havenith, H. B., A. Strom, I. Torgoev, A. Torgoev, L. Lamair, A. Ischuk, and K. Abdrakhmatov. 2015. “Tien Shan Geohazards Database: Earthquakes and Landslides.” Geomorphology 249: 16–31. doi:10.1016/j.geomorph.2015.01.037.
- Jurik, V., L. Herman, P. Kubicek, Z. Stachon, and C. SaSinka. 2016. “Cognitive Aspects of Collaboration in 3d Virtual Environments.” The International Archives of the Photogrammetry, Remote Sensing & Spatial Information Sciences XLI-B2: 630–670.
- Kellogg, L. H., G. W. Bawden, T. Bernardin, M. Billen, E. Cowgill, B. Hamann, M. Jadamec, O. Kreylos, O. Staadt, and D. Sumner. 2008. “Interactive Visualization to Advance Earthquake Simulation.” Pure and Applied Geophysics 165: 621–633. doi:10.1007/s00024-008-0317-9.
- Lascara, C. M., G. H. Wheless, D. C. Robert Patterson, A. Johnson, J. Leigh, and A. Kapoor. 1999. “Tele-immersive Virtual Environments for Collaborative Knowledge Discovery.” In Advanced Simulation Technologies Conference, San Diego, 11–15.
- Li, X., and M. J. Kraak. 2008. “The Time Wave. A new Method of Visual Exploration of Geo-Data in Timespace.” The Cartographic Journal 45 (3): 193–200. doi: 10.1179/000870408X311387
- Lin, H., M. Batty, S. E. Jørgensen, B. Fu, M. Konecny, A. Voinov, P. Torrens, et al. 2015. “Virtual Environments Begin to Embrace Process-Based Geographic Analysis.” Transactions in GIS 19 (4): 493–498. doi:10.1111/tgis.12167.
- Lin, H., M. Chen, and G. Lu. 2013. “Virtual Geographic Environment: a Workspace for Computer-Aided Geographic Experiments.” Annals of the Association of American Geographers 103 (3): 465–482. doi:10.1080/00045608.2012.689234.
- Lin, H., M. Chen, G. Lu, Q. Zhue, J. Gong, X. You, Y. W. B. Xu, and M. Hua. 2013. “Virtual Geographic Environments (VGEs): A New Generation of Geographic Analysis Tool.” Earth-Science Reviews 126: 74–84. doi:10.1016/j.earscirev.2013.08.001.
- MacEachren, A. M., I. Brewer, and E. Steiner. 2001. “Geovisualization to Mediate Collaborative Work: Tools to Support Different-Place Knowledge Construction and Decision-Making.” In Proceedings of the 20th International Cartographic Conference, 6–10.
- MacEachren, A. M., W. Pike, C. Yu, I. Brewer, M. Gahegan, S. D. Weaver, and B. Yarnal. 2006. “Building a Geocollaboratory: Supporting Human-Environment Regional Observatory (HERO) Collaborative Science Activities.” Computers, Environment and Urban Systems 30 (2): 201–225. doi:10.1016/j.compenvurbsys.2005.10.005.
- Machover, C., and S. E. Tice. 1994. “Virtual Reality.” IEEE Computer Graphics and Applications 14 (1): 15–16. doi:10.1109/38.250913.
- Mitchell, J. T. 1997. “Can Hazard Risk be Communicated Through a Virtual Experience?” Disasters 21 (3): 258–266. doi: 10.1111/1467-7717.00060
- Olson, G. M., and J. S. Olson. 2000. “Distance Matters.” Human-Computer Interaction 15 (2): 139–178. doi:10.1207/S15327051HCI1523_4.
- Ondercin, M. 2016. “An Exploration of Rockfall Modelling through Game Engines.” Master thesis, Queen’s University, Kingston, Ontario, Canada, 151p.
- Romano, D. M., P. Brna, and J. A. Self. 1998. “Collaborative Decision-Making and Presence in Shared Dynamic Virtual Environments.” In Proceedings of the Workshop on Presence in Shared Virtual Environments, 7p. Martlesham Heath: BT Labs.
- Sanders, A. 2016. An Introduction to Unreal Engine 4. CRC Press, Taylor & Francis Group.
- Sharma, S., P. Devreaux, D. Scribner, J. Grynovicki, and P. Grazaitis. 2017. “Megacity: A Collaborative Virtual Reality Environment for Emergency Response, Training, and Decision Making.” Electronic Imaging 2017: 70–77. doi: 10.2352/ISSN.2470-1173.2017.1.VDA-390
- Sword-Daniels, V., C. Eriksen, E. E. Hudson-Doyle, R. Alaniz, C. Adler, T. Schenk, and S. Vallance. 2016. “Embodied Uncertainty: Living with Complexity and Natural Hazards.” Journal of Risk Research 24: 1–18. doi:10.1080/13669877.2016.1200659.
- Voinov, A., and H. H. Shugart. 2013. “‘Integronsters’, Integral and Integrated Modeling.” Environmental Modelling & Software 39: 149–158. doi:10.1016/j.envsoft.2012.05.014.
- Westerteiger, R. 2014. “Virtual Reality Methods for Research in the Geosciences.” PhD thesis, Technical University Kaiserslautern.
- Xu, B., H. Lin, L. Chiu, Y. Hu, J. Zhu, M. Hu, and W. Cui. 2011. “Collaborative Virtual Geographic Environments: A Case Study of air Pollution Simulation.” Information Sciences 181: 2231–2246. doi:10.1016/j.ins.2011.01.017.
- Zhu, J., H. Zhang, X. Yang, L. Z. Yin, Y. Li, Y. Hu, and X. Zhang. 2016. “A Collaborative Virtual Geographic Environment for Emergency Dam-Break Simulation and Risk Analysis.” Journal of Spatial Science 61 (1): 133–155. doi:10.1080/14498596.2015.1051148.