
 ?Mathematical formulae have been encoded as MathML and are displayed in this HTML version using MathJax in order to improve their display. Uncheck the box to turn MathJax off. This feature requires Javascript. Click on a formula to zoom.
ABSTRACT
Photorealistic three-dimensional (3-D) models are important tools for urban and disaster management planning because they contain useful visual and spatial information for assessing the situation and responding accordingly. Thus, it is crucial for 3-D city models to maintain a high level of accuracy in portraying 3-D geometric objects. Despite that, significant research with respect to 3-D city models has been conducted; however, it is still difficult to create accurate 3-D representations, particularly across a wide area. Thus, this research is aimed at developing an automated 3-D city modeling application that utilizes a combination of aerial photographs, terrestrial light detection and ranging, and total station techniques for particularly dense urban areas. To enable the development of an automated 3-D city model, this research developed application software programmed in C++. This application enables users to generate 3-D images of buildings. Specifically, the 3-D city models are generated using the aerial photographs. The positional accuracy of the model is highly improved by comparing building models produced using a photogrammetric plotting instrument. Once created using a combination of aerial photos and terrestrial instruments, the 3-D city model is quantitatively assessed for completeness and suitability for commercial or public use.
1. Introduction
Three-dimensional (3-D) city models or geographic information systems (GIS)-based 3-D landscape analyses are crucial for urban planning, disaster management, virtual tourism, 3-D GIS, and other applications (Lafarge and Mallet Citation2012; Xiao, Gerke, and Vosselman Citation2012; Xie et al. Citation2012; Sun and Salvaggio Citation2013; Wang Citation2013; ). In particular, a GIS-based 3-D model is able to represent spatial–temporal information for sustainable urban planning, development, and management (Yang Citation2016). It can also enable the construction of digital societies as an integrated platform for smart cities. Therefore, the extraction of building data plays a key role in the models, landscape analyses, and urban planning for smart cities (Yang Citation2016). There are various approaches to building 3-D city models, including the use of aerial images, airborne or terrestrial light detection and ranging (LiDAR), airborne synthetic aperture radar (SAR) interferometry, and combinations of these methods (Rottensteiner Citation2003; Abayowa, Yilmaz, and Hardie Citation2015). In general, the use of aerial images and LiDAR data is becoming increasingly popular for 3-D urban mapping. However, the resulting 3-D objects are often inaccurate, incomplete, or not up to date (Demir and Baltsavias Citation2012) because of inaccuracies or a lag in technologies or techniques. Furthermore, the creation of 3-D geometric models is a labor-intensive and arduous task, with many complicated steps, especially for large urban areas (Sun and Salvaggio Citation2013).
With respect to the issues mentioned above, this research aimed not only to improve the accuracy of 3-D city models using a combination of aerial photographs and ground-based instruments, with a focus on wide geographic areas, but it also aimed to develop algorithms for the automated production of 3-D models. In particular, this research had multiple objectives. First, it developed an application to automatically create 3-D building models from oblique aerial images for a large city. Then, the 3-D building models were compared with the building tops produced through a plotting instrument, and the positional differences were automatically adjusted using the application. As a result, the adjusted 3-D buildings were horizontally and vertically improved. Next, additional 3-D building models were created using ground-based instruments, such as terrestrial LiDAR and total station (TS) scanners, to generate elaborate models, such as those for heritage buildings or buildings with multiple facades. After that, the 3-D building models developed in this research were quantitatively assessed to investigate their completeness and suitability for commercial or public use. The two 3-D building models developed in this research were integrated into a GIS database. Finally, a web GIS server was developed to publish these highly accurate 3-D city models on the web.
To achieve the research objectives, this paper is structured as follows: Section 2 describes previous studies related to 3-D city models. Section 3 addresses the primary research approaches, materials, and study area. Section 4 provides the research outputs resulting from the primary approaches, and Section 5 quantitatively assesses the research outputs. Section 6 discusses the significant contribution and limitations of this research, and concludes the paper.
2. Related work
Over the past two decades, there has been a plethora of studies based on 3-D city modeling using airborne images, airborne LiDAR, ground-based or vehicle-borne sensing techniques, and combinations thereof. Early research on the automatic extraction of building data focused on aerial imagery because of its high spatial resolution (Frere et al. Citation1998; Moons et al. Citation1998; Früh and Zakhor Citation2001; Liang et al. Citation2017). However, recent studies in large-scale urban modeling have relied on airborne LiDAR-based rooftop modeling (Rottensteiner Citation2003; Poullis and You Citation2009; Sun and Salvaggio Citation2013; Yang Citation2016), mobile LiDAR modeling of building facades (Früh and Zakhor Citation2001, Citation2003, Citation2004; Früh, Sammon, and Zakhor Citation2004; Heo et al. Citation2013), and hybrid approaches (Ding, Lyngbaek, and Zakhor Citation2008; Yong and Huayi Citation2008; Mastin, Kepner, and Fisher Citation2009 Wang and Neumann Citation2009; Lafarge and Mallet Citation2012; Toschi et al. Citation2017 Turlapaty et al. Citation2012). In particular, the approaches to creating 3-D building models from aerial images on a large scale are categorized into parametric shapes, segmentation, and digital surface models (Haala and Kada Citation2010). Furthermore, it is necessary to generate digital terrain models (DTMs) that represent the elevations of 3-D urban models. A variety of DTM generation methods have been developed (Kraus and Pfeifer Citation1998 ; Chen et al. Citation2012; Chen, Xu, and Gao Citation2016; Chen, Gao, and Devereux Citation2017). Most recently, Chen, Gao, and Devereux (Citation2017) summarized and introduced six categories of DTM generation: surface-based adjustment, morphology-based filtering, triangulated irregular network-based refinement, segmentation and classification, statistical analysis, and multi-scale comparison. Despite the fact that many efforts have been conducted, the complexity and difficulty of automatic 3-D city modeling remain, especially for wide geographic areas.
In general, laser scanners can generate more accurate 3-D geometric primitives than image-based 3-D representations. Airborne laser scanners, however, produce a low point density on building facades, which results in a relatively coarse representation (Haala, Rothermel, and Cavegn Citation2015). Airborne LiDAR data usually have a nominal point spacing (i.e. horizontal resolution) of between 1 and 2 m. This is approximately 5 points per square meter, which determines the resolution of the derived grid elements and level of detail in the 3-D geometric objects (Lafarge and Mallet Citation2012; NOAA Citation2012). The greater the number of points is, the finer the geographic representation that is derived from the spatial resolution (i.e. pixel size) (Yang, Kim, and Madden Citation2012). The LiDAR point density in a given area depends on the altitude of the aircraft, pulse rate, flight mission trajectory, speed of the aircraft, field of view of the scanner, capability to record echoes from an emitted laser beam, etc. Typically, faster speeds of aircraft produce a lower point density (NOAA Citation2012). Thus, if an airplane flies several times over the study area, it may generate a higher point density from the buildings’ facades. Despite the fact that flying is the most time effective technics for mapping, flying to generate a higher point density is costly in terms of time, effort, and money. Furthermore, when generating 3-D building models, it is not easy to collect the exact geographic locations of all four corners or edges of buildings using airborne LiDAR multiple return points; therefore, the boundary images of buildings are less precise (Cheng et al. Citation2008; Lafarge and Mallet Citation2012).
Oblique aerial images taken from different viewing directions provide appropriate textures for building roofs and even facades (Stilla, Kolecki, and Hoegner Citation2009; Kersten and Stallmann Citation2012; Xiao, Gerke, and Vosselman Citation2012), whereas an airborne laser scanner cannot detect 3-D building textures, such as the building facades (Abayowa, Yilmaz, and Hardie Citation2015) required to generate photorealistic 3-D models.
In general, terrestrial laser scanners can produce dense and accurate geometric objects because their positional accuracy is higher than that of aerial image-based 3-D representations and they can generate sophisticated geometric shapes. In fact, dense and accurate geometric objects depend on the performance of the equipment used, shapes of the buildings, density rate of the buildings, width of the streets, and urban greenery. When the terrestrial laser scanners are used, aerial coverage is restricted and cannot cover thousands of buildings because it is labor intensive, time-consuming, and expensive (Arayici Citation2007). Furthermore, the data size from a terrestrial laser scanner is problematic; therefore, for large areas, aerial photographs are still a useful resource for 3-D building models.
Aerial image-based 3-D representations are commonly used to model large urban areas and are the most available data sources. Usually, the amount of detail in an aerial image is sufficient for simulation or visualization at small or medium scale. However, it is hard to represent the explicit geometric elements of building facades, such as doors and windows (Xiao, Gerke, and Vosselman Citation2012). Owing to the difficulties in obtaining airborne data caused by viewpoint restrictions, ground-based techniques like terrestrial laser scanning and TS surveying are necessary for the detailed 3-D imaging of building facades. Therefore, a combination of aerial and terrestrial techniques is important for generating models with highly accurate geographic locations.
Although it would be possible to gain higher positional accuracy of the 3-D urban model resulting from a combination of aerial and terrestrial images, the positional accuracy of DTM generation plays a crucial role in determining elevations of a 3-D urban model. In particular, it is difficult to generate DTMs in urban areas because of the large, flat-topped buildings (Chen, Gao, and Devereux Citation2017).
Accordingly, not only does this study propose a hybrid approach using aerial and ground-based techniques but it also develops algorithms for the automated production of 3-D city models.
3. Method
3.1. Study area and materials
3.1.1. Study area
The study area () was part of Gunsan City, a port city in southeastern South Korea, where the Geum River and West Sea merge (approximately 18.45 km2).
Figure 1. Study area.
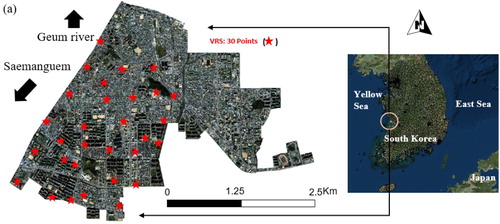
According to a census conducted by the Ministry of Government Administration and Home Affairs in July 2015, the city’s population was approximately 278,455. The study area included both high-density urban zones and some open ‘green’ spaces. The red star symbols in represent the locations of the ground control points that were used to assess the 3-D building models.
3.1.2. Materials
This research utilized a combination of aerial and terrestrial laser scanner images, and TS measurements to develop a highly accurate automated 3-D city model of a particularly large coastal town. shows the equipment used in this research.
Figure 2. Equipment used in this research.
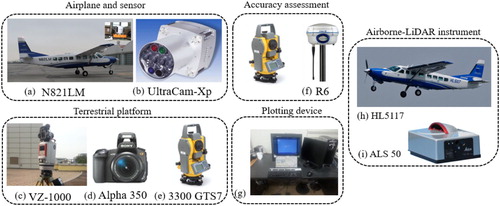
To generate 3-D geometric objects, high-resolution aerial images were obtained using an optical aerial camera (UltraCamXp, Vexcel Imaging GmbH, Graz, Austria) ((a,b)), which can produce a pixel resolution of 2.9 cm from a ground sampling distance of 500 m (Microsoft Citation2008). The aircraft used in this research flew at an altitude of 1000 m and on August 2013, which yielded a pixel resolution of 6 cm. The positional accuracies of the aerial images were quantitatively assessed using national reference points (NRPs) and virtual reference stations (VRSs), as determined by the static GPS and TS surveying ((f)). (c) is a terrestrial laser scanner (VZ-1000, RIEGL, USA), which can provide high-resolution calibrated color images and create photorealistic 3-D reconstructions. (d) is a DSLR camera (Alpha 350, Sony), which can produce texture images and be mounted on the terrestrial laser scanner ((c)). (g) is a plotting instrument (SOCET SET version 5.4.1, Bay Systems) photogrammetric mapping software, which uses triangulation, terrain extraction, orthophoto production, and 3-D database generation for urban modeling (Bay Systems Citation2007). Lastly, this research used an airborne LiDAR with an airborne laser scanner (ALS50-II, Leica Geosystems AG) ((h,i)). The vertical and horizontal accuracies of the airborne LiDAR instrument were ±11 and ±15 cm, respectively (Leica Geosystems Citation2006).
3.2. Primary approaches
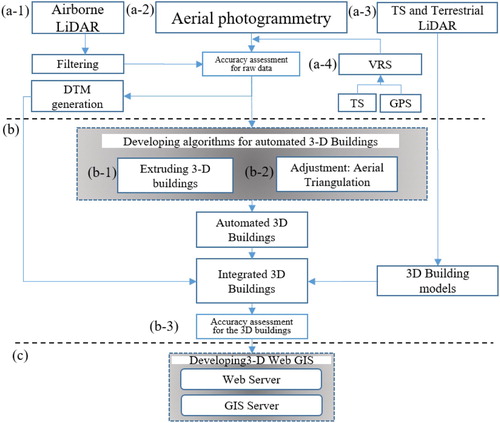
3.2.1. Acquiring data sources and DTM generation
As shown in (a), aerial photos, airborne LiDAR return points, and terrestrial data were acquired from the instruments pictured in . The positional accuracies of all the data were assessed using VRSs that were determined by TS and GPS surveying ((a-4)). When creating 3-D geometric shapes, height (i.e. elevation) information from above the Earth’s surface is required. Therefore, this research used LiDAR multiple return points to create the high-resolution DTMs that were used to determine the elevations of the 3-D buildings ((a-1)). The number of the LiDAR multiple points were determined at the flight altitude of the airborne LiDAR, which was 1000 m above sea level. The average LiDAR point density used in this research was 5 points per square meter and a minimum of 2 points per square meter. The vertical and horizontal accuracies of the airborne LiDAR instrument were ±11 and ±15 cm respectively.
Figure 3. Steps (a)–(c) for developing an automated 3-D city model.
The DTMs represented the bare ground surface without ground objects, such as buildings or trees. The raw LiDAR data used in this research were acquired through an ALS 50 II sensor, and GrafNav GNSS software (NovAtel Citation2017) was used for the post-processing. To generate the DTMs, this research used two processes: automated filtering and manual point removal. To filter the raw LiDAR data, TerraScan software was used to automatically extract the last return points that could generate DTMs ((b)). In this process, we considered three parameters: the angles of slopes, heights of the ground objects, and area of the largest building. After the automated filtering process, we manually eliminated any points that indicated features such as aerial points (e.g. birds), buildings, vehicles, or trees because these LiDAR points had elevation values that varied. The outliers ((c)) were manually removed through visual inspection, and this task was processed using the multiple profile view windows of the software ((c,d)). After filtering the last return points, the selected points were assessed by comparing them with the locations of the 30 VRSs. The accuracies of the DTMs were derived from the 30 VRS points that were determined by TS and GPS surveying ((a-4)). The mean square error of the DTMs was ±15 cm.
Figure 4. DTM generation process: Filtering and DTM generation.
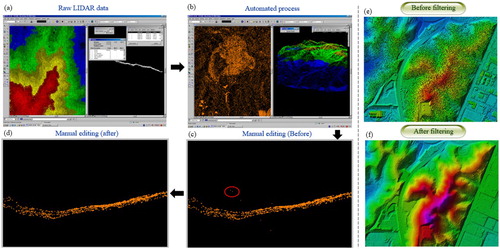
After filtering the raw LiDAR data, the last return points were interpolated to generate DTMs using a Kriging function (Gonçalves Citation2006).
3.2.2. 3-D building models from oblique aerial photographs
It is evident that consecutive photos in a flight strip and in two directions must overlap to create stereoscopic coverage. For mapping projects, this normally means end lap ranges between 55% and 65% (a nominal average of 60%) and side lap ranges between 20% and 40% (Morgan and Falkner Citation2001). Side lap is the distance between the centers of adjacent flight lines, whereas end lap is the distance between the centers of consecutive photographs along the flight path (a nominal average of 30%) (Morgan and Falkner Citation2001). As a rule, through the stereoscopic coverage, 3-D objects such as buildings can be extracted. The complexity of images or level of detail of the 3-D objects strongly depends on the images’ spatial resolution. In other words, a lower resolution can reconstruct the important details of the 3-D objects.
As stated earlier, this research used a combination of aerial images and terrestrial laser scanner and TS measurements to model a particularly large city in 3-Ds. To obtain the stereoscope coverage and acquire three-coordinate systems (x, y, and z) of the geographic objects, orientation processes, such as interior, relative, and absolute, were conducted. These processes followed a collinearity condition, i.e. any point location (x, y, z) on a photograph must lie on a straight line with the point locations (x′, y′, z′) on the ground. The 3-D city model extracted through the stereoscope image was internally and externally oriented and finally adjusted by the aerial triangulation (AT) network; therefore, the vertical and horizontal accuracies of the 3-D building model were crucial.
Accordingly, as shown in (b), this research developed a new C++ (i.e. object-oriented superset of C) application that enabled GIS professionals to automatically generate a 3-D building model. Furthermore, this research proposed an approach to improve the positional accuracy of 3-D models developed with the application ((b-2)). In terms of accuracy improvement, the building tops were produced through a plotting instrument with SOCET SET (version 5.4.1) photogrammetric mapping software, which uses triangulation, terrain extraction, orthophoto production, and 3-D database generation for urban modeling (Bay Systems Citation2007). Using the plotter device, AT was achieved with a predicted horizontal circular error of 0.7 m and a confidence level of 95%. The building tops produced were then compared with the 3-D building models produced in step b-1. Steps b-1 and b-2 were major components of this research and involved C ++ programming to enable the automated functions of the 3-D model. The computer programming algorithms are introduced in Section 4.1.
3.2.3. Sophisticated 3-D building modeling using ground-based equipment
This research used two ground-based instruments, a TS and a terrestrial LiDAR instrument, to portray complex building structures or update the model when new development or renovation occurred ((a-3)). This task was particularly necessary when modeling heritage buildings with multiple facades. A TS (Trimble 3300 GTS7) and terrestrial laser scanner (VZ-1000) are used to create a photorealistic 3-D reconstruction that captures the details of elaborate structures.
In general, the outputs of a TS and terrestrial laser scanner have different benefits. A TS produces only a few points for the target objects, whereas a terrestrial laser scanner produces millions of points. However, together they can produce precise and accurate positions for a 3-D model. Whereas a laser scanner uses a fully automated process, a TS has both a semi-automated process and manual steps. Considering the economy of time for fieldwork and post-processing, the time per point measured by a TS is much longer than that of a terrestrial laser scanner. In post-processing, where the 3-D objects are created, a laser scanner requires multiple steps to remove massive numbers of unnecessary points, whereas a TS is more time efficient. A laser scanner can also create a realistic view of a 3-D object, whereas a TS cannot. Furthermore, a TS cannot detect objects at distances greater than 20 m from the prism, and its accuracy differs between prism and non-prism targets. On the other hand, a terrestrial laser scanner can detect a point that is 1400 m from the scanner. For these reasons, cartographers, photogrammists, and GIS scientists use a combination of the two ground-based instruments to create 3-D city models.
The TS used in this research provided an accuracy of ±2 mm + 2 ppm with a prism target and ±5 mm + 2 ppm without a prism target (Trimble Citation2001). The accuracy of the terrestrial laser scanner was ±8 mm, its precision was ±5 mm (RIEGL Citation2015), and it was able to resolve an object at a distance of more than 1400 m.
3.2.4. Integration of 3-D building models and accuracy assessment
After the 3-D city models were generated through both the automated process and ground-based instruments, the two 3-D city models were integrated into a database ((b-3)). Once the models were produced, it was necessary to do an accuracy assessment of the remotely sensed data, particularly the 3-D building models. The accuracy assessment in (a) is for raw data such as aerial photos and airborne LiDAR data. The integrated 3-D city models were quantitatively assessed to investigate their completeness (i.e. correctness) and suitability for commercial or public use.
For the accuracy assessment, it was required to have precise and accurate positions determined from the reference points (i.e. fiducial points) (Congalton and Green Citation2008). Thus, the 3-D model that resulted from these two approaches was quantitatively assessed through the NRPs and VRSs that were determined by the kinematic GPS and TS surveying. As for the completeness and suitability of the 3-D city models, this research used t-test statistic and an area-based assessment. Finally, the integrated 3-D building model was published on the web ((c)).
4. Results
4.1. Developing an algorithm for an automated 3-D city model
This research developed algorithms for an automated 3-D city model containing three nodes, which were programmed in C++. shows the computer algorithms and summarizes the application development process. Before programming the 3-D city model, the aerial photos acquired in this research were inserted into node 1.
Figure 5. Developing algorithms for automated 3-D building models.
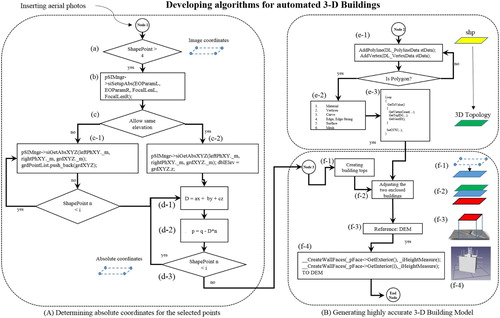
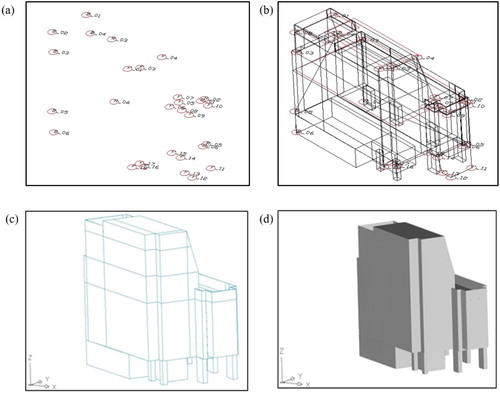
In node 1, this application allows users to manually select the edges (i.e. points) of buildings on a pair of oblique aerial photos. The selection of the building edges was determined in two windows of the application ((c)). (a) shows the programming code that allows users to manually determine the edges of the buildings. Following steps in (b–d-3) shows how the absolute coordinates (x, y, and z) of selected points on the building were determined. Throughout these steps, the processes of interior, relative, and absolute orientation were automatically completed to generate a model with absolute coordinates. More precisely, the x, y, and z coordinates were determined by an exterior orientation comprising six mathematical elements: the x, y, and z positions of the camera focal point and the three angles of rotation (omega (roll), phi (pitch), and kappa (yaw)), with respect to the ground. In this algorithm, pSIMngr denotes a variable and siGetAbsXYZ denotes a function for determining the absolute coordinates. In particular, this research assumed two conditions: (1) that all selected points (building edges) are referenced as the same elevation and (2) all points selected have different elevations ((c)). After that, the absolute coordinate systems for the selected points of the buildings were determined by a collinearity condition that allowed computation of the position and orientation of the photograph based on known points on the ground. The programming code for the collinearity condition equation in is not provided in this paper due to its length. In (d-1), under the collinearity condition, distances (D) between the reference plan and selected points are computed through the equation D = ax + by + cz. (d-2) computes the absolute coordinate system for one point P, which is determined through the equation p = q − D*n. (d-3) repeats the steps in (d-1,d-2) to compute the position and orientation of all the points selected by the user. In the case of (c-1) and assuming all points use the same elevation, the process moves to node 3. Once the building edges are manually determined by the user and georeferenced by the collinearity condition, the locations of the selected building edges are compared with the buildings points (node 2) that were determined using the plotter device ((f-2)).
Node 2 was developed to create the building tops that were digitized by the plotter instrument, in order to produce high accuracy. The building tops were created at a scale of 1:1000 and were embedded in the automated 3-D building model system to adjust the building tops developed in node 2. This step was needed to improve the positional accuracy of the 3-D building model ().
To illustrate this step, the building tops with polygon features were formatted in a shapefile format and converted to 3-D topology components that included materials, vertices, curves, edges, surfaces, and meshes ((e-2)). These topology components were then used to create enclosed polygons (mesh) that were determined by a Delaunay triangle algorithm. The algorithm was programmed in node 2 but not provided in due to its length. Furthermore, the enclosed polygons were repeatedly created a counterclockwise direction ((e-3)). Once all the building polygons were reformatted, they were used as references to improve the accuracy of the building tops developed in node 1.
Node 3 was the final step in creating a 3-D city model with a high degree of accuracy. In this step, two building tops were compared and their positional differences were adjusted ((f-2)). Once the differences were adjusted or corrected, new building tops were created. These edges were used to create a framework of 3-D geometric shapes ((f-3)). In other words, the new building tops were aligned to the reference DTM ((e)) to determine vertical positions of the buildings. The walls of the 3-D buildings were created through the programming command CreateWallFaces ((f-4)), which denotes a variable to fill out the 3-D building frames.
displays the new application developed through nodes 1–3 and demonstrates the processes of these nodes.
Figure 6. Demonstrating the processes for building 3-D objects.
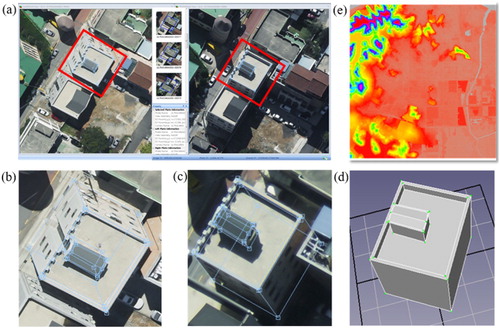
The application developed in this research provided the means to automatically display the best pairs of high-quality aerial images that provide widest areas of building facades. The user could then choose the best pair of high-quality aerial images to use for the manual selection of building tops. The selected aerial images were used later for texture mapping. To illustrate, as shown in (a), the best pair of high-quality aerial images were displayed in two windows, which enabled the users to manually determine the building edges. In the left window ((a)), the building corners (i.e. edges) were manually selected, while conjugate points were determined simultaneously in the right window ((c)). Once the building edges were determined ((b,c)) through the node 1 process shown in , the building points had absolute coordinates. 3-D geometric shapes were created, and the 1-m DTM ((e)) was used to determine the zero-elevation surface (base layer) and height of the 3-D geometric objects. Finally, through nodes 2 and 3, the 3-D geometric objects were created ((d)) from the two consecutive photographs.
The following demonstrates the working process in node 2, which automatically compares the positional differences of the 3-D building tops created in node 1 with the 3-D building tops created in node 2. This step is crucial for improving the positional accuracy of the automated 3-D building model.
In this study, approximately 10,000 buildings were used to create the 3-D buildings, and 50 buildings were randomly selected to compare the positional differences. As illustrated in , three types of buildings ((a–c)) were selected to investigate the positional differences between the building tops developed in nodes 1 and 2. The building tops (Planar areas) developed in node 2 were produced through the plotting instruments and used to improve the positional accuracy of the 3-D buildings developed in node 1. In this analysis, within a tolerance of 25 cm – which is equivalent to the airborne LiDAR vertical accuracy standard (NGI Citation2013) – about 95% of the 3-D building models were perfectly matched with the reference building tops. The remaining 5% had differences over 25 cm, which were caused by random or unpredictable errors.
Figure 7. Improving positional accuracy of the 3-D building model.
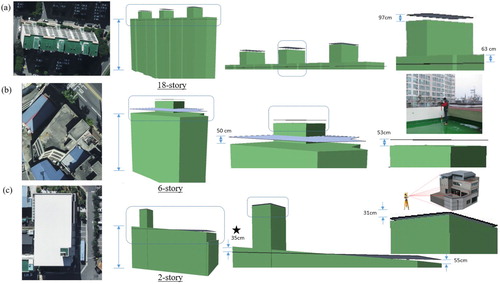
As shown in (a), the maximum of vertical difference is 97 cm for the tall buildings that were more than 18 stories high ((a)). The buildings that were over 6 stories have a 53-cm difference. Interestingly, the buildings that were less than 2 stories have a −35 cm difference, i.e. the building tops developed in node 1 are higher than those developed in node 2.
4.2. 3-D building model by ground-based equipment
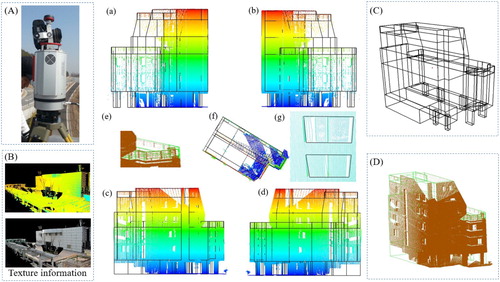
From the foregoing discussion of the point density, it is evident that each ground-based instrument should be used according to its purpose and efficiency. As stated in Section 3, although the measurement obtained by terrestrial LiDAR scanners and TS systems are the most accurate for modeling 3-D geometric objects, they cannot cover larger areas containing thousands of buildings because they are expensive, labor intensive, and time-consuming. Furthermore, the size of terrestrial LiDAR data is problematic (Pflipsen Citation2007). Nevertheless, it is necessary to assist in updating 3-D building objects or in portraying complex or sophisticated building structures. shows an example of a 3-D building model acquired through TS.
Figure 8. 3-D building reconstruction utilizing inflection points acquired by TS.
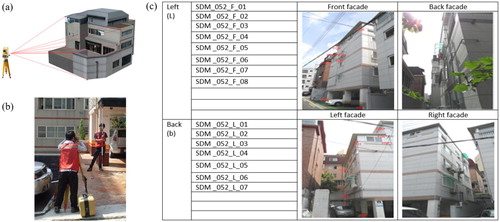
As shown in , the inflection points on the facades of the building were acquired by TS. This type of surveying can not only detect where the target is difficult, impossible, or dangerous to reach ((a,c)), but can also obtain target points through the prism target ((b)). It can measure property boundaries and the corners of buildings without gaining physical access. Furthermore, TS is used to determine reference points (i.e. control point) for accuracy assessment. The image (Front façade) in (c) shows the numbers of the inflection points acquired by a non-prism target.
Once the inflection points ((a)) are acquired and assigned absolute coordinates, they are connected to create building lines ((b)). The enclosed buildings ((c)) are then created and converted to 3-D geometric objects ((d)). These objects are finally referenced to a geographic coordinate system. Typically, when scanning a single target using a TS instrument, the positional accuracy is better than with a terrestrial laser scanner.
Figure 9. 3-D building model by the TS technique.
By contrast, a terrestrial LiDAR scanner can produce photorealistic scenes. Terrestrial LiDAR emits laser beams through a rotating mirror, collects the reflected beams from the target objects, and calculates travel time between the target objects and laser scanner (Shan and Toth Citation2008). Finally, the travel time is converted to a distance between the target objects and the laser scanner. The laser scanner produces massive point clouds, and measurements of the distances can be used to create a 3-D city model.
As shown in (A), a DSLR camera was mounted on the terrestrial laser scanner and integrated with an internal GPS and external GNSS receivers. The combination of laser scanner and camera produced a photorealistic 3-D building model ((B)) rendered by multispectral bands (red, green, and blue). The laser scanner was mounted on a tripod, scanned the target building, and produced high-density points. It could quickly scan the targets, but produced large volumes of data, which measured the distances and angles of the targets. Even though a terrestrial laser scanner produces large data volumes, it is still useful for modeling complicated and elaborate 3-D geometric objects. For example, as shown in , the terrestrial laser scanner generated the fences on the building tops ((e)), windows ((g)), and other intricate structures. (a–d, f) shows the facades of the buildings and building tops. Although the laser scanner used in this research produced massive multiple return points, the post-processing to model 3-D geometric objects was entirely automated. As shown in (b,c), the inflection points are connected to a polyline, and the polyline is converted to a 3-D geometric object. The post-processing was completed using AutoCAD (Autodesk Inc.). The raw LiDAR return points were acquired using RiSCANpro (RIEGL Laser Measurement Systems). In this task, trees or other unnecessary objects surrounding the buildings were removed by the post-processing step.
Figure 10. Photorealistic 3-D building model by a terrestrial laser scanner.
5. Assessment of the 3-D building models
For the accuracy assessment, this research used a differential global navigation satellite system (DGNSS) algorithm, which provided a high degree of accuracy. The DGNSS consisted of a single reference station from which the raw data were sent to a rover receiver and, finally, the locations of the rover receiver were determined as the control points. As stated in Section 3, NRPs and VRSs were used as reference locations and determined through static GPS and TS surveying ((f)). The accuracy of the static GPS surveying was 5 mm horizontally and 10 mm vertically (USGS Citation2015). The generated VRS data were then sent to the user through a wireless connection. The VRS position played a critical role in assessing the accuracy of the 3-D building models developed in this research. This research used 30 VRSs (red star symbols in ) to assess the 3-D building model developed through the automated process. The stations were locations at the corners of the 30 buildings ((a–c)) and determined by real-time kinematic (RTK) GPS surveying, which was used to enhance the precision of the position data derived from the DGNSS. In general, the typical nominal accuracy of an RTK system is 1 cm horizontally and 2 cm vertically (USGS Citation2015). Therefore, this research used a Trimble R6 GNSS system to determine the VRSs for the accuracy assessments.
Figure 11. Accuracy assessment by measuring VRSs and control points.
(d,e) shows reference points used to assist the VRSs on the building corners. Shown as small triangles in (e), the reference points were determined where open-sky coverage was available and at the corners of the parking lots ((e-1)), which are clearly discernable in the aerial photographs. Other control points were painted in blue at the edge of the road line ((d-1)).
shows the vertical and horizontal differences between the positions of the VRSs ((a–c)) and those ((a-1 to c-1)) of the 3-D building model.
Table 1. Comparing horizontal and vertical locations with VRS positions.
The maximum differences of the horizontal (h) and vertical (v) locations are 36.2 and 17.2 cm, respectively. The minimum differences of h and v are +4.5 and –2.53 cm, respectively. The standard deviations range from 10 to 11.2 cm both horizontally and vertically. According to the 3-D spatial information construction work regulations (NGI Citation2013), the differences in a 3-D model’s horizontal (h) and vertical (v) locations must be within 40 and 30 cm, respectively, at a scale of 1:1000. As a result, all of the differences assessed in this research were within the ranges of the standard.
Furthermore, this research used the t-test statistic to verify whether the results of the 3-D building model were acceptable at a 95% confidence interval ().
Table 2. t-Test statistic result.
: Modeling results are equal to the locations of VRS.
: Modeling results are not equal to the locations of VRS.
With a confidence level , the t-test result should be within −2.045 ≤ t ≤ 2.045 in order to accept this hypothesis. If the result is less than −2.045 or greater than 2.045, then the hypothesis will be rejected. The t-test statistic is computed by the following equation:
As a result, the t-value is calculated as −1.176, as illustrated in .
Figure 12. Normal distribution of the t-test statistics.
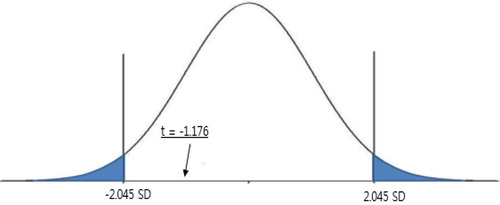
As shown in , the result is within the acceptable range, which means that the positional accuracy of the 3-D models acquired from the aerial images is significant and comparable with that of the control points acquired by terrestrial surveying.
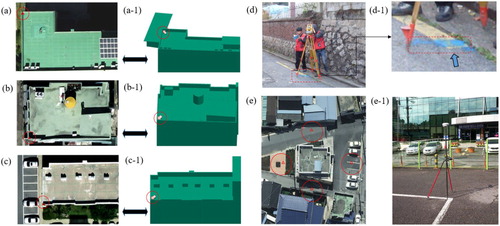
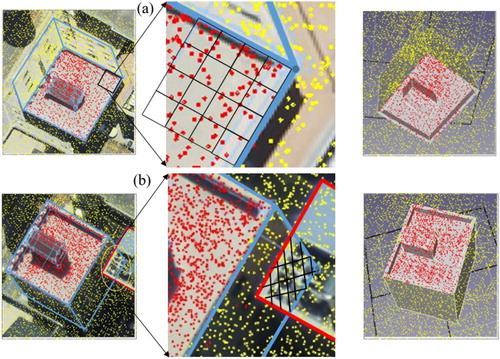
For assessment of the correctness of the 3-D model (i.e. shape similarity) (Henricsson and Baltsavias Citation1997; Vu, Yamazaki, and Matsuoka Citation2009), this research compared the areas of the 3-D model created in node 1 with those of the reference building model in node 2.
As shown in , the total area of the building tops ((a)) generated from the aerial images is approximately 426.00 m2, whereas the adjusted total area of the building tops ((b)) is approximately 414.00 m2. This shows that about 98% of the building tops match with those that were digitized through the plotting device.
Figure 13. Area-based assessment for correctness.
6. Discussion and conclusion
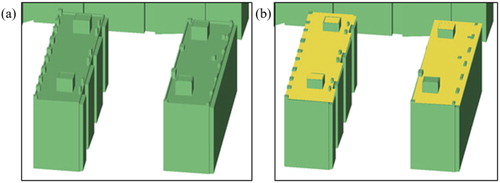
Modeling 3-D buildings, which allows urban planners or GIS professionals to create 3-D smart city models, has been of increasing interest among a wide range of research communities. With the increasing popularity and availability of LiDAR techniques, many studies have been conducted using an image-based approach, LiDAR techniques, or hybrid approaches. Despite the number of studies, it is still hard to create an accurate 3-D representation of a city across a wide area. As stated in the ‘Introduction’, an airborne laser scanner cannot produce a high point density of building facades. Therefore, it is difficult to accurately detect the boundary (building tops) or facade of a building. As shown in (a), there are no points on building façades located very close to another building ((b)). Furthermore, the LiDAR point density used in this research had an average of 5 points per square meter and a minimum of 2 points per square meter. Therefore, LiDAR multiple return points might not be located at the edges of a building top ((a)).
Figure 14. Comparing 3-D buildings with LiDAR point clouds.
With respect to the limitations of 3-D modeling, this research proposed a hybrid approach to improving the 3-D representation of buildings in densely populated urban areas. To support this notion, we developed an automated 3-D mapping application programmed in C++. In particular, this research improved the positional accuracy of the automated 3-D building models generated by two consecutive photographs. Approximately, 95% of the 3-D building models were perfectly matched, and the building tops and random errors were automatically adjusted by comparing them with building tops produced by the plotting instruments. Eventually, the resultant output was better than the vertical accuracy (25 cm) of the airborne LiDAR data. Furthermore, the accuracy of the DTMs used in this research was ±15 cm.
For the area-based assessment, the areas of the building tops generated from the aerial images are approximately matched with 98% of the building tops derived through the plotting instrument. Furthermore, the adjusted 3-D models were quantitatively assessed by the NRPs and VRSs, as determined by the TS and GPS techniques. The differences between the horizontal and vertical positions were within the 3-D spatial information construction work regulations. Furthermore, two ground-based surveying instruments were necessary for modeling intricate 3-D buildings. It was obvious that the terrestrial TS or laser scanner was able to model both simple and elaborate building facades. In the suitability analysis using the t-test statistic, the result was within the acceptable range. Therefore, for large geographic areas, a 3-D building model from oblique aerial images is necessary and superior to that obtained through airborne LiDAR technology. However, a hybrid approach to terrestrial surveying was still necessary.
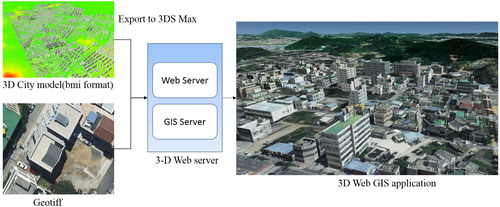
Once the two building models were generated, this research published the 3-D building models on the web. In particular, the 3-D buildings were converted to 3-DS format, and the oblique images (Geotiff format) were integrated into a 3-D GIS web server (). The authors demonstrated a 3-D city model with the textures of building facades from the aerial images. In the short term, the 3-D web GIS application will be available to the public.
Figure 15. Developing a GIS database and a 3-D Web GIS Server for 3-D city model.
Although this research proposes a hybrid 3-D model for a large city area, there exist some limitations. A 3-D city or building model needs 3-D building textures such as those acquired from oblique aerial photographs. However, the 3-D textures acquired from oblique images are sometimes of poor quality due to distortion (Kersten and Stallmann Citation2012).
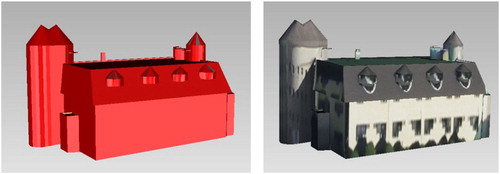
This research performed texture mapping for the 3-D building model. However, as shown in , the 3-D model could not be used for other applications, such as virtual tourism or commercial purposes. This was due to low texture quality and distorted images. Even if it could create photorealistic 3-D representations that allowed us to spatially recognize and understand an area of interest, a higher quality of textures would extend this technique to more practical applications.
Figure 16. 3-D building modeling and texturing generated by aerial photos.
To summarize, this research used a combination of aerial images and ground-based measurements to create a 3-D model for a large city and developed an automated process to improve the accuracy of the 3-D building model. Future research will develop approaches to evaluate the quality of the textures – in particular, for facade textures acquired from oblique aerial images. Accordingly, the resultant outputs will be beneficial for automated 3-D building models across extensive areas and for frequent updates by hybrid 3-D building modeling approaches.
Disclosure statement
No potential conflict of interest was reported by the authors.
References
- Abayowa, B. O., A. Yilmaz, and R. C. Hardie. 2015. “Automatic Registration of Optical Aerial Imagery to a LiDAR Point Cloud for Generation of City Models.” ISPRS Journal of Photogrammetry and Remote Sensing 106: 68–81. doi: 10.1016/j.isprsjprs.2015.05.006
- Arayici, Y. 2007. “An Approach for Real World Data Modelling with the 3D Terrestrial Laser Scanner for Built Environment.” Automation in Construction 16 (6): 816–829. doi: 10.1016/j.autcon.2007.02.008
- BAE Systems. 2007. “SOCET SET User’s Manual.” BAE Systems, National Security Solutions Inc.
- Chen, Z. Y., B. Devereux, B. B. Gao, and G. Amable. 2012. “Upward-fusion Urban DTM Generating Method Using Airborne Lidar Data.” ISPRS Journal of Photogrammetry and Remote Sensing 72: 121–130. doi: 10.1016/j.isprsjprs.2012.07.001
- Chen, Z., B. Gao, and B. Devereux. 2017. “State-of-the-art: DTM Generation Using Airborne Lidar Data.” Sensors 17 (1): 150. doi: 10.3390/s17010150
- Chen, Z. Y., B. Xu, and B. B. Gao. 2016. “An Image-segmentation-based Urban DTM Generation Method Using Airborne Lidar Data.” IEEE Journal of Selected Topics in Applied Earth Observations and Remote Sensing 9 (1): 496–506. doi: 10.1109/JSTARS.2015.2512498
- Cheng, L., J. Gong, X. Chen, and P. Han. 2008. “Building Boundary Extraction from High Resolution Imagery and Lidar Data.” International Archives of the Photogrammetry, Remote Sensing and Spatial Information Sciences 37: 693–698.
- Congalton, R. G., and K. Green. 2008. Assessing the Accuracy of Remotely Sensed Data: Principles and Practices. Boca Raton, FL: CRC Press.
- Demir, N., and E. Baltsavias. 2012. “Automated Modeling of 3D Building Roofs Using Image and LiDAR Data.” Proceedings of the XXII Congress of the International Society for Photogrammetry, Remote Sensing, Melbourne, Australia , Vol. 25.
- Ding, M., K. Lyngbaek, and A. Zakhor. 2008. “Automatic Registration of Aerial Imagery with Untextured 3d Lidar Models.” IEEE Conference on Computer Vision and Pattern Recognition (CVPR), Anchorage, AK, USA , 1–8.
- Frere, D., J. Vandekerckhove, T. Moons, and L. V. Goo. 1998. “Automatic Modelling and 3D Reconstruction of Urban Buildings from Aerial Imagery.” Geoscience and Remote Sensing Symposium Proceedings (IGARSS'98), 1998 IEEE International Symposium, Seattle, WA , Vol. 5, 2593–2596.
- Früh, C., R. Sammon, and A. Zakhor. 2004. “Automated Texture Mapping of 3D City Models with Oblique Aerial Imagery.” IEEE Proceedings of 2nd International Symposium on 3D Data Processing, Visualization and Transmission (3DPVT), Thessaloniki, Greece , 396–403.
- Früh, C., and A. Zakhor. 2001. “3D Model Generation for Cities Using Aerial Photographs and Ground Level Laser Scans.” Proceedings of the 2001 IEEE Computer Society Conference on Computer Vision and Pattern Recognition (CVPR), Kauai, Hawaii, USA , Vol. 2, II–31.
- Früh, C., and A. Zakhor. 2003. “Constructing 3D City Models by Merging Ground-based and Airborne Views.” IEEE Computer Society Conference on Computer Vision and Pattern Recognition, Madison, WI , June 16–22.
- Früh, C., and A. Zakhor. 2004. “An Automated Method for Large-Scale, Ground-based City Model Acquisition.” International Journal of Computer Vision 60 (1): 5–24. doi: 10.1023/B:VISI.0000027787.82851.b6
- Gonçalves, G. 2006. “Analysis of Interpolation Errors in Urban Digital Surface Models Created from LIDAR Data.” In Proceedings of the 7th International Symposium on Spatial Accuracy Assessment in Resources and Environment Sciences, edited by M. Caetano and M. Painho. Lisbon: Sana Hotel. July 5.
- Haala, N., and M. Kada. 2010. “An Update on Automatic 3D Building Reconstruction.” ISPRS Journal of Photogrammetry and Remote Sensing 65: 570–580. doi: 10.1016/j.isprsjprs.2010.09.006
- Haala, N., M. Rothermel, and S. Cavegn. 2015. “Extracting 3D Urban Models from Oblique Aerial Images.” IEEE 2015 Joint Urban Remote Sensing Event (JURSE), 1–4.
- Henricsson, O., and E. Baltsavias. 1997 . “3-D Building Reconstruction with ARUBA: A Qualitative and Quantitative Evaluation.” 65–76. Basel: Birkhäuser.
- Heo, J., S. Jeong, H. K. Park, J. Jung, S. Han, S. Hong, and H. G. Sohn. 2013. “Productive High-complexity 3D City Modeling with Point Clouds Collected from Terrestrial LiDAR.” Computers, Environment and Urban Systems 41: 26–38. doi: 10.1016/j.compenvurbsys.2013.04.002
- Kersten, T., and D. Stallmann. 2012. “Automatic Texture Mapping of Architectural and Archaeological 3d Models.” ISPRS – International Archives of the Photogrammetry, Remote Sensing and Spatial Information Sciences XXXIX-B5 (5): 273–278. doi: 10.5194/isprsarchives-XXXIX-B5-273-2012
- Kraus, K., and N. Pfeifer. 1998. “Determination of Terrain Models in Wooded Areas with Airborne Laser Scanner Data.” ISPRS Journal of Photogrammetry and Remote Sensing 53: 193–203. doi: 10.1016/S0924-2716(98)00009-4
- Lafarge, F., and C. Mallet. 2012. “Creating Large-scale City Models from 3D-Point Clouds: A Robust Approach with Hybrid Representation.” International Journal of Computer Vision 99 (1): 69–85. doi: 10.1007/s11263-012-0517-8
- Leica Geosystem. 2006. “Leica ALS50-II Airborne Laser Scanner Product Specifications.” Heerbrugg, Switzerland.
- Liang, J., S. Shen, J. Gong, J. Liu, and J. Zhang. 2017. “Embedding User-generated Content into Oblique Airborne Photogrammetry-based 3D City Model.” International Journal of Geographical Information Science 31 (1): 1–16. doi: 10.1080/13658816.2016.1180389
- Mastin, A., J. Kepner, and J. Fisher. 2009. “Automatic Registration of LIDAR and Optical Images of Urban Scenes.” IEEE Conference On Computer Vision and Pattern Recognition (CVPR), Miami, FL, USA , 2639–2646.
- Microsoft. 2008. “ UltraCam-Xp Technical Specifications.” Accessed 20 August 2015. http://download.microsoft.com/download/8/5/A/85A3648B-B4F5-46D6-80E6-C0698A2EE109/UCXp-Technical/UltraCamXp-Technical.pdf.
- Moons, T., D. Frère, J. Vandekerckhove, and L. Van Gool. 1998. “ Automatic Modelling and 3D Reconstruction of Urban House Roofs from High Resolution Aerial Imagery.” Computer Vision – ECCV'98, 410–425, Berlin, Springer.
- Morgan, D., and E. Falkner. 2001. Aerial Mapping: Methods and Applications. Boca Raton, FL: CRC Press.
- NGI (National Geography Institute). 2013. “ 3D Land Spatial Information Work Regulation.” Accessed May 2014. http://www.law.go.kr/admRulLsInfoP.do?admRulSeq=2000000085691.
- NOAA (National Oceanic and Atmospheric Administration) Coastal Services Center. 2012. “ Lidar 101: An Introduction to Lidar Technology, Data, and Applications.” Charleston, SC: NOAA Coastal Services Center. Accessed 19 August 2015. http://coast.noaa.gov/digitalcoast/_/pdf/lidar101.pdf.
- NovAtel. 2017. “ GrafNav GNSS Post-Processing Software.” Calgary, Canada. Accessed 18 August 2017. https://www.novatel.com/products/software/grafnav/.
- Pflipsen, B. 2007. “Volume Computation: A Comparison of Total Station Versus Laser Scanner and Different Software”. Accessed Jun 2014. http://www.diva-portal.org/smash/record.jsf?pid=diva2%3A120447&dswid=-3618.
- Poullis, C., and S. You. 2009. “ Automatic Reconstruction of Cities from Remote Sensor Data.” Proceeding of IEEE Conference on Computer Vision and Pattern Recognition (CVPR), 20–25, Miami Beach, FL, June.
- RIEGL. 2015. “ 3D Terrestrial Laser Scanner with Online Waveform Processing.” Horn, Austria. Accessed 20 March 2015. http://www.riegl.com/uploads/tx_pxpriegldownloads/DataSheet_VZ-1000_2015-03-24.pdf.
- Rottensteiner, F. 2003. “Automatic Generation of High-quality Building Models from LiDAR Data.” IEEE Computer Graphics and Applications 23: 42–50. doi: 10.1109/MCG.2003.1242381
- Shan, J., and C. K. Toth. 2008. Topographic laser Ranging and Scanning: Principles and Processing. Boca Raton, FL: CRC Press.
- Stilla, U., J. Kolecki, and L. Hoegner. 2009. “ Texture Mapping of 3D Building Models with Oblique Direct Geo-Referenced Airborne IR Image Sequences.” Proceedings of ISPRS Hannover Workshop.
- Sun, S., and C. Salvaggio. 2013. “Aerial 3D Building Detection and Modeling from Airborne LiDAR Point Clouds.” IEEE Journal of Selected Topics in Applied Earth Observations and Remote Sensing 6 (3): 1440–1449. doi: 10.1109/JSTARS.2013.2251457
- Toschi, I., E. Nocerino, F. Remondino, A. Revolti, G. Soria, and S. Piffer. 2017. “Geospatial Data Processing for 3D City Model Generation, Management and Visualization.” International Archives of the Photogrammetry, Remote Sensing & Spatial Information Sciences, Hannover, Germany , Vol. 42.
- Trimble. 2001. “ Trimble 3300 Total Station, Economical, Easy-to-use Direct Reflex 3D Measurement System.” Dayton, OH.
- Turlapaty, A., B. Gokaraju, Q. Du, N. H. Younan, and J. V. Aanstoos. 2012. “A Hybrid Approach for Building Extraction from Spaceborne Multi-angular Optical Imagery.” IEEE Journal of Selected Topics in Applied Earth Observations and Remote Sensing 5 (1): 89–100. doi: 10.1109/JSTARS.2011.2179792
- USGS (United States and Geological Survey). 2015. “USGS Global Positioning Application and Practice.” Accessed 24 August 2015. http://water.usgs.gov/osw/gps/.
- Vu, T. T., F. Yamazaki, and M. Matsuoka. 2009. “Multi-scale Solution for Building Extraction from LiDAR and Image Data.” International Journal of Applied Earth Observation and Geoinformation 11 (4): 281–289. doi: 10.1016/j.jag.2009.03.005
- Wang, R. 2013. “3D Building Modeling Using Images and LiDAR: A Review.” International Journal of Image and Data Fusion 4 (4): 273–292. doi: 10.1080/19479832.2013.811124
- Wang, L., and U. Neumann. 2009. “A Robust Approach for Automatic Registration of Aerial Images with Untextured Aerial Lidar Data.” IEEE Conference on Computer Vision and Pattern Recognition (CVPR), Miami, FL, USA , 2623–2630.
- Xiao, J., M. Gerke, and G. Vosselman. 2012. “Building Extraction from Oblique Airborne Imagery Based on Robust Façade Detection.” ISPRS Journal of Photogrammetry and Remote Sensing 68: 56–68. doi: 10.1016/j.isprsjprs.2011.12.006
- Xie, J., L. Zhang, J. Li, H. Wang, and L. Yang. 2012. “Automatic Simplification and Visualization of 3D Urban Building Models.” International Journal of Applied Earth Observation and Geoinformation 18: 222–231. doi: 10.1016/j.jag.2012.01.014
- Yang, B. 2016. “GIS Based 3-D Landscape Visualization for Promoting Citizen's Awareness of Coastal Hazard Scenarios in Flood Prone Tourism Towns.” Applied Geography 76: 85–97. doi: 10.1016/j.apgeog.2016.09.006
- Yang, B., M. Kim, and M. Madden. 2012. “Assessing Optimal Image Fusion Methods for Very High Spatial Resolution Satellite Images to Support Coastal Monitoring.” GIScience & Remote Sensing 49 (5): 687–710. doi: 10.2747/1548-1603.49.5.687
- Yong, L., and W. Huayi. 2008. “Adaptive Building Edge Detection by Combining LiDAR Data and Aerial Images.” The International Archives of the Photogrammetry, Remote Sensing and Spatial Information Sciences 37: 197–202.